- Transportation
Person Trips
-
1. Purposes of the Trip
1.1. Trips made in Seoul
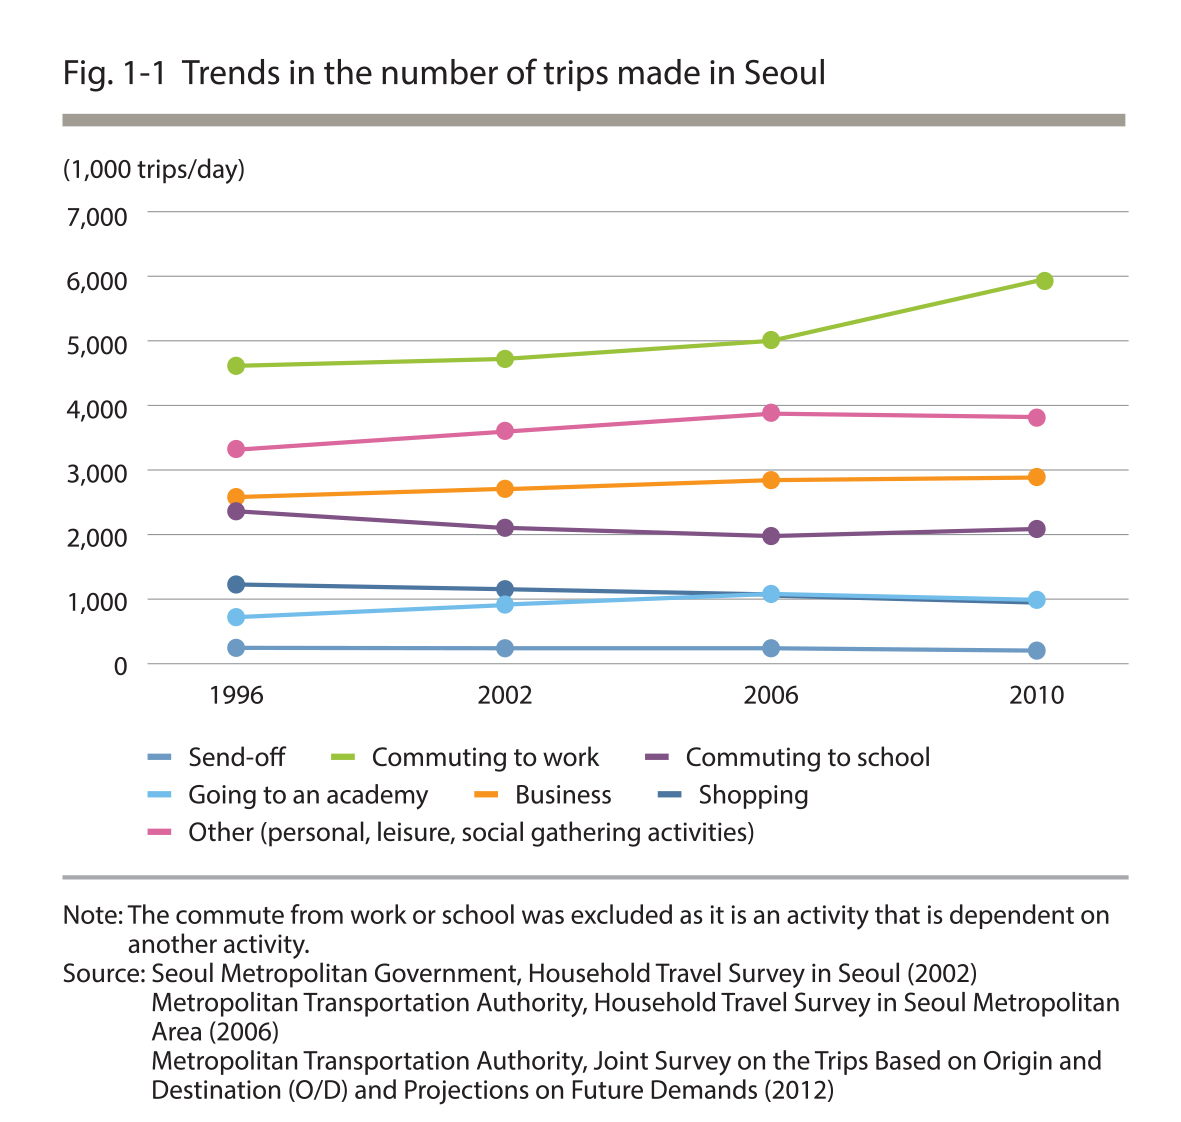
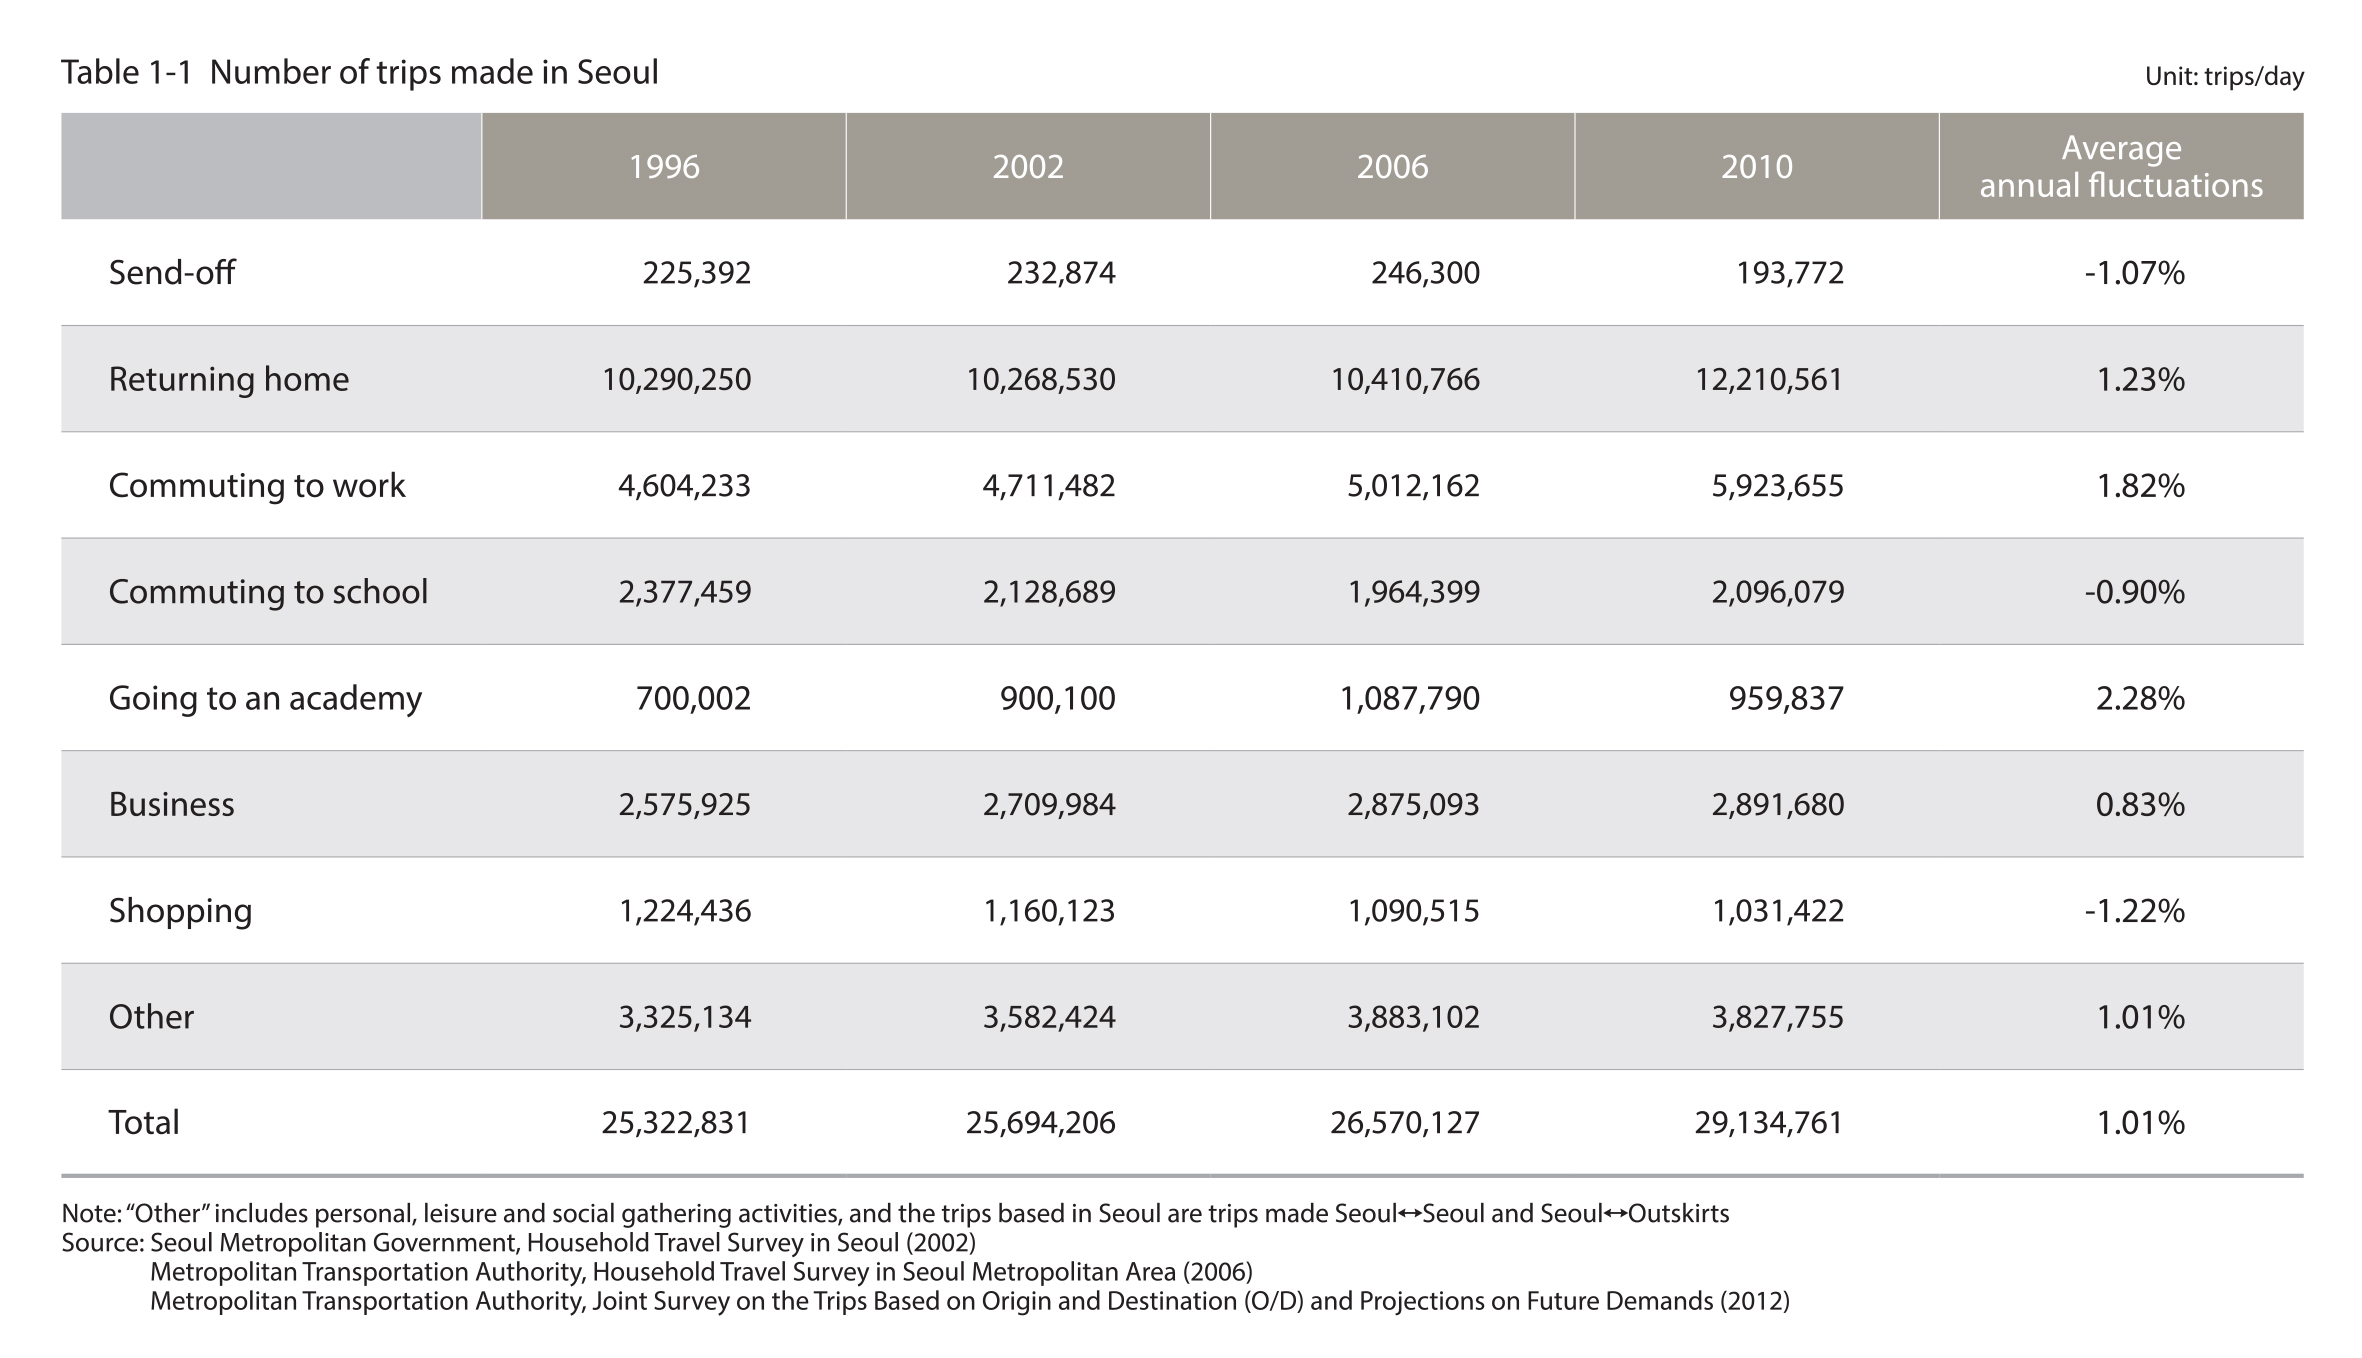
The total number of trips made in Seoul was 29,135,000 in 2010, which was an increase of 3,812,000 from 1996
The number of trips made in Seoul means the number of trips to and from and also within Seoul. In 2010, of the trips made in Seoul (excluding the number of trips from work), the number of trips to work was the highest at 5,924,000, followed by trips for social gathering, leisure and personal purposes (3,828,000 trips) and trips for business purposes (2,892,000). In 2010, the total number of trips made in Seoul was 29,135,000, which was about a 15% increase (3,812,000) from 25,323,000 trips recorded in 1996. A comparison of the purposes of the trips made in 1996 and 2010 revealed that the number of trips made for going to school, shopping and sending-off decreased, while the number of trips for going to work, academy, returning home and business had increased.
The number of trips made in Seoul for going to an academy and business purposes increased by 2.28% and 1.82%
The number of trips for commuting to work, commuting to an academy, and for business purposes increased by 1.82%, 2.28% and 0.83%, respectively, on average every year from 1996 to 2010. On the other hand, the trips made for the purpose of commuting to school and going shopping decreased slightly by 0.90% and 1.22%.
Source : Seoul Metropolitan Government, Household Travel Survey in Seoul (2002)
Metropolitan Transportatlon Authorlty, Household Travel Survey in Seoul Metropolitan Area (2006)
Metropolitan Transportatlon Authority,Joint Survey on the Trips Based on Origin and Destination (O/D) and Projections on Future Demands (2012)
The total number of trips made in Seoul in the morning rush hour in 2010 was 5,922,000, which was an increase of 1,126,000 from 2002
The total number of trips made in Seoul in the morning rush hour (peak hour) increased by 1,126,000 from 4 ,796,000 in 2002 to 5,922,000 in 2010. The trips made within Seoul showed an average annual increase of 2.02%, while the number of trips made from and to Seoul increased more significantly at an average annual increase of 4.63%.
Source : Seoul Metropolitan Government, Household Travel Survey in Seoul (2002)
Metropolitan Transportatlon Authorlty, Household Travel Survey in Seoul Metropolitan Area (2006)
Metropolitan Transportatlon Authority,Joint Survey on the Trips Based on Origin and Destination (O/D) and Projections on Future Demands (2012)
More trips based in Seoul are for going to work and academy and fewer trips with the purposes for school, business and shopping in the morning rush hour
As for the number of trips made in Seoul in the morning rush hour in 2010, the number of trips for commuting to work and going to an academy accounted for a higher percentage of the total trips, while the number of trips for commuting to school, business purposes and shopping accounted for a lower percentage of the total trips. The number of trips to school, in particular, decreased at the greatest rate from 1,715,000 in 1996 to 1,558,000 in 2010 (decrease by 156,000 and ratio of 9.43%).
.jpg)
Source : Seoul Metropolitan Government, Household Travel Survey in Seoul (2002)
Metropolitan Transportatlon Authorlty, Household Travel Survey in Seoul Metropolitan Area (2006)
Metropolitan Transportatlon Authority, Joint Survey on the Trips Based on Origin and Destination (O/D) and Projections on Future Demands (2012)
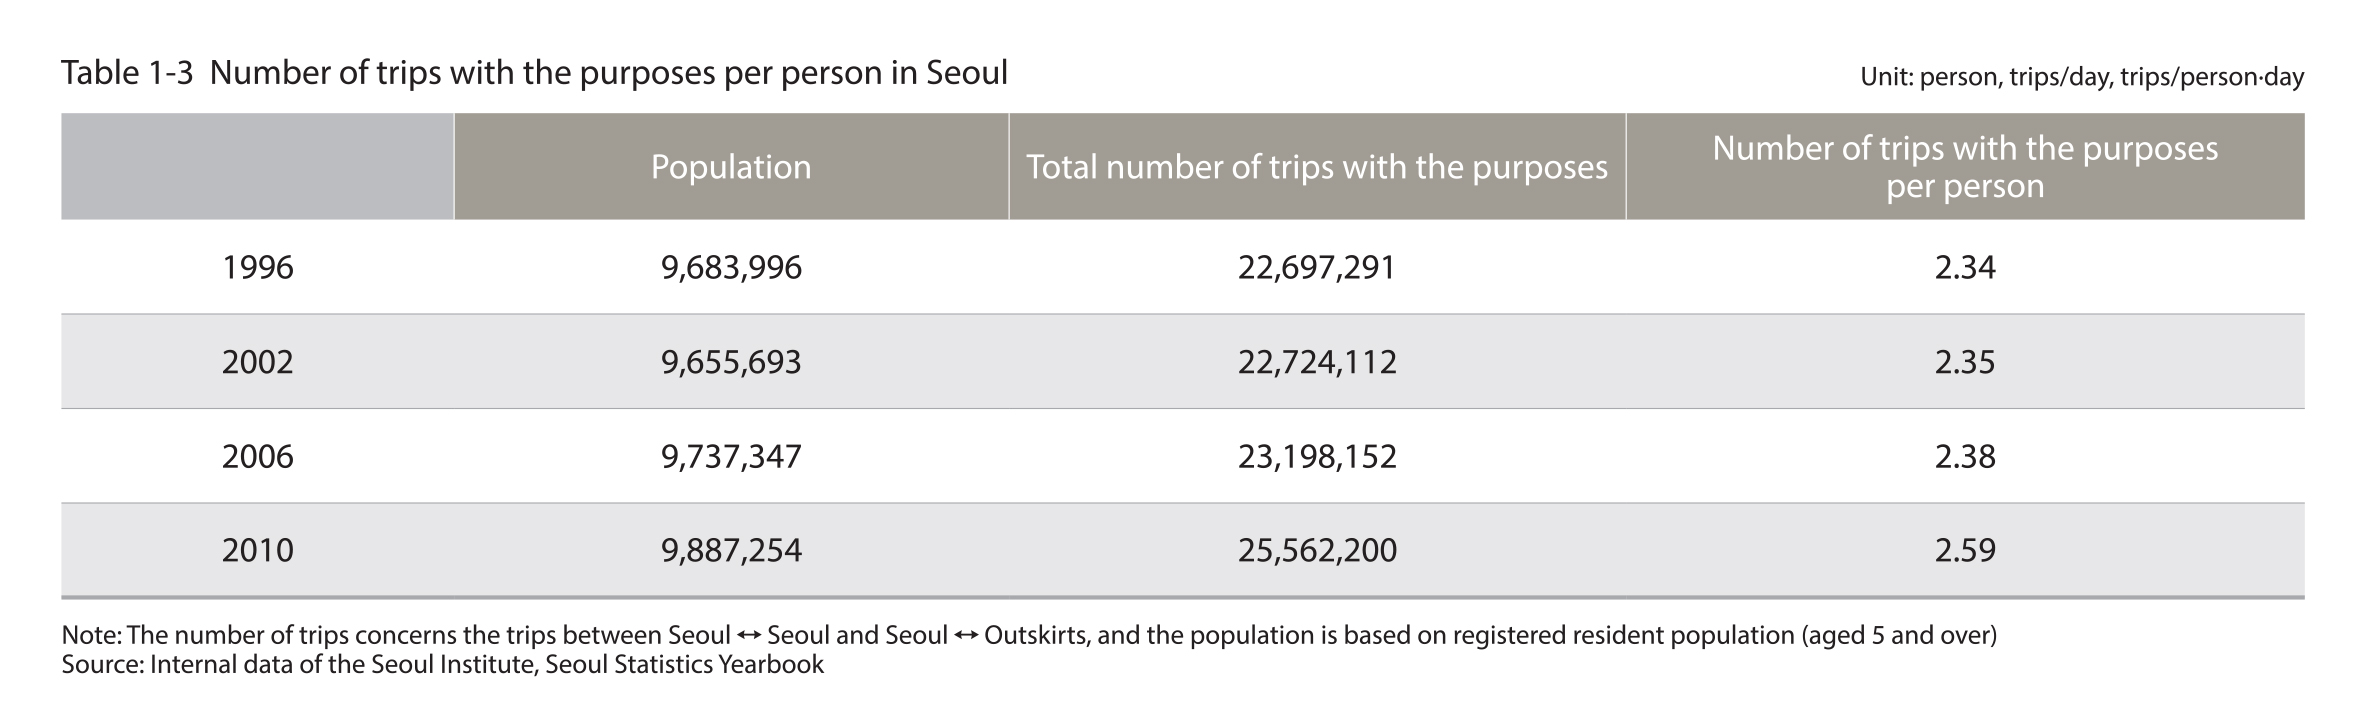
The number of trips per person in Seoul increased by 0.24 from 2.34 in 1996 to 2.59 in 2010
The number of daily trips with the purposes per person aged 5 and older in Seoul was 2.59 in 2010, which was a 10.3% (0.24 trips/person) increase compared to 2.34 trips/person recorded in 1996. This shows that the number of trips per person increased at a higher rate than the population increase.
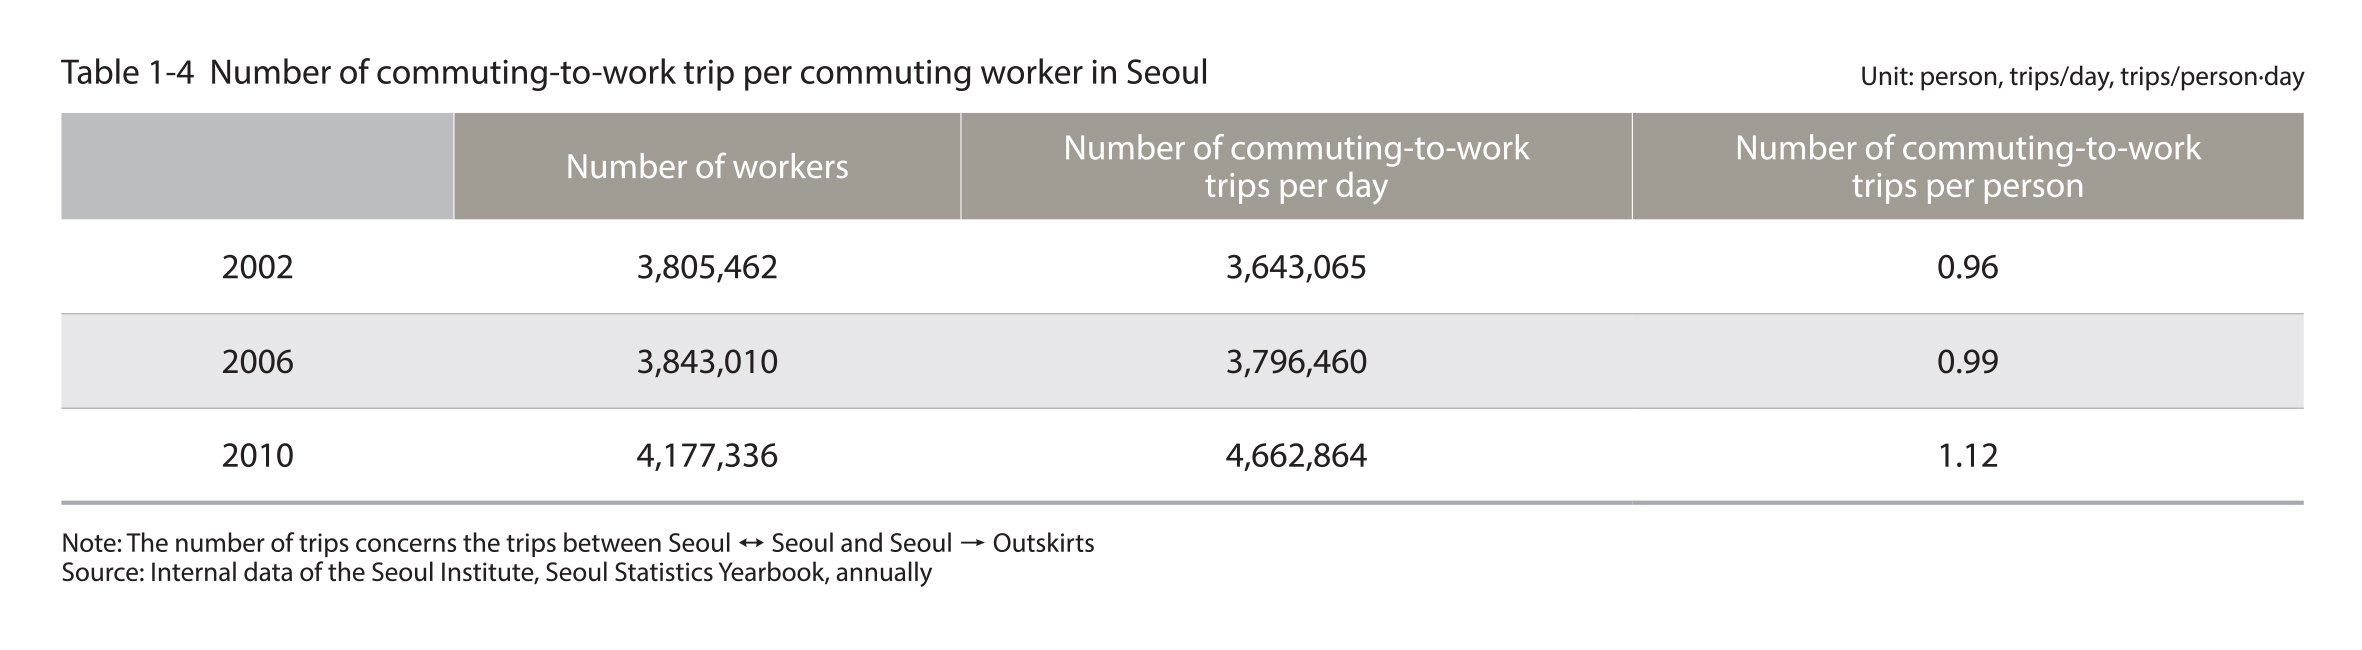
The number of commuting-to-work trips per worker increased by 0.16 from 0.96 in 1996 to 1.12 in 2010
In 2010, there were 4,177,000 workers in Seoul and 4,663,000 commuting-to-work trips were made on a daily basis, on average. Based on these figures, the number of commuting-to-work trips made per worker was 1.12, which was a 0.16 increase from 1996. It is deemed that the ratio exceeded 1 because there were workers who performed diverse types of work on a daily basis.
Source : Internal data of the Seoul lnstitute, Seoul Statistics Yearbook
Source : Internal data of the Seoul lnstitute, Seoul Statistics Yearbook, annually
1.2. Trips made in the Seoul Metropolitan Area
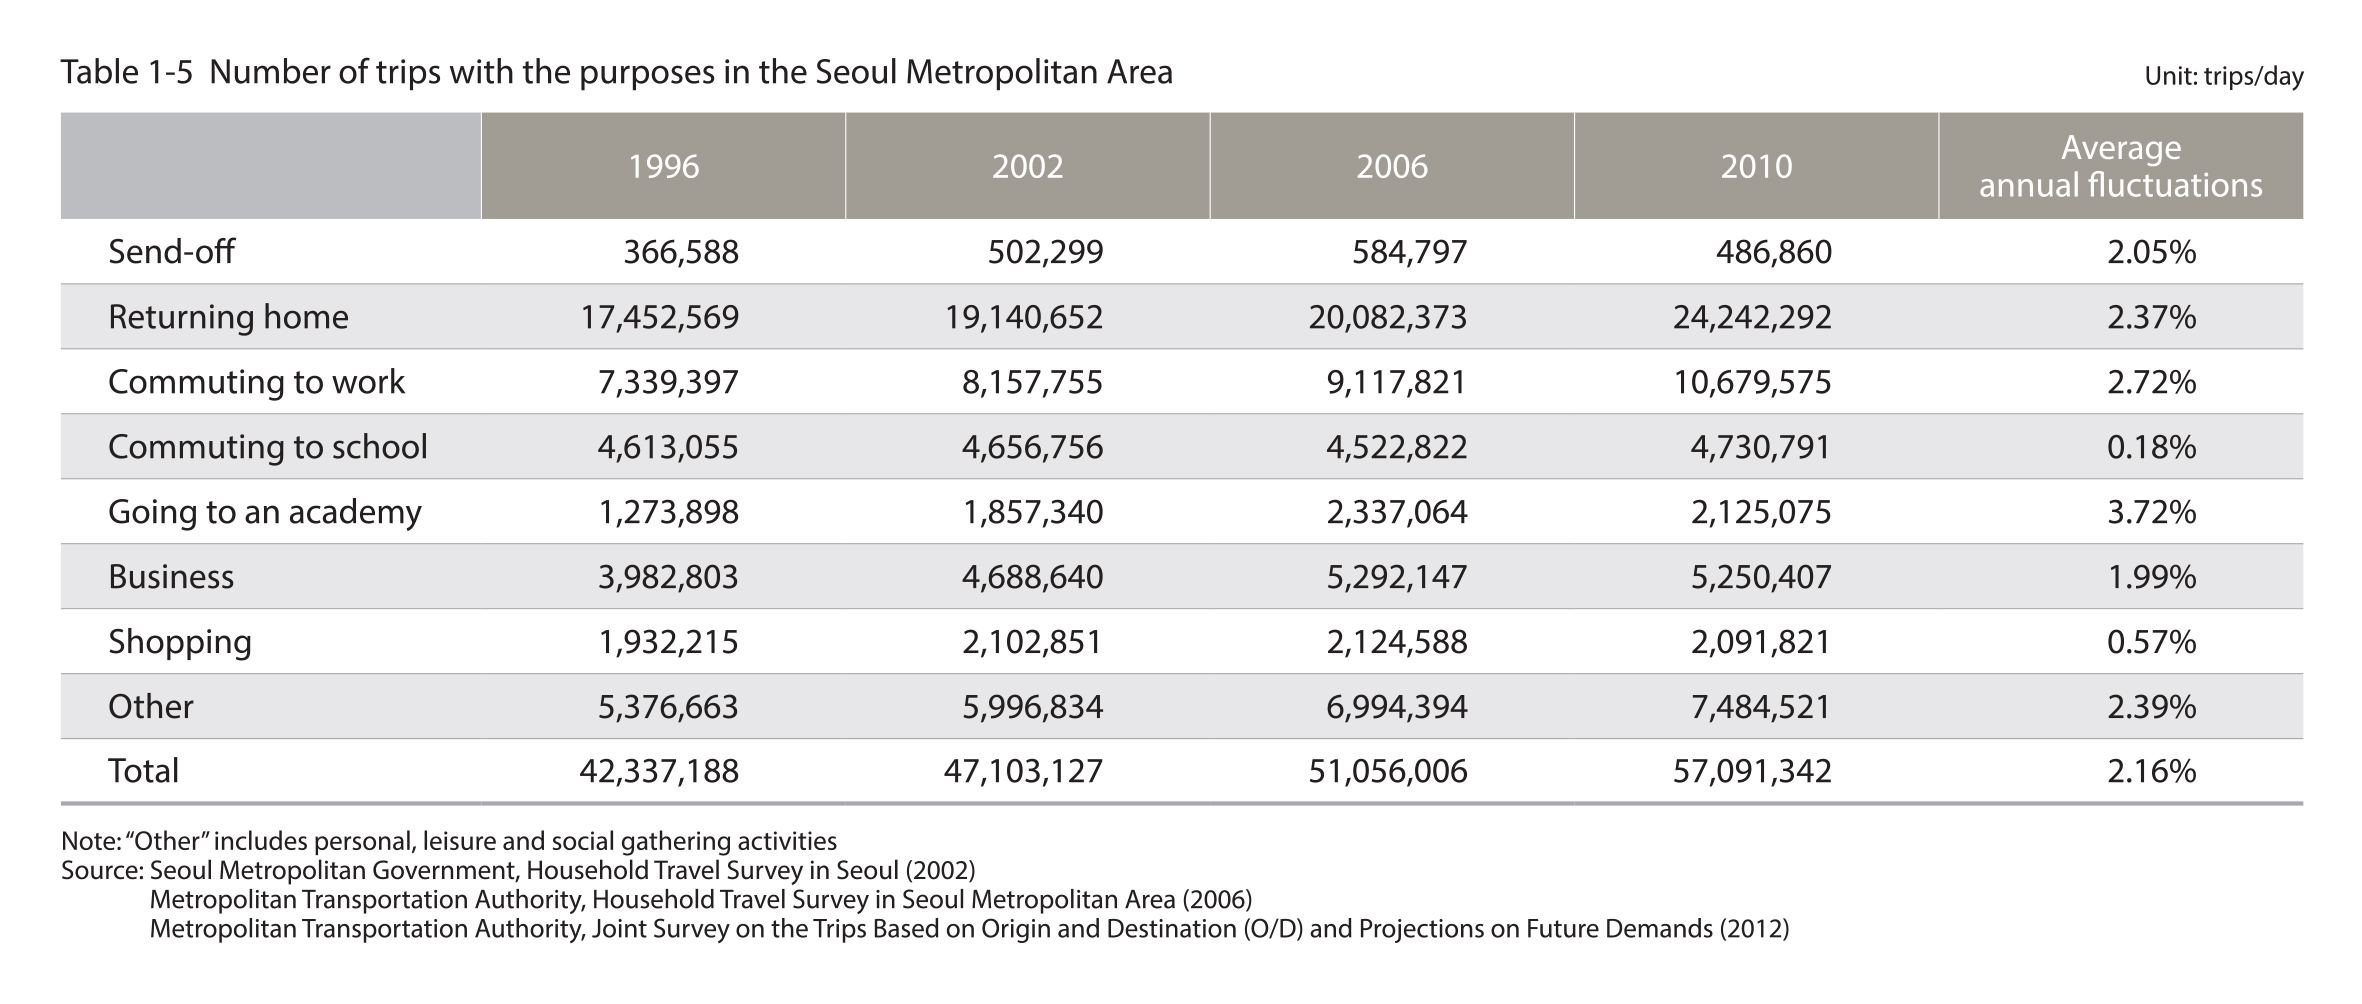
The total number of trips made in the Seoul Metropolitan Area was 57,091,000 in 2010, which was an increase of 14,754,000 from 1996
In 2010, of the trips made in the Seoul Metropolitan Area (excluding the commuting trips from work), the number of trips to work was the highest at 10,680,000, followed by trips for social gatherings, leisure and personal purposes (7,485,000 trips) and trips for business purposes (5,250,000). In 2010, the total number of trips with the purposes in the Seoul Metropolitan Area was 57,091,000, which was about a 34.85% (4,754,000) increase from 57,091,000 trips recorded in 1996. A comparison based on the purposes of the trips made in 1996 and 2010 revealed that the number of trips made for the purpose of commuting to school and going shopping decreased, while the number of trips made for the purpose of returning home, commuting to work or commuting to an academy increased.
The number of trips made in the Seoul Metropolitan Area for the purpose of going to an academy increased by 3.72%
There was an increased number of trips made for the purpose of returning home, commuting to work, other purposes (social gatherings, leisure and personal purposes), and business purpose in this order. Of these, the number of trips made for the purpose of commuting to an academy increased at the most significant rate at 3.72% (851,000 trips), but this number dropped again between 2006 and 2010.
Source : Seoul Metropolitan Government, Household Travel Survey in Seoul (2002)
Metropolitan Transportation Authority, Household Travel Survey in Seoul Metropolitan Area (2006)
Metropolitan Transportation Authority, Joint Survey on the Trips Based on Origin and Destination (O/D) and Projections on Future Demands (2012)
The total number of trips in the morning rush hour in 2010 was 11,841,000 which was an increase of 2,382,000 from 2002
The total number of trips made in the morning rush hour (peak hour) increased by 2,382,000 from 9,459,000 in 2002 to 9,459,000 in 2010. As for the traffic concentration ratio during the morning rush hour, it was 20.9% for the Seoul Metropolitan Area, 19.0% for Seoul, 22.1% for Incheon and 22.5% for Gyeonggi Province.
More trips with the purposes of going to work and academy and fewer trips with the purposes for school, business and shopping in the morning rush hour
Compared to the number of trips made in the morning rush hour in the Seoul Metropolitan Area in 2002, the trips for commuting to work increased by 2,241,000 in 2010 and the composition ratio also increased by over 10.2%p. On the other hand, the trips for commuting to school decreased by 155,000, and the composition ratio also decreased by over 9.8%p.
.jpg)
Source : Seoul Metropolitan Government, Household Travel Survey in Seoul (2002)
Metropolitan Transportation Authority, Household Travel Survey in Seoul Metropolitan Area (2006)
Metropolitan Transportation Authority, Joint Survey on the Trips Based on Origin and Destination (O/D) and Projections on Future Demands (2012)
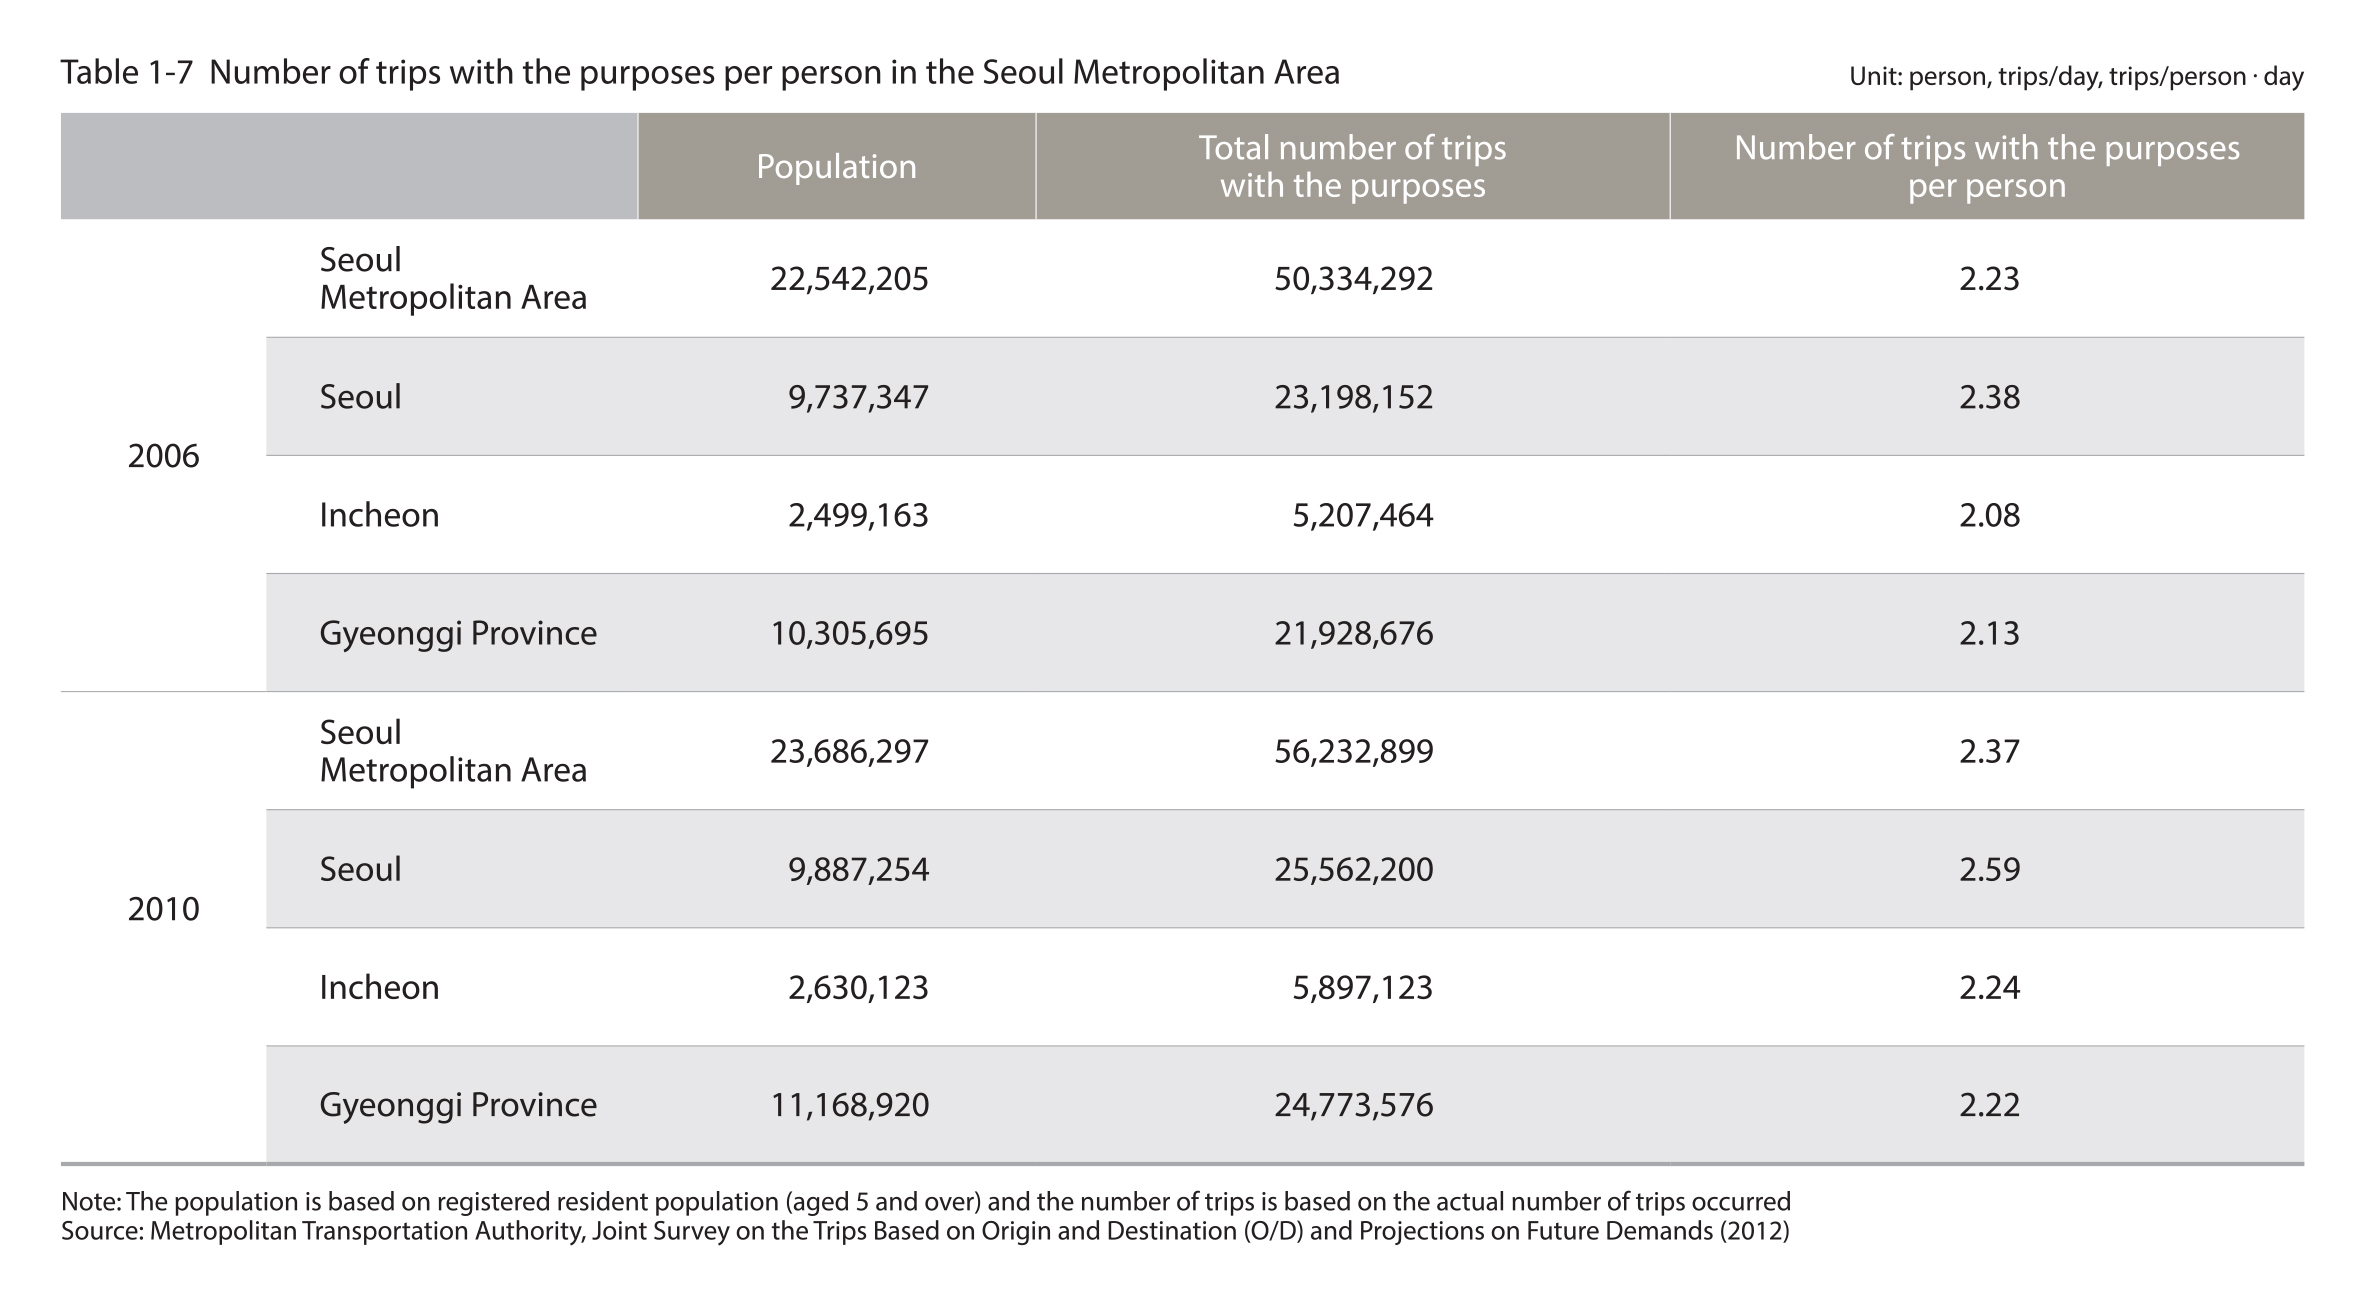
The number of trips per person increased by 0.14 from 2.23 in 1996 to 2.37 in 2010
The population of the Seoul Metropolitan Area was 23,686,000 in 2010. The number of trips with the purposes per person was 2.37 in 2010, and this was an increase of 0.14 from 2.23 reported in 2006. To be more specific, the number of trips per person in 2010 was 2.59 in Seoul, 2.24 in Incheon and 2.22 in Gyeonggi Province.
Source : Metropolitan Transportatlon Authority, Joint Survey on the Trips Based on Orijin and Destination (O/D) and projections on Future Demands (2012)
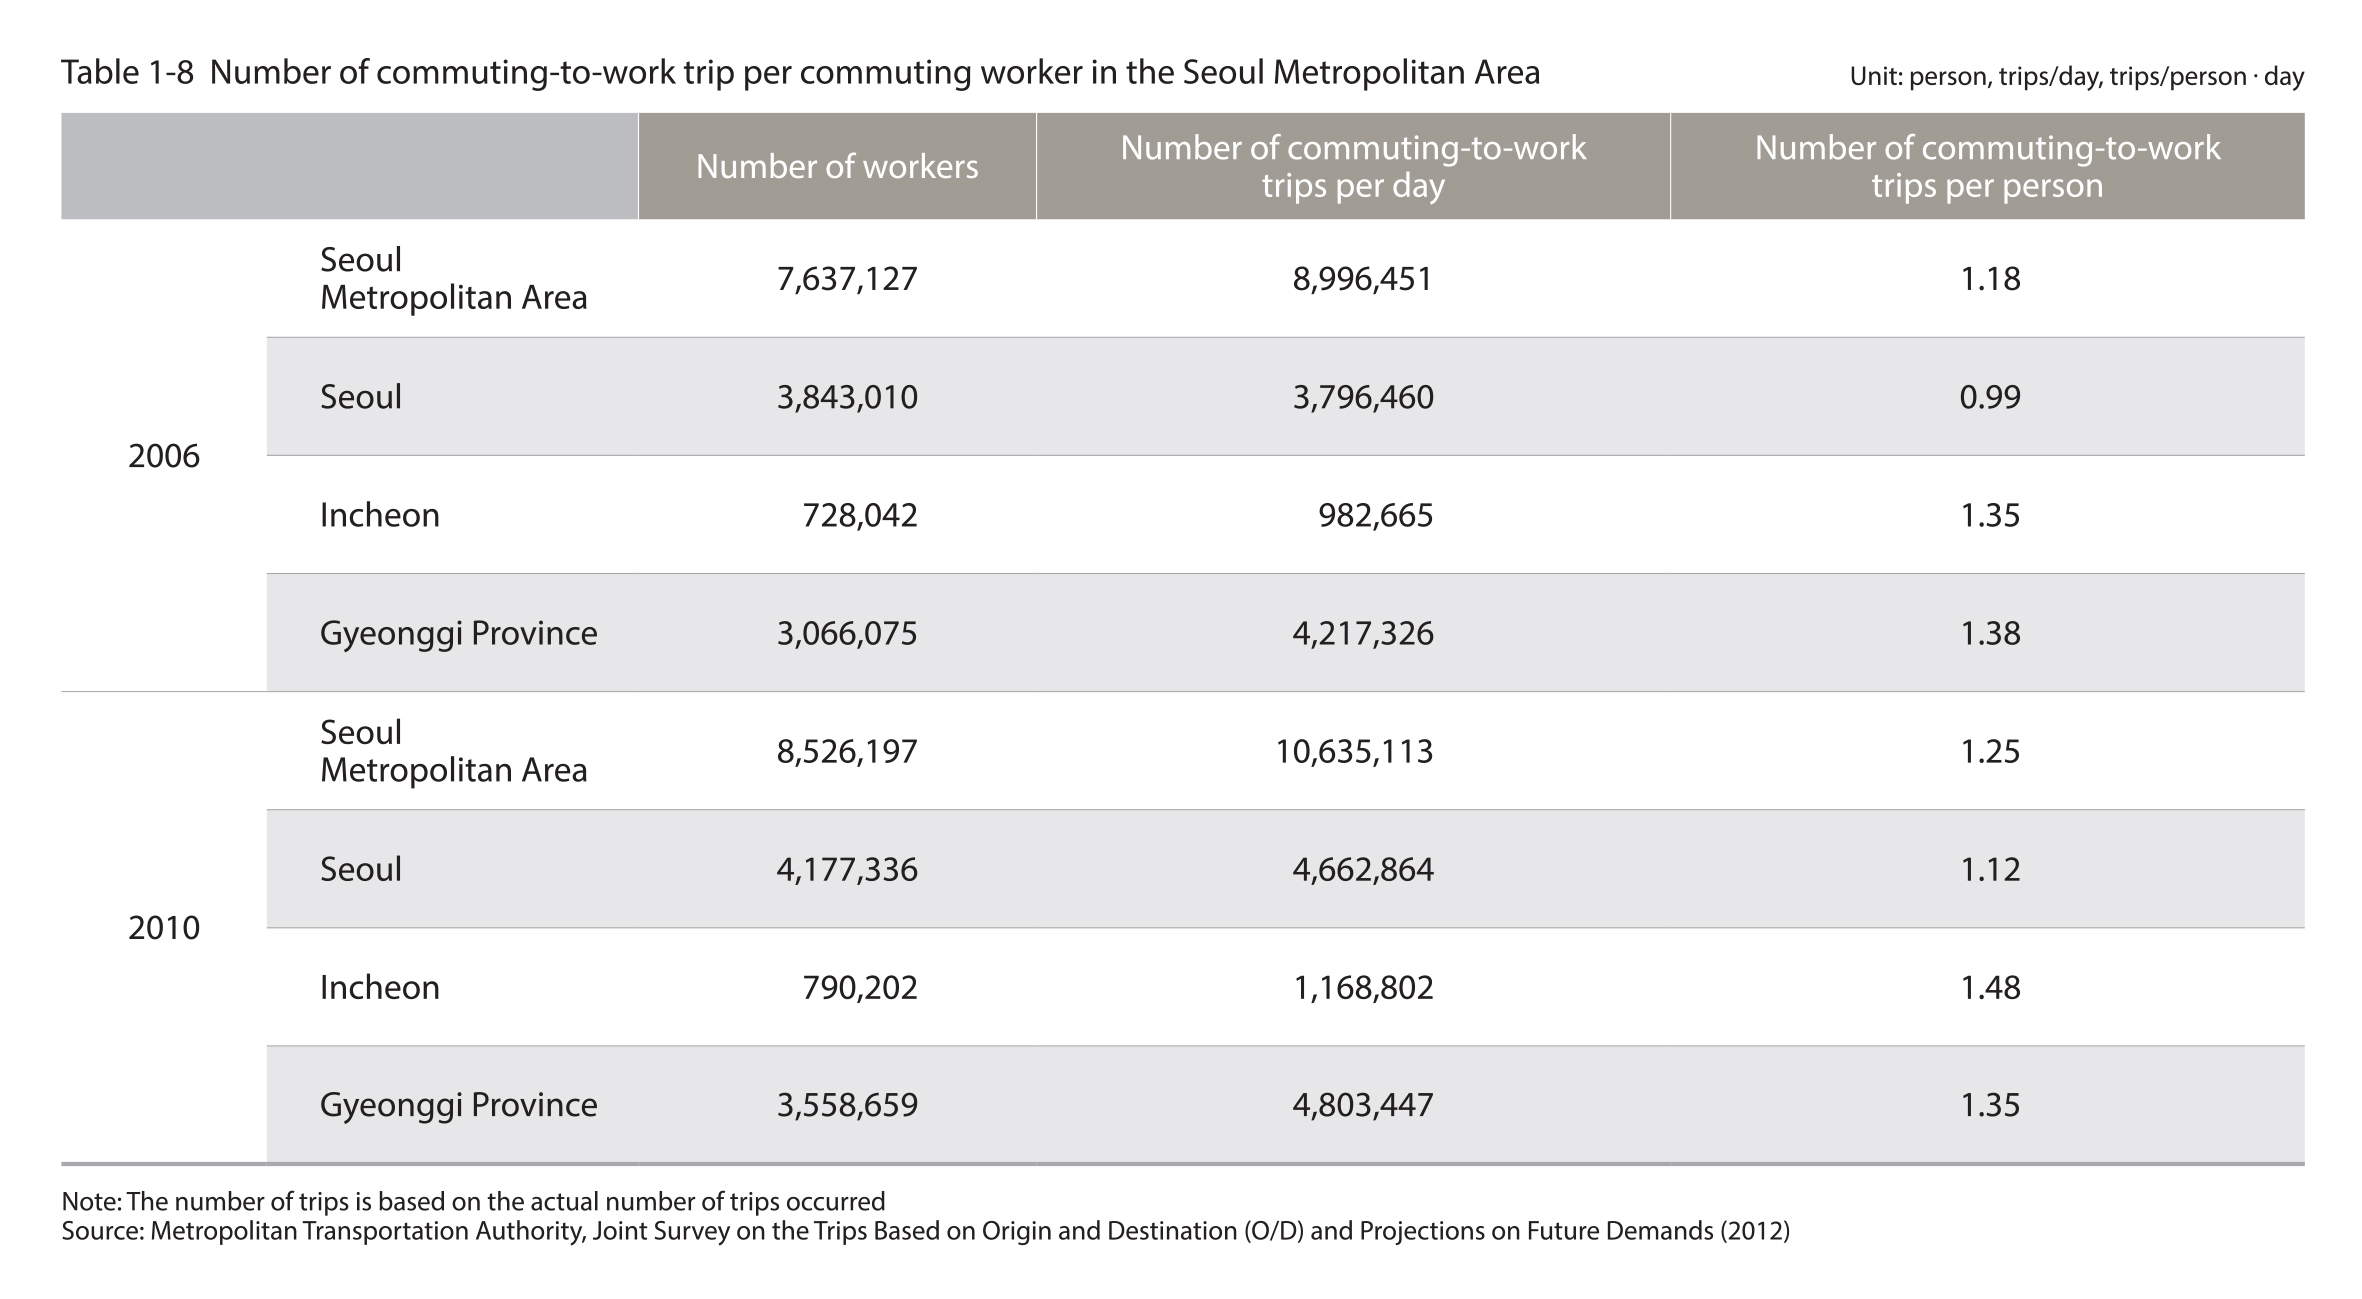
The number of commuting trips per worker increased by 0.17 from 1.18 in 2006 to 1.35 in 2010
In 2010, there were 8,526,000 workers in the Seoul Metropolitan Area and 10,640,000 commuting trips were made. Based on these figures, the number of commuting trips made per commuting worker was 1.25. To be more specific, the number of commuting trips made per commuting worker was 1.12 in Seoul, 1.48 in 1ncheon and 1.35 in Gyeonggi Province.
There was an increase of 0.13 trips/person in Seoul and Incheon and 0.03 trips/person in Gyeonggi Province compared to 2006.
Source : Metropolitan Transportatlon Authority, Joint Survey on the Trips Based on Orijin and Destination (O/D) and projections on Future Demands (2012)
2. Mode of Transportation
2.1. Trips made in Seoul
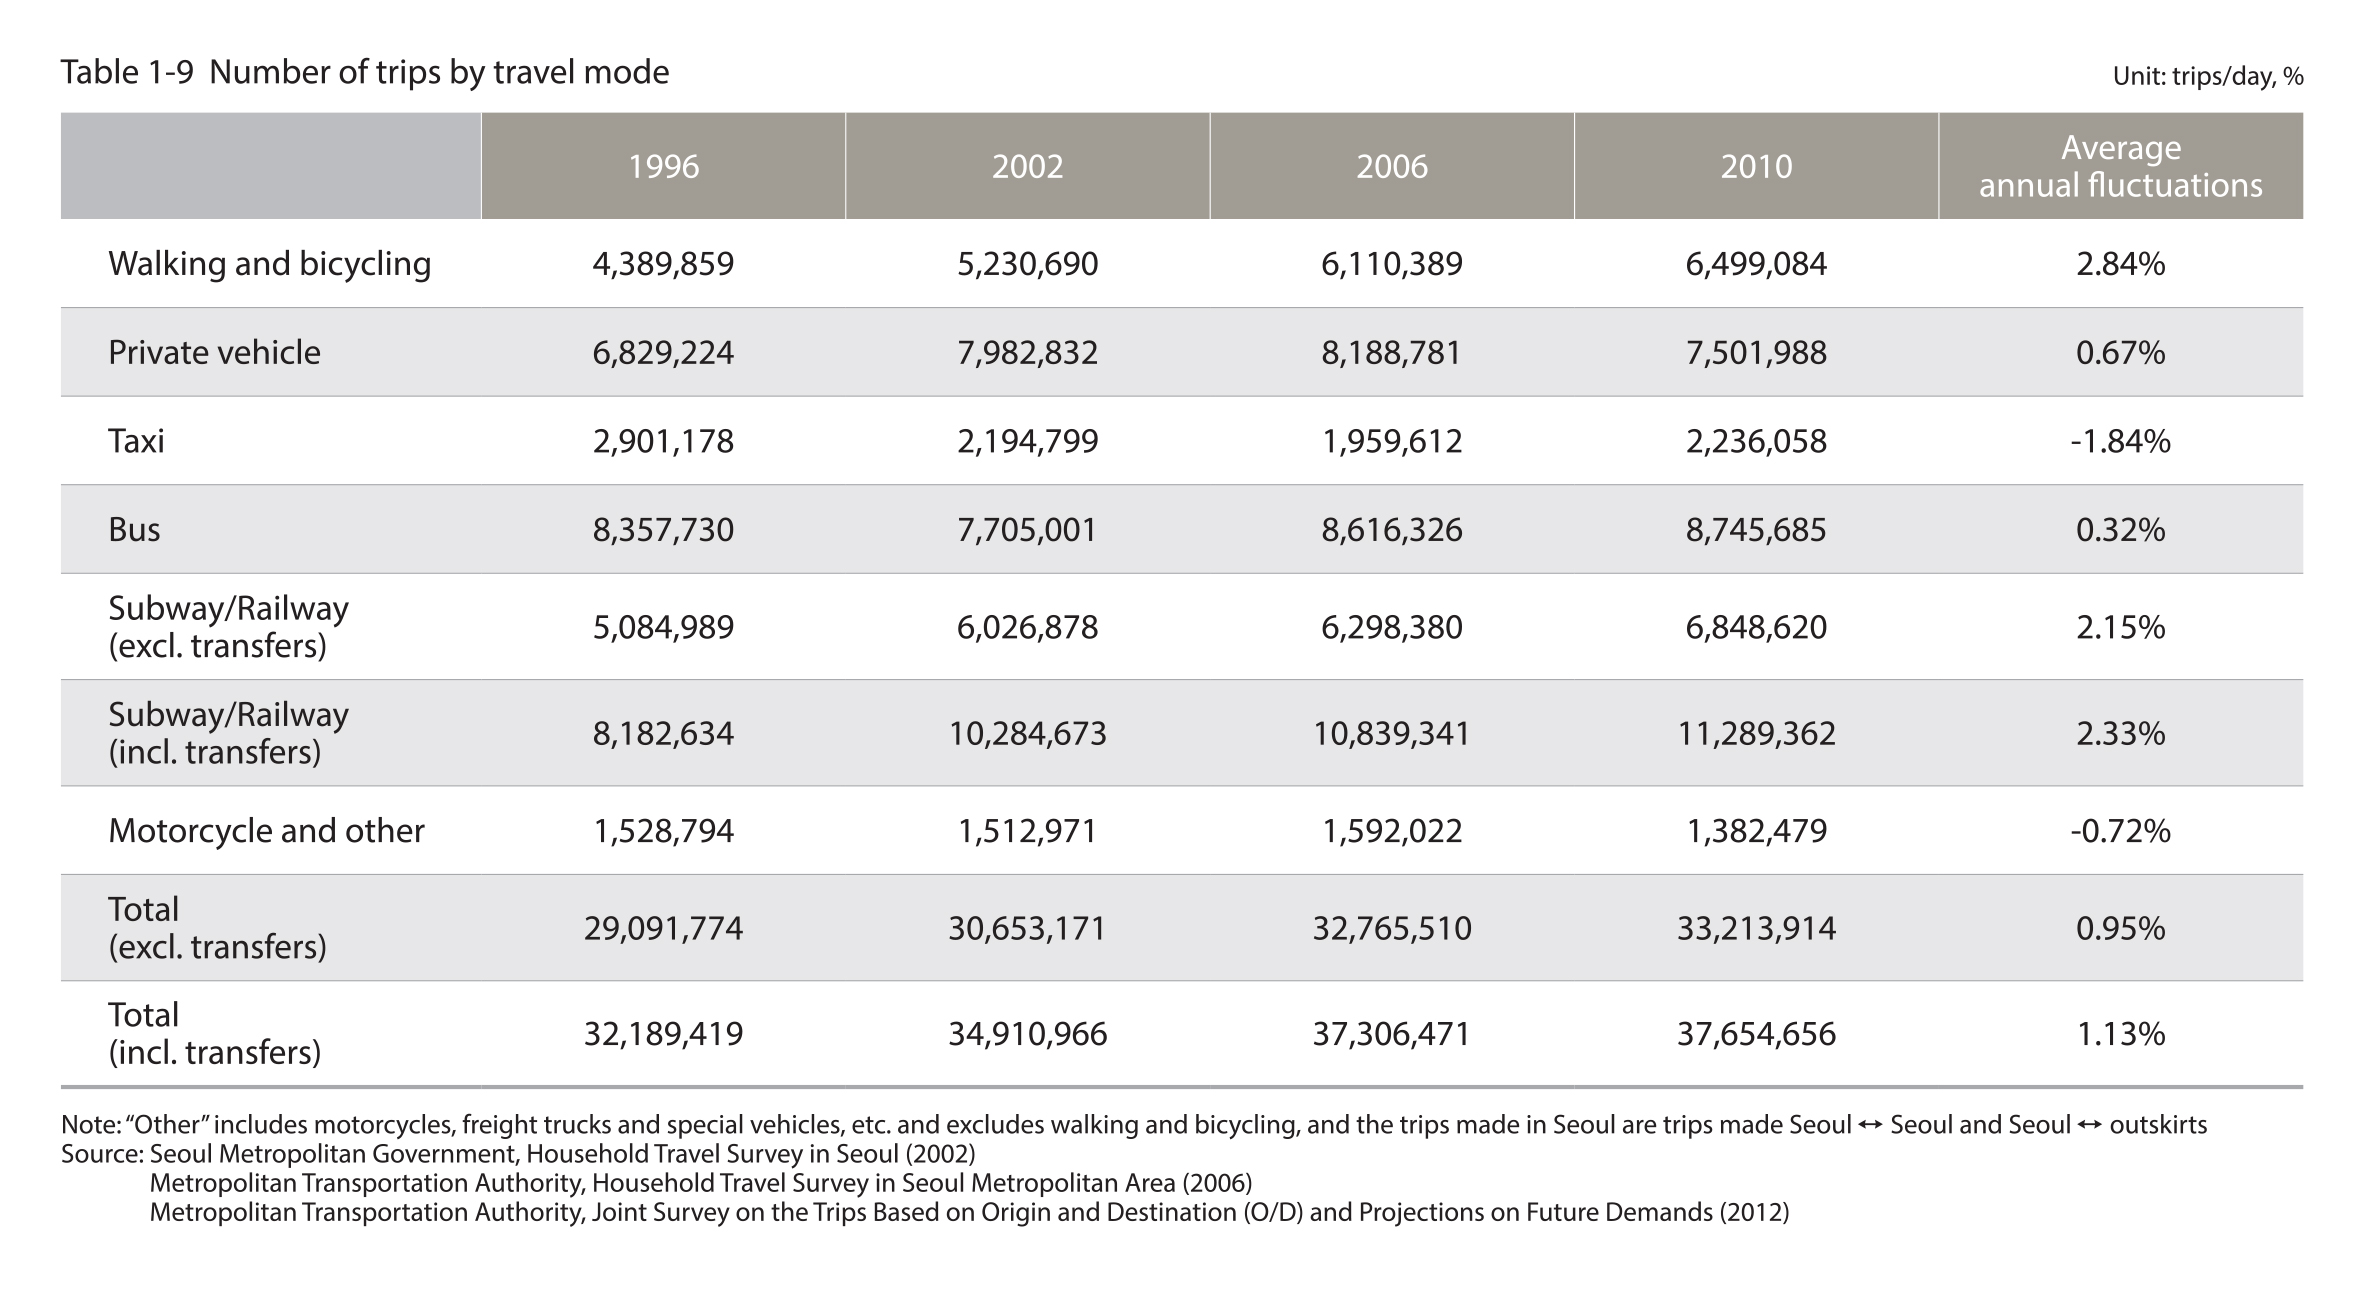
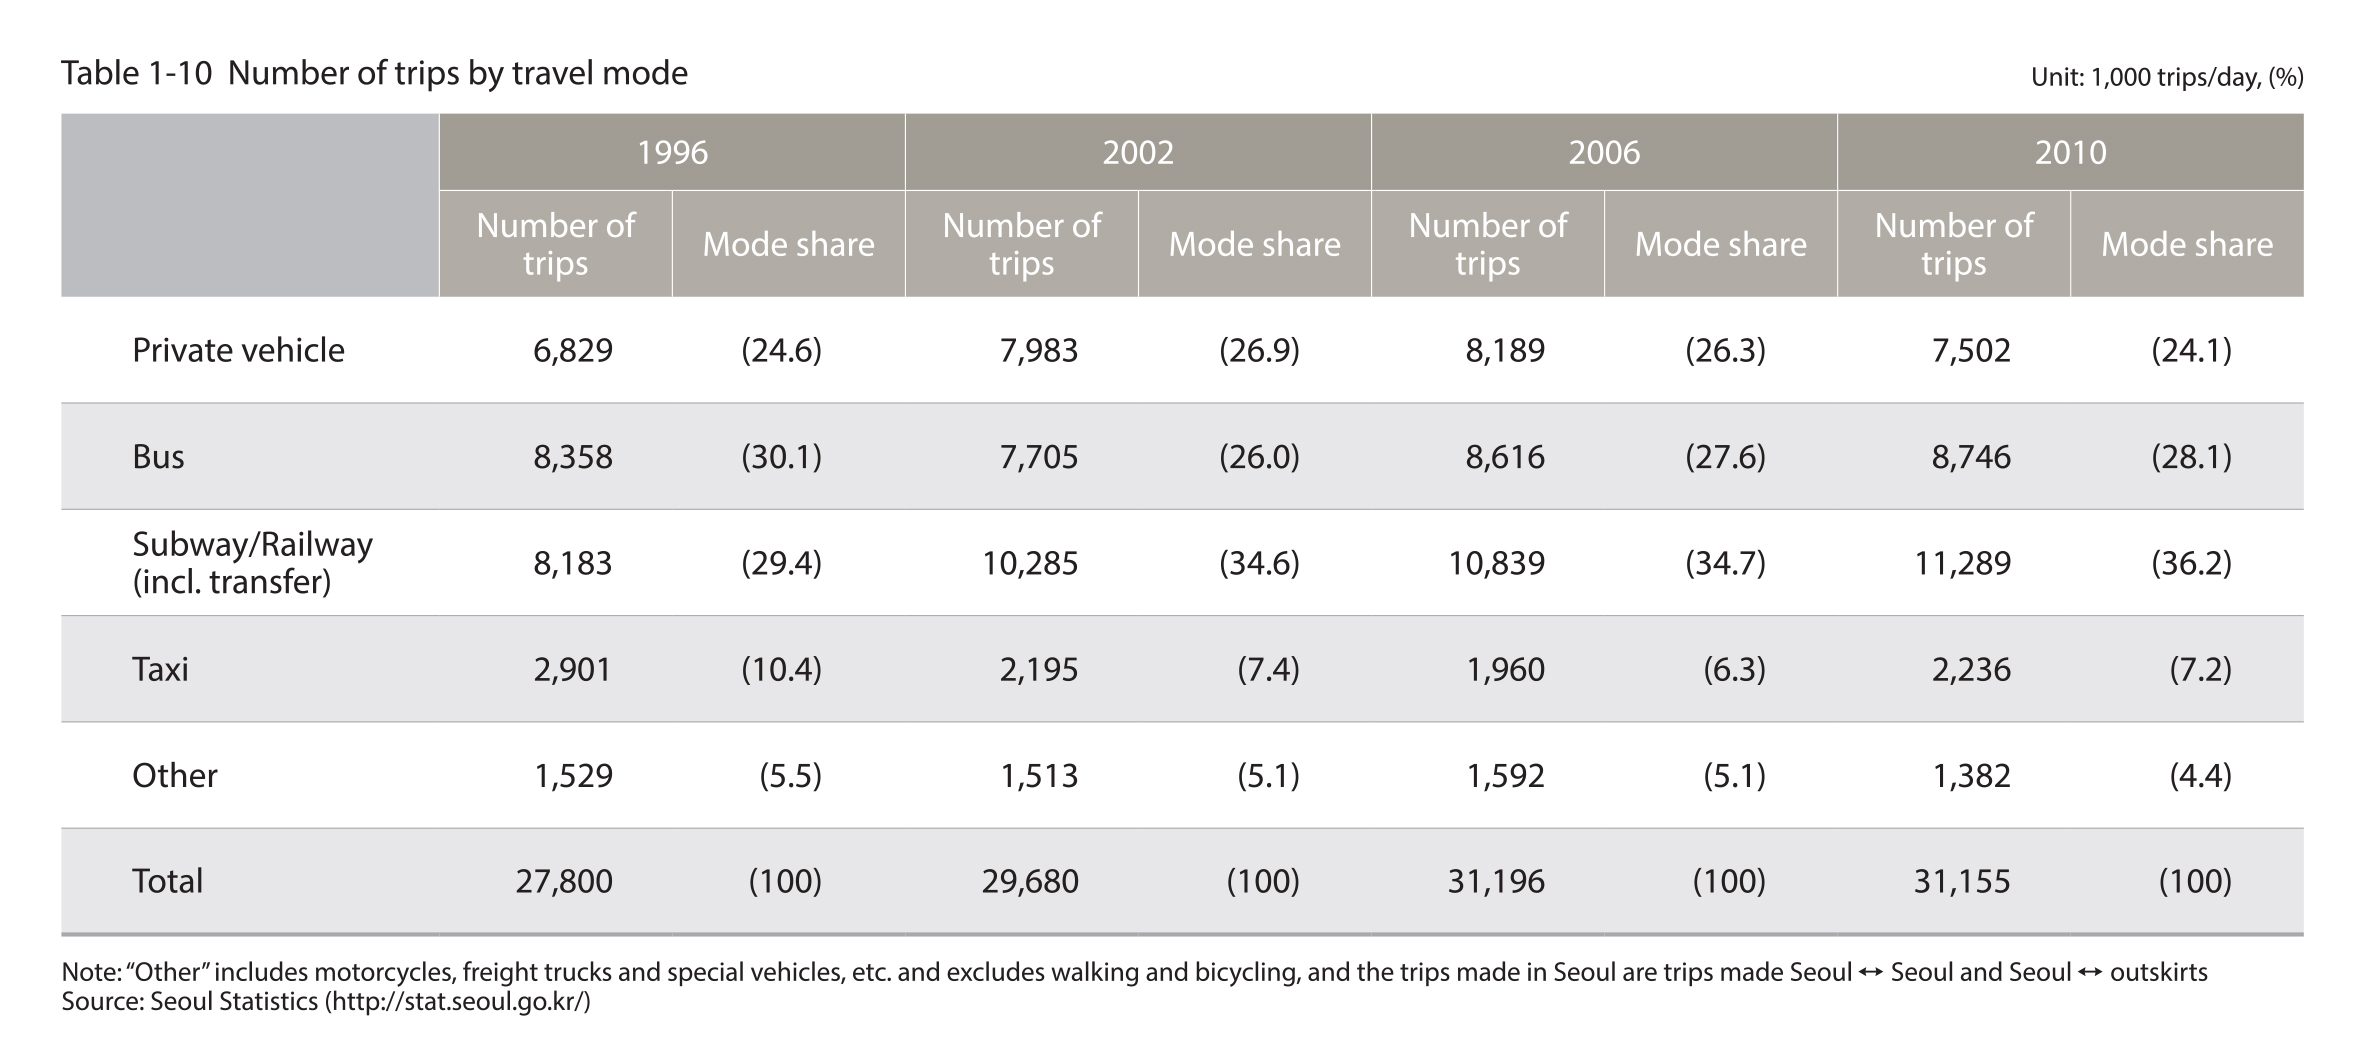
Total number of daily trips by all travel modes in Seoul in 2010 was 37,655,000 and the biggest increase (average annual increase of 2.84%) was observed in walking and bicycling trips
The total number of daily trips by all travel modes (incl. transfers) in Seoul in 2010 was 37,655,000, which was approximately a 17% (5.465,000 trips) increase from 1996. The most frequent trips were made on the subway (incl. transfers) at 11,289,000 trips/day, followed by bus trips (8,746,000 trips/day), and private vehicle trips (7,502,000 trips/day). Walking and bicycling trips increased at an average annual rate of 2.84% from 1996 to 2010, while the average annual increase was 0.67% for private vehicle trips, 0.32% for bus trips and 2.33% for subway trips (incl. transfers). On the other hand, taxi, motorcycle, and other trips decreased by 1.84% and 0.72%, respectively.
Source : Seoul Metropolitan Government, Household Travel Survey in Seoul (2002)
Metropolitan Transportation Authority, Household Travel Survey in Seoul Metropolitan Area (2006)
Metropolitan Transportation Authority, Joint Survey on the Trips Based on Origin and Destination (O/D) and Projections on Future Demands (2012)
As for the mode shares in Seoul, there is a rise in public transportation share and a drop in private vehicle and taxi shares
As for the mode shares, the public transportation share in Seoul rose 4.8%p from 59.5% in 1996 to 64.3% in 2010, taking into account subway transfers. In the case of the bus share, it decreased slightly by 2.0%p from 30.1% in 1996 to 28.1% in 2010. On the other hand, the subway·railway shares in Seoul increased significantly from 29.4% in 1996 to 36.2% in 2010. In contrast, the private vehicle, taxi and other mode shares have fallen gradually since 1996.
The number of public transportation trips in Seoul in 2010 was 20,035,000, a 21.1%p increase from 1996
A review of the changes in the number of bus trips in Seoul from 1996 to 2010 showed that it had decreased from 8,358,000 in 1996 to 7,705,000 in 2002 before climbing up again after 2006. As for the number of trips via the subway and railway, it steadily increased from 8,183,000 in 1996 to 11,289,000 in 2010.
Source : Seoul Statistics (http://stat.seoul.go.kr/)
2.2. Trips made in the Seoul Metropolitan Area
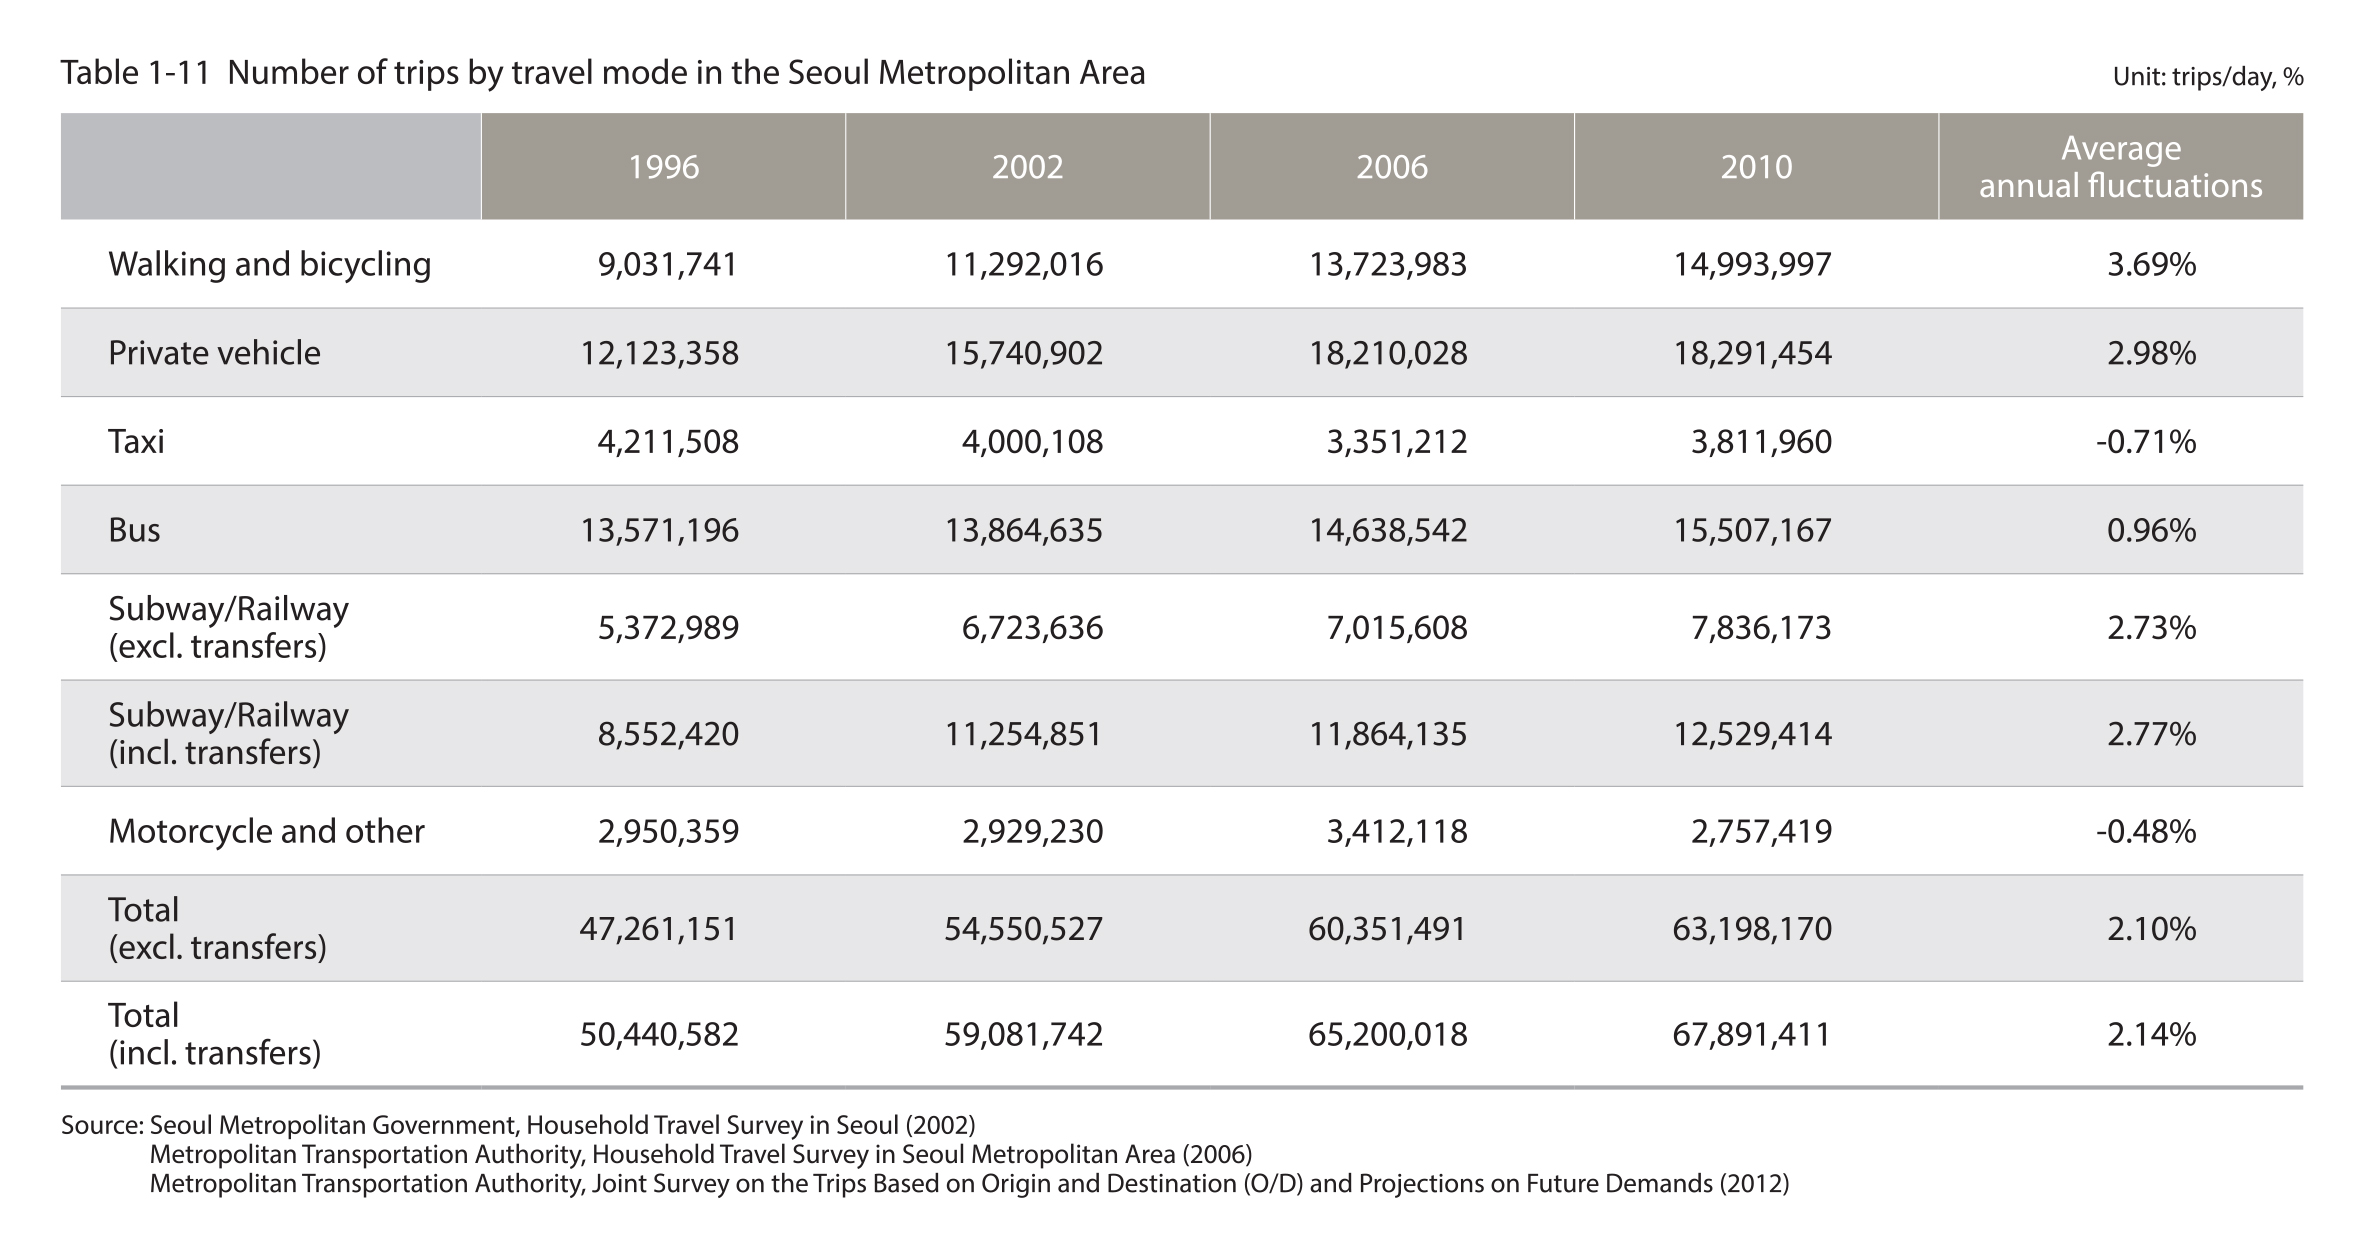
Total number of daily trips by all travel modes in the Seoul Metropolitan Area in 2010 was 67,891,000 and the biggest increase (average annual increase of 3.69%) was observed in walking and bicycling trips
The total number of daily trips by all travel modes in Seoul Metropolitan Area in 2010 was 67,891,000, which was approximately a 34.6% (17,450,000 trips/day) increase compared to 1996. The most frequent trips were made via private vehicles at 18,291,000 trips/day, followed by bus trips (15,507,000 trips/day), walking and bicycling trips (14,994,000 trips/day) and subway trips (12,529,000 trips/day). Walking and bicycling trips increased at an average annual rate of 3.69% from 1996 to 2010, while the average annual increase was 2.98% for private vehicle trips, 0.96% for bus trips and 2.77% for subway trips (incl. transfers). On the other hand, taxi, motorcycle, and other trips decreased by 0.71% and 0.48%, respectively.
Source : Source : Seoul Metropolitan Government, Household Travel Survey in Seoul (2002)
Metropolitan Transportation Authority, Household Travel Survey in Seoul Metropolitan Area (2006)
Metropolitan Transportation Authority, Joint Survey on the Trips Based on Origin and Destination (O/D) and Projections on Future Demands (2012)
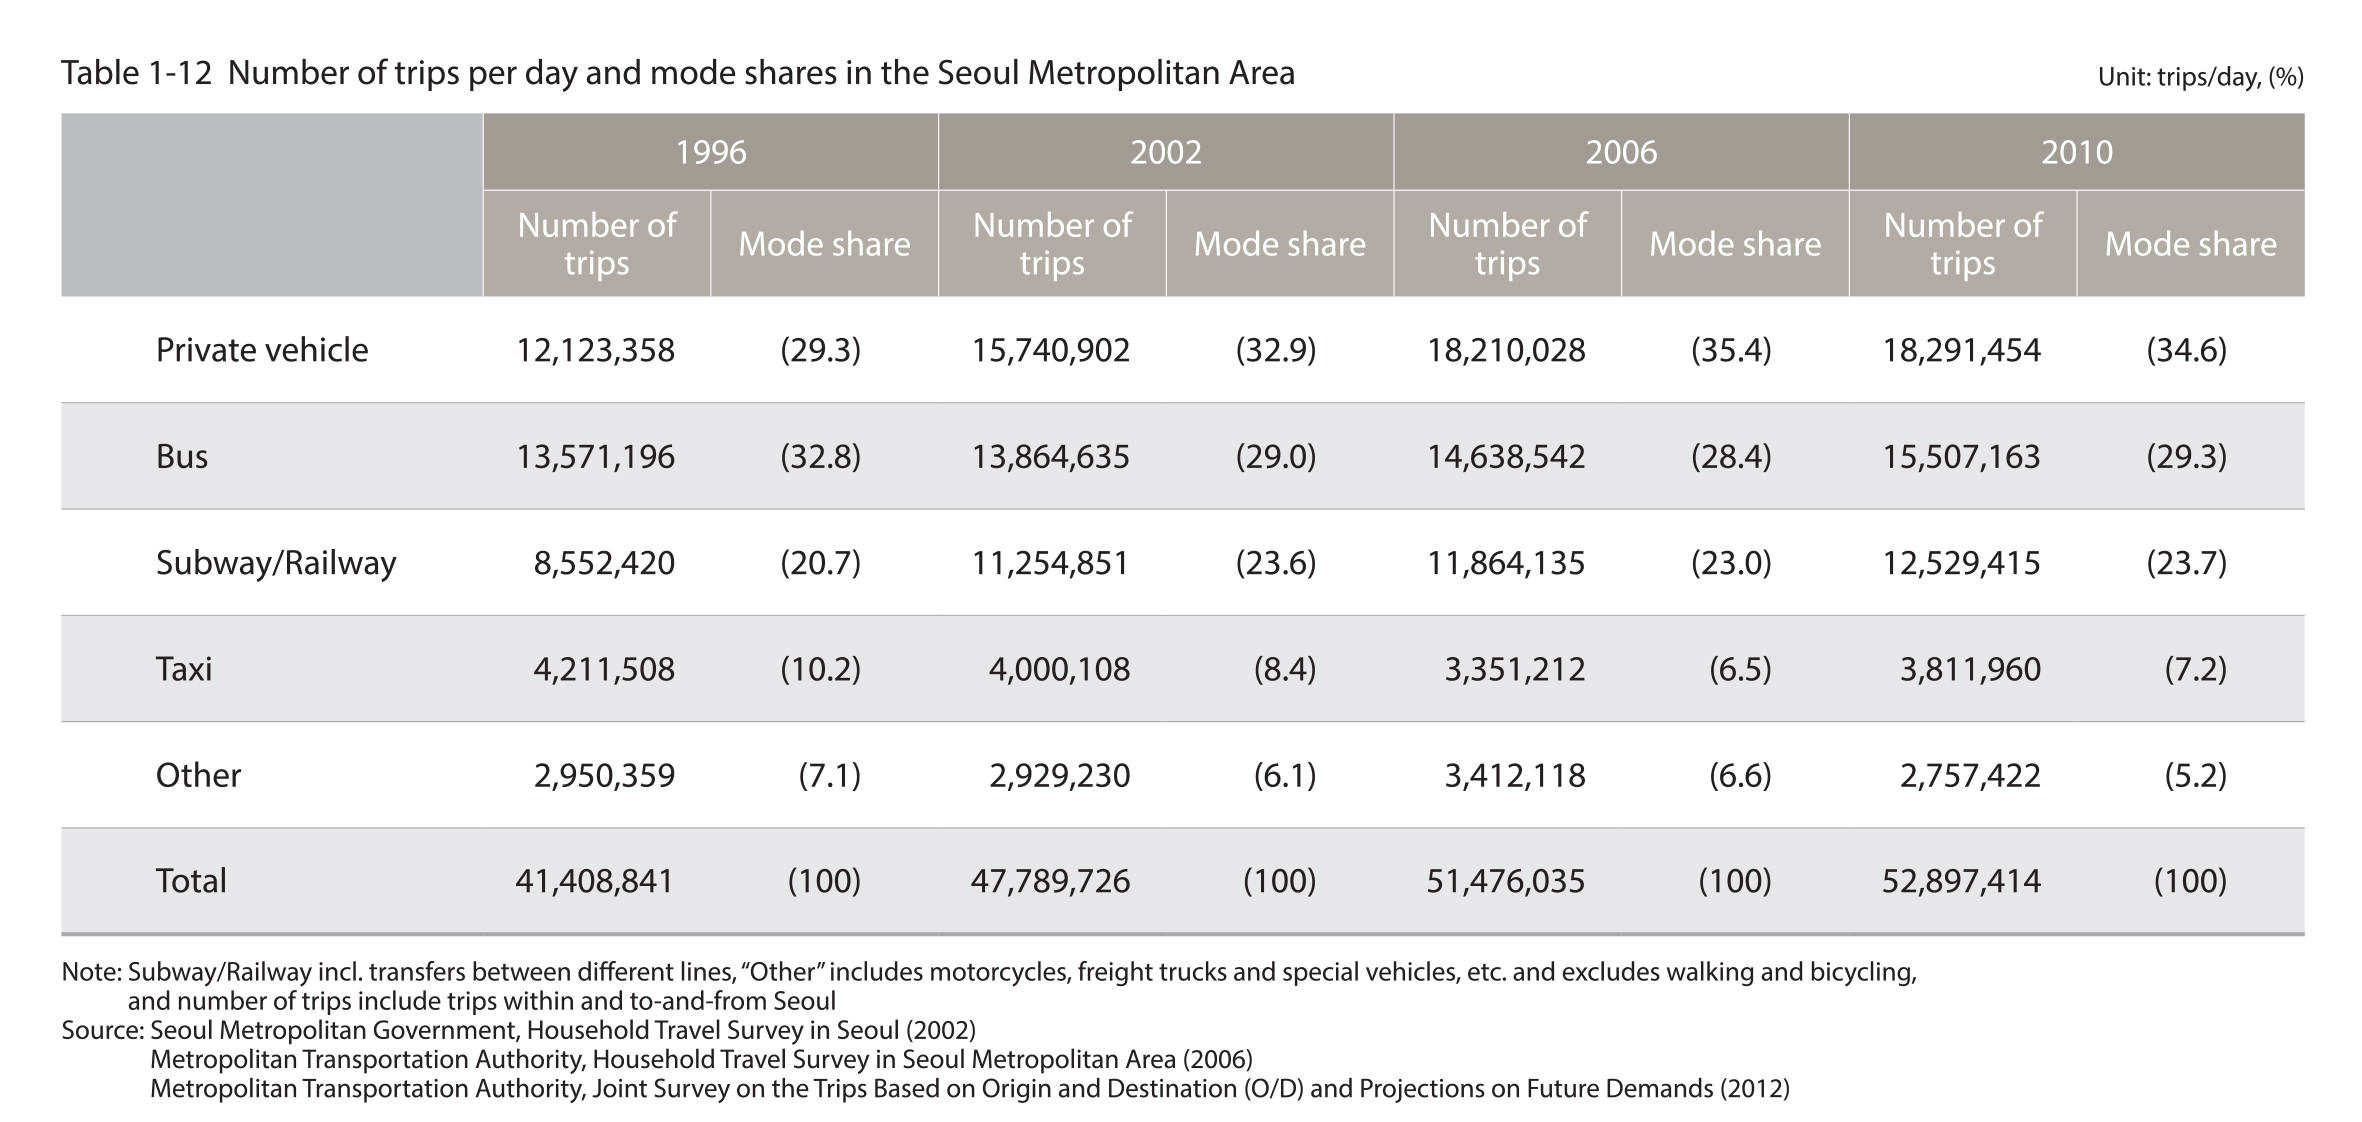
The public transportation share in 2010 was 53.0%, a 0.5%p decrease from 1996
As for the mode shares, the public transportation share in the Seoul Metropolitan Area dropped 0.5%p from 53.5% in 1996 to 53.0% in 2010, considering subway transfers. In the case of the bus share, it decreased by 3.5%p from 32.8% in 1996 to 29.3% in 2010, while the subway + railway shares increased slightly (3.0%p) from 20.7% in 1996 to 23.7% in 2010, and the number of private vehicle trips increased steadily from 29.3% in 1996 to 34.6% in 2010, and this mode of transportation accounted for the largest mode share in the Seoul Metropolitan Area.
The number of public transportation trips in 2010 was 28,037,000, a 26.7% increase from 1996
A review of the changes in the number of bus trips in the Seoul Metropolitan Area from 1996 to 2010 showed that it had increased by 1,936,000 from 13,571,000 in 1996 to 15,507,000 in 2010. As for the number of trips via the subway and railway, it increased by 3,977,000 from 8,552,000 in 1996 to 12,529,000 in 2010.
Source : Source : Seoul Metropolitan Government, Household Travel Survey in Seoul (2002)
Metropolitan Transportation Authority, Household Travel Survey in Seoul Metropolitan Area (2006)
Metropolitan Transportation Authority, Joint Survey on the Trips Based on Origin and Destination (O/D) and Projections on Future Demands (2012)