- 환경
상수도
-
상수도
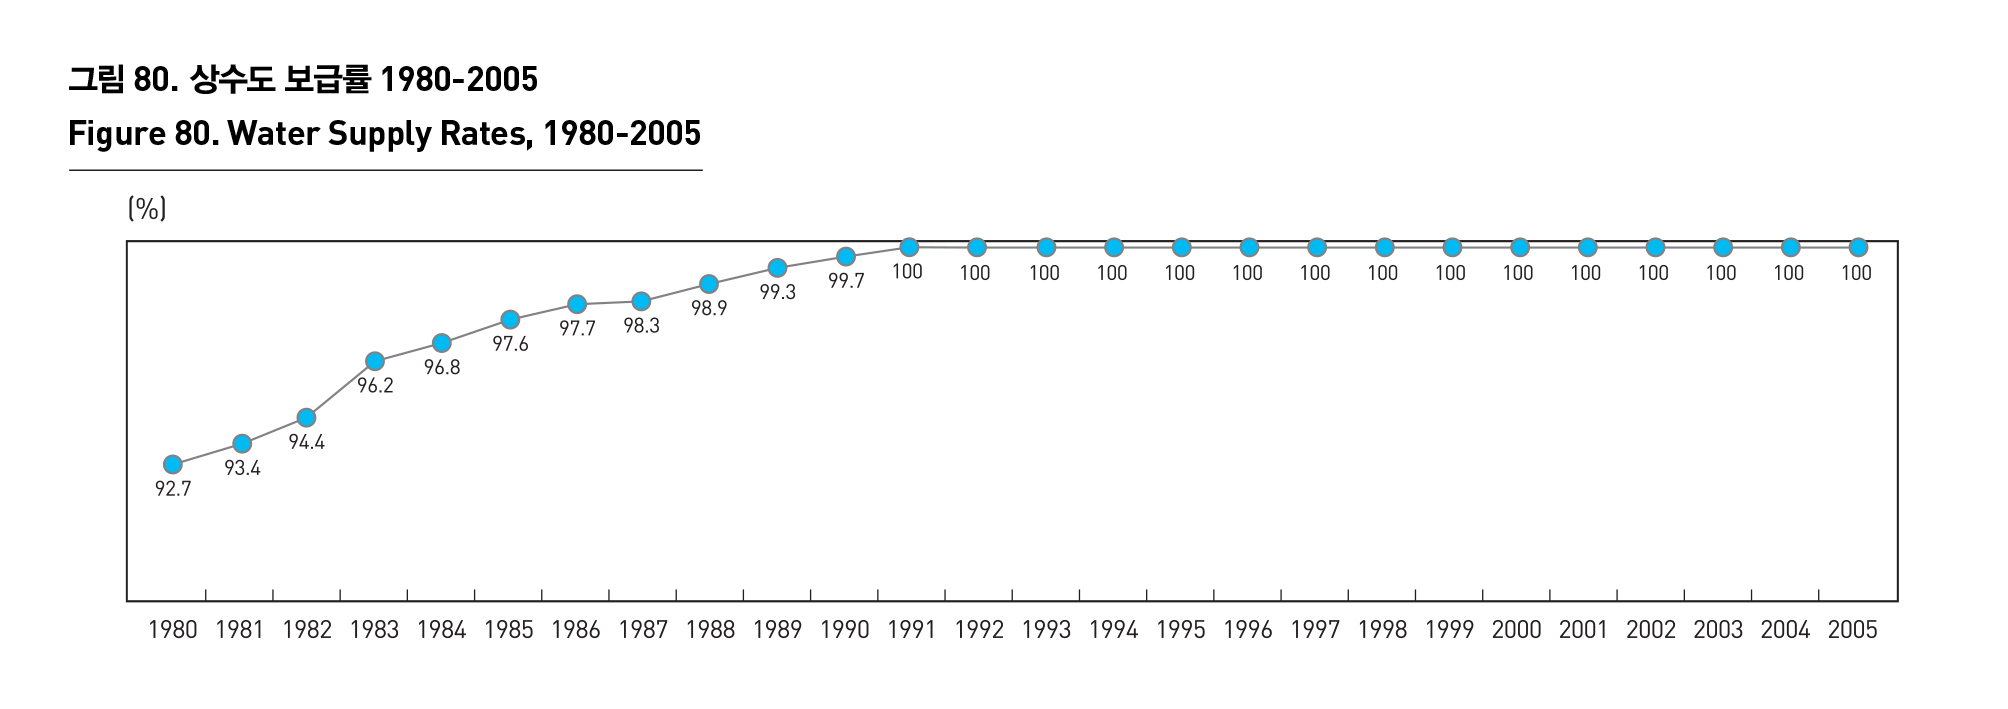
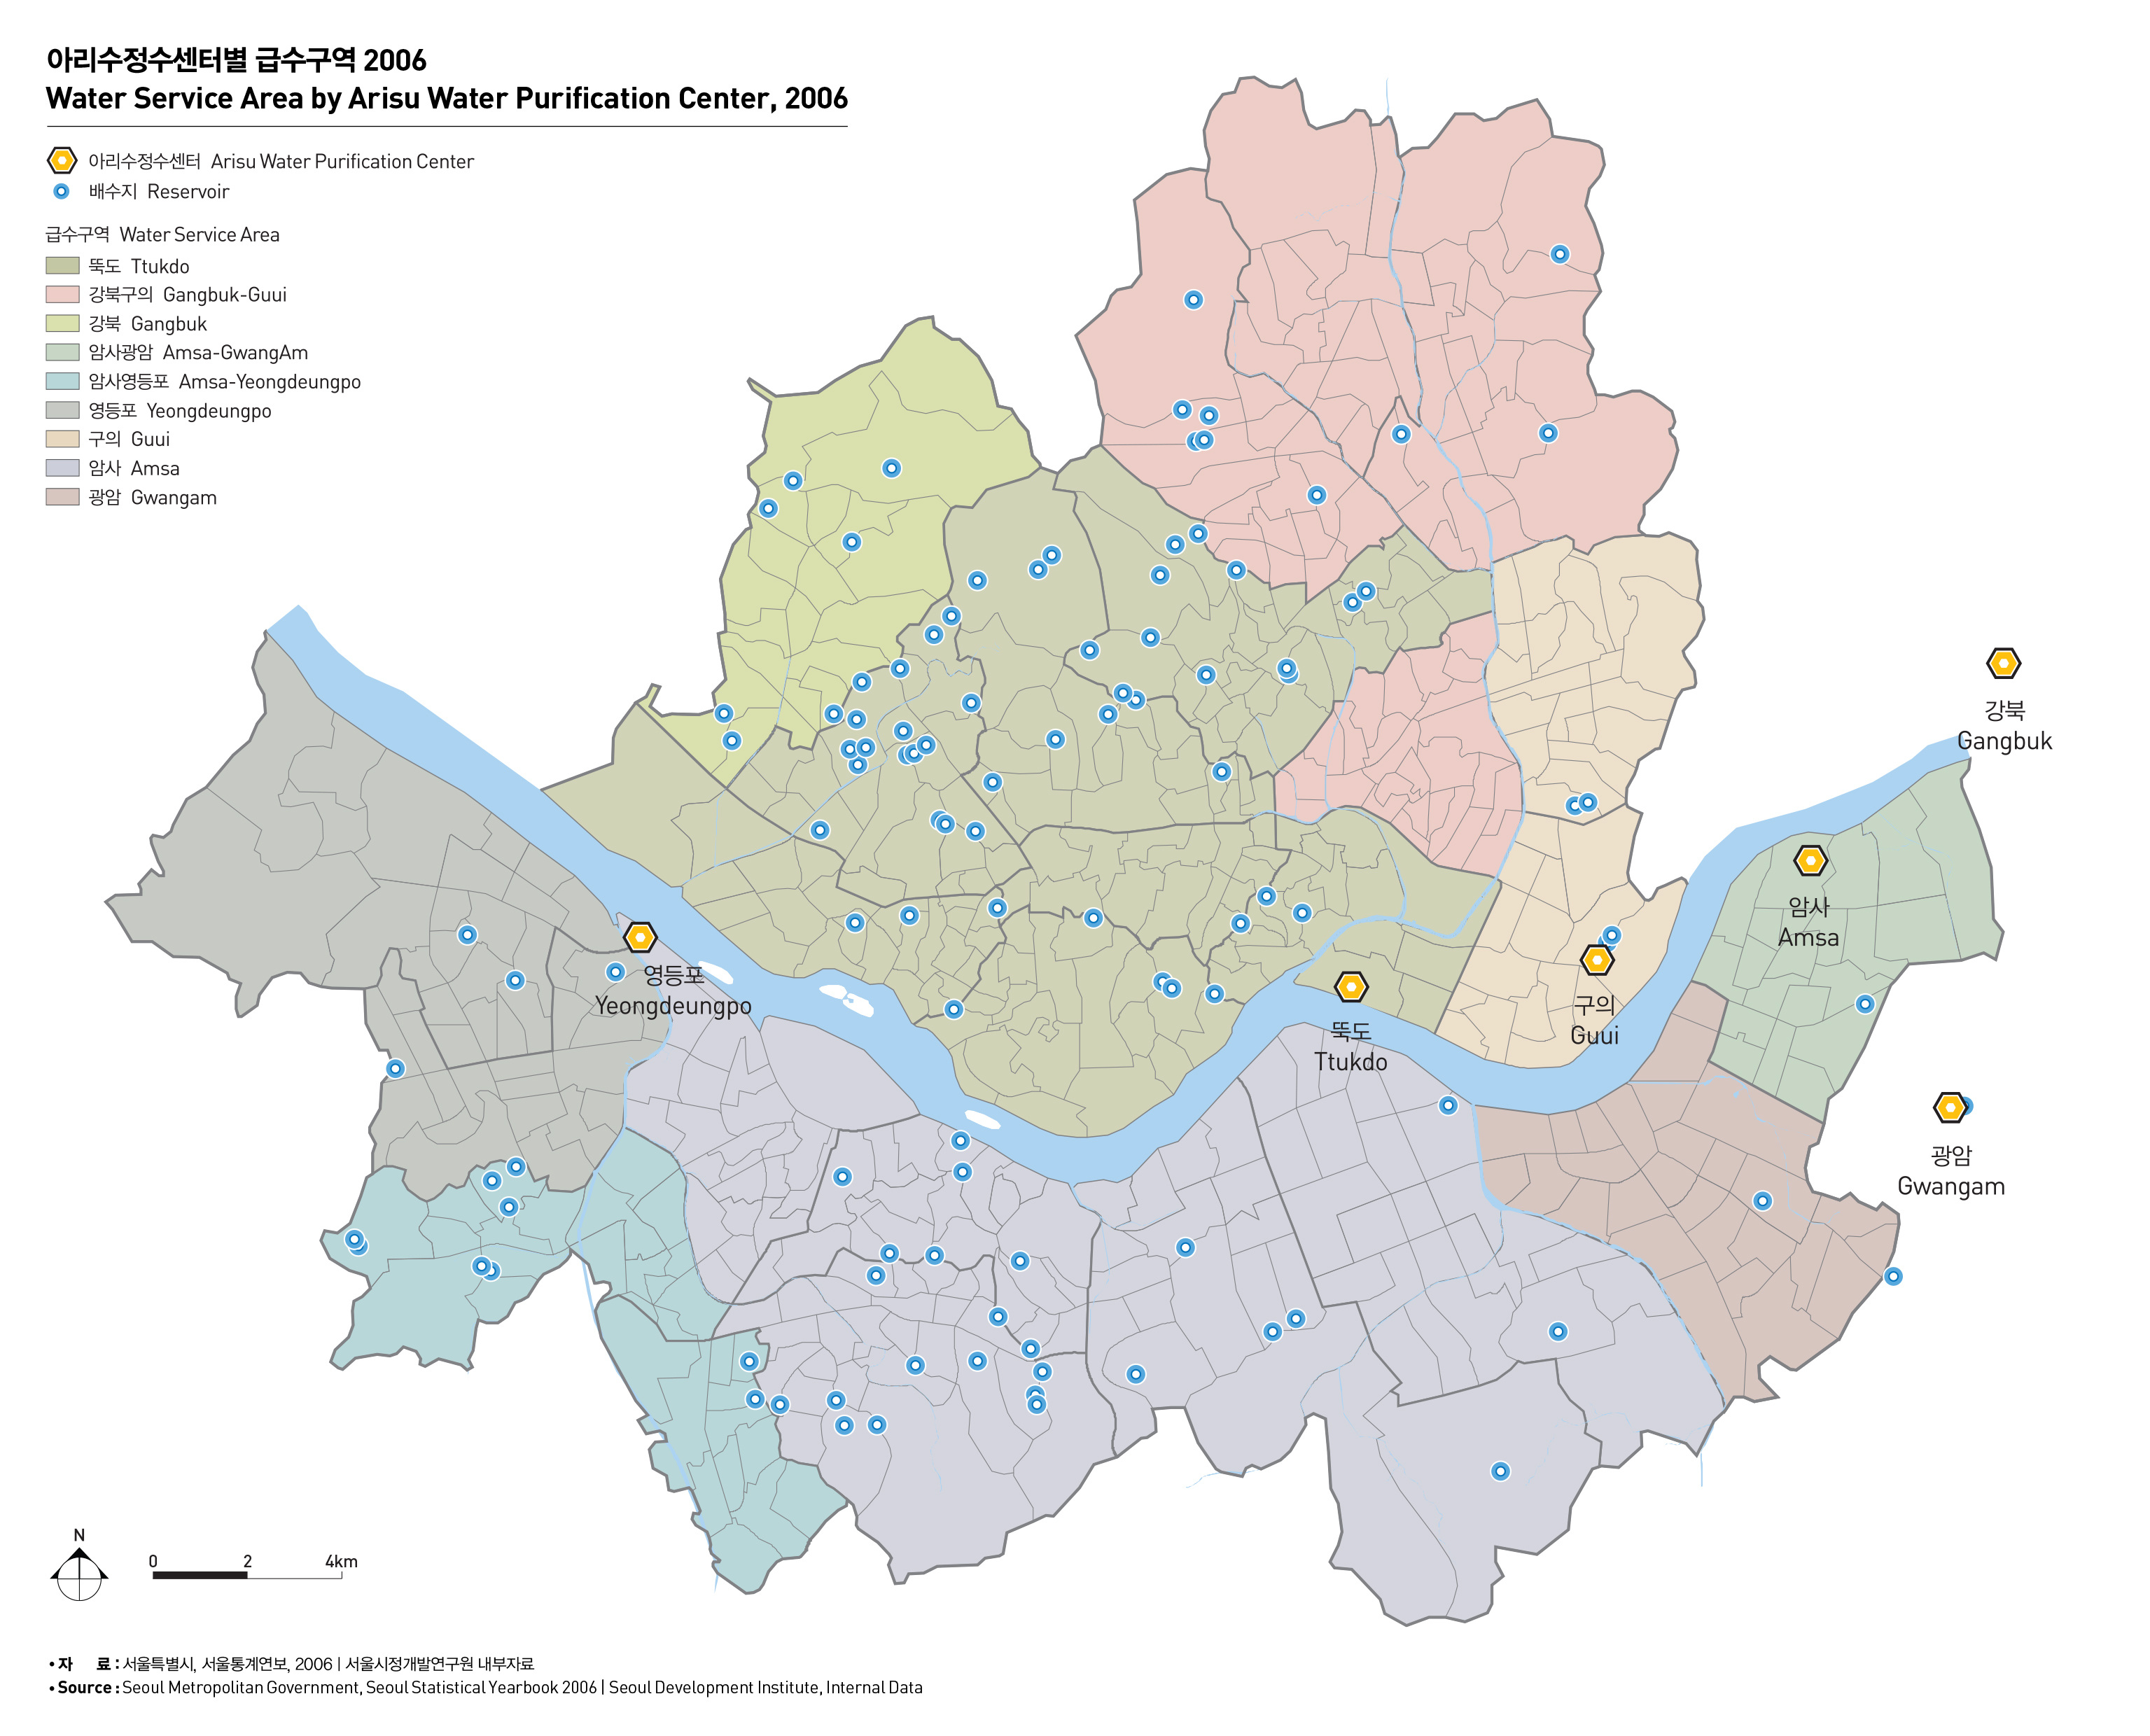
상수도 보급현황은 상수도보급률과 급수량으로 측정될 수 있다. 상수도 보급률은 1980년대 93% 내외에서 1990년대 이후에는 100%의 보급률을 보이고 있다. 1인당 상수도 급수량도 1980년대 이래 급격히 증가하여 90년대 후반 약 450ℓ/일을 보였으나 2000년대 들어서면서 물절약과 재이용으로 물소비량이 줄어들어 350ℓ/일 이하로 감소되었다. 정수센터는 깨끗하고 안전한 수돗물 “아리수”를 생산·공급하는 시설로서 서울에는 6개의 정수센터에서 물이 처리되고 있으며 정수센터에서 처리된 물은 자연유하식으로 9개의 급수구역에 공급되고 있다. 시민들에게 수돗물을 공급하는 방식은 정수센터에서 직접 물을 공급하거나 물을 배수지에 저장한 후 급수하고 있으나 향후 수돗물 전량을 배수지 급수체계로 전환하려고 하고 있으며 현재 110개의 수지가 있다.
WATERWORKS
The level of waterworks distribution can be measured by its distribution rate and the amount of water supplied. The waterworks distribution rate stood at about 93% in 1980s, and reached 100% since 1990s. There was a dramatic rise in the amount of waterworks supplied per head since 1980s, reaching about 450ℓ/day in the late 1990s. The public efforts to save and reuse water led to a drop in water consumption, reducing it to below 350ℓ/day in 2000.
The water purification center produces and supplies “Arisu” (clean and safe tap water), and water is treated in 6 water purification centers in Seoul. Then the treated water is supplied to 9 service areas by a gravity flow system. Tap water is directly supplied to citizens in Seoul by the water purification center or supplied to citizens by a water reservoir. Seoul has 110 water reservoirs, and is seeking to change the current water supply system into the latter.
출처 : 서울특별시, 서울통계연보, 2006
서울시정개발연구원 내부자료