- 환경
대기
-
대기
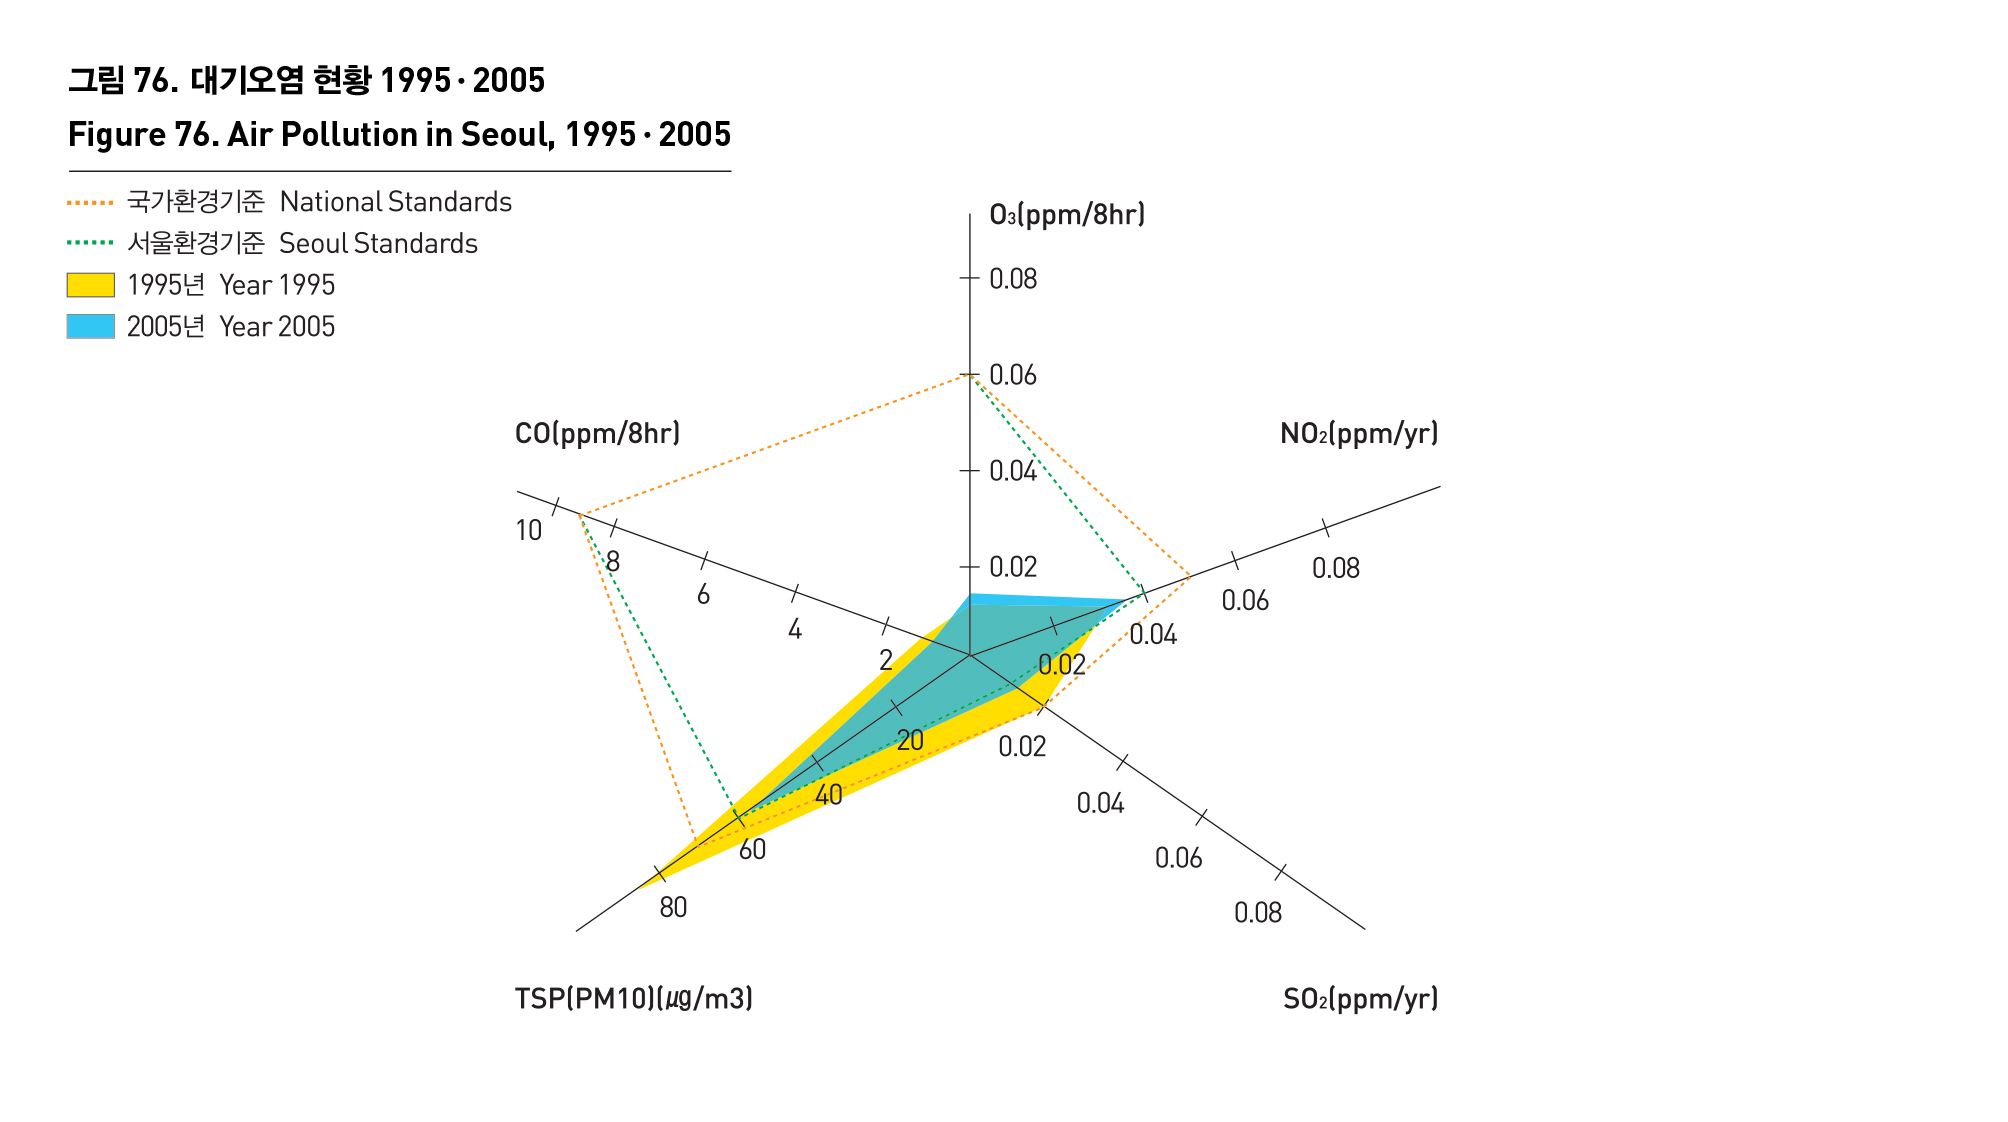
대기오염 상태는 이산화황(SO2), 오존(O3), 이산화질소(NO2), 분진(TSP, PM10), 일산화탄소(CO)의 농도로 나타낸다. 1980년대 이후 지속적으로 강화되어온 연료규제 제도의 정책적 효과로 SO2, CO, TSP와 같은 1차 대기오염물질의 농도는 상당한 개선을 보였으나, 보다 복잡한 생성과정에 의해 발생되는 2차 오염물질인 PM10, 오존의 오염도와 자동차 대수의 증가가 원인으로 추정되는 NO2 오염 자동차와 같은 직접적인 인위적 배출원의 꾸준한 증가 및 도시화로 인한 도시열섬효과와 같은 국지적인 변화 뿐만 아니라 지구온난화, 동북아 지역의 급격한 산업화로 인한 사막화 등 지구적 차원의 환경변화도 저공해자동차보급 확대와 같은 서울시의 대기오염도 개선을 위한 다양한 노력에 대한 효과를 상쇄하는 것으로 보인다.
AIR QUALITY
Air quality is measured by the concentration of sulfur oxide(SO2), ozone(O3), nitrogen oxide(NO2), dust(TSP or PM10), and carbon monoxide(CO) in the air. Thanks to the fuel regulation system that has been strengthened since 1980s, the primary air pollutants such as SO2, CO and TSP have significantly decreased. However, the system did little to reduce the secondary air pollutants, PM10, O2, and NO2 assumed to be caused by a growing number of vehicles.
Seoul Metropolitan Government has made every effort to improve air quality, such as expanding distribution of low emission vehicles. But its effects appear to be offset by local environmental changes, for example, increased anthropogenic emission sources such as vehicles and heat island effects resulting from urbanization, as well as global environmental changes, such as global warming and desertification of northeast Asia caused by rapid industrialization.


출처 : 서울특별시, 서울통계연보, 2006
서울특별시, 서울시 기후지도제작(1차년도), 2007