- 인구
총부양비
-
총부양비
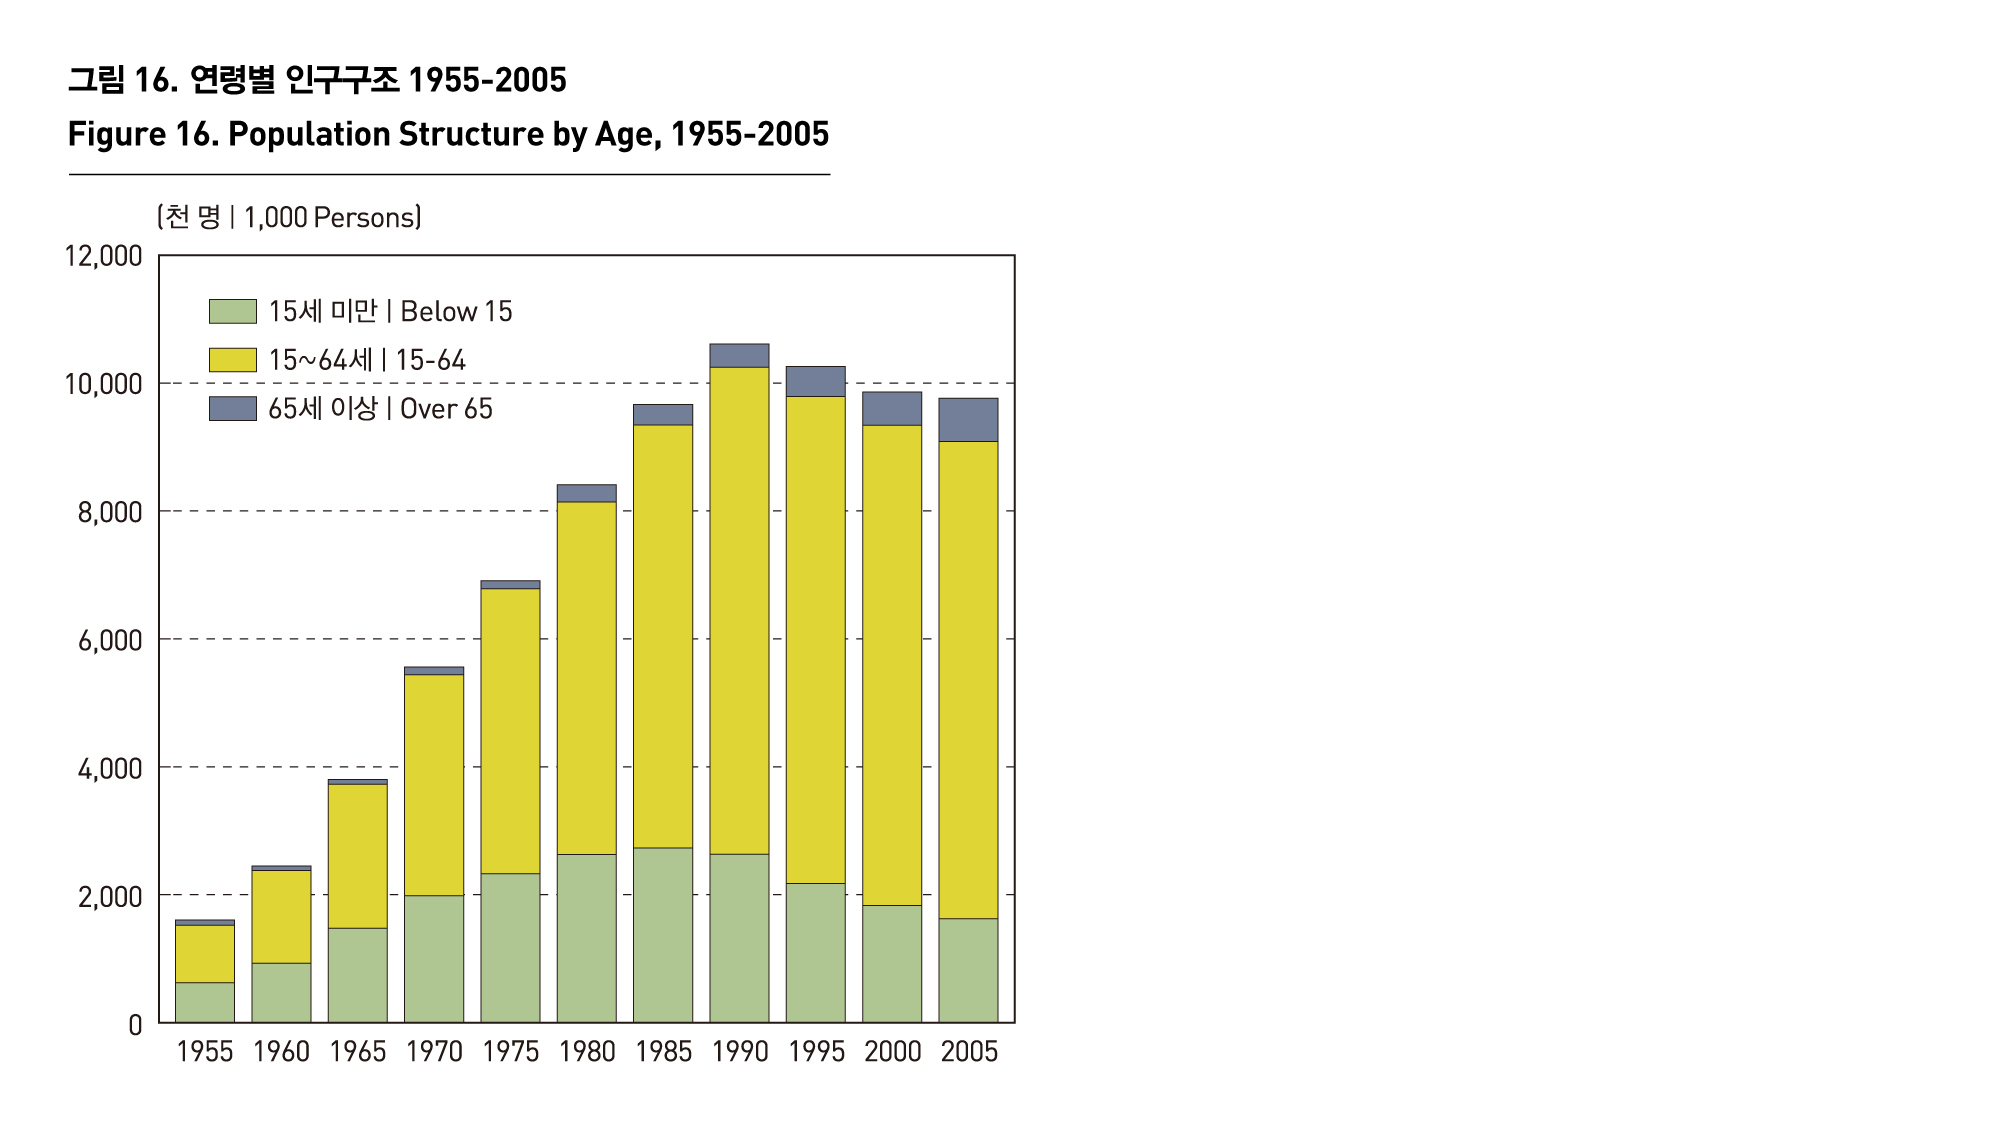
부양인구구성은 경제적으로 부양연령층의 인구와 피부양연령층 인구의 구성을 의미하며, 총부양비란 경제활동 인구(15세~64세)를 15세미만 인구로 나눈 소년부양인구비와 경제활동인구를 65세 이상 노년인구로 나눈 노년부양인구비의 합으로 한 사회의 사회경제구조를 개괄적으로 파악할 수 있는 지표이다.
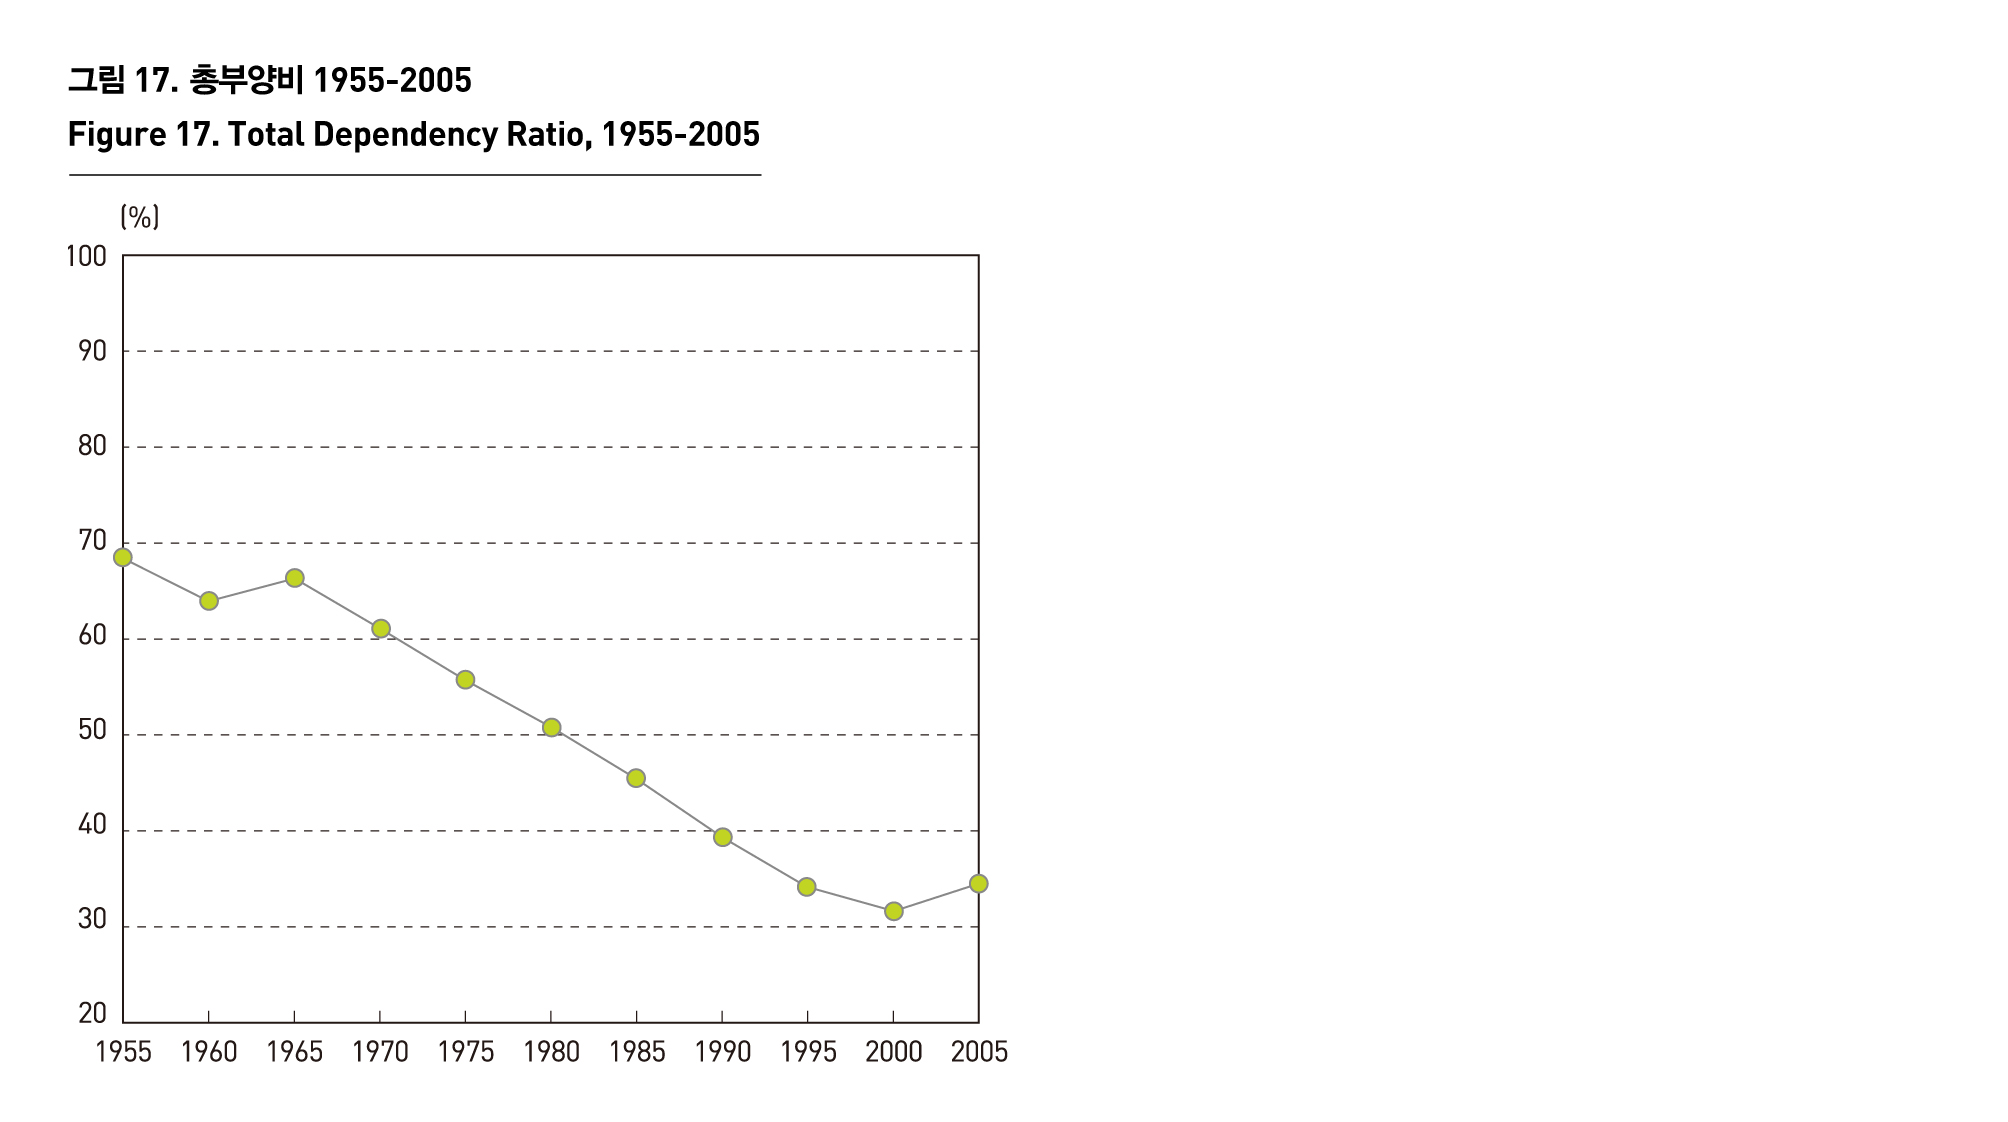
서울의 총부양비는 1960년대 이후 경제활동인구 증가율이 15세미만 인구증가율과 노년인구증가율을 훨씬 상회하여 1960년의 67.6%에서 2000년 31.6%로 지속적으로 감소하였다. 그러나 2005년의 총부양비는 5년전 대비 증가한 것으로 나타났는데, 이는 소년피부양인구의 감소에도 불구하고 노년인구의 증가에 기인한 것이다.
TOTAL DEPENDENCY RATIO
Dependent population composition includes the economically active age group and dependent age group. If you divide the economically active population(population aged from 15 to 64) by population aged below 15, you can get the child dependency ratio. If you divide the economically active population by the elderly population aged 65 or over, you can get the elderly dependency ratio. As an indicator of socioeconomic structure, the total dependency ratio is made up of the child dependency ratio and the elderly dependency ratio.
As the growth rate of economically active population has exceeded that of population aged 15 or below and the elderly since 1960, Seoul’s total dependency ratio continued to drop from 67.6% in 1960 to 31.6% in 2000. However, the total dependency ratio in 2005 increased, compared with 5 years earlier, which can be blamed on increasing elderly population despite a decrease in the child dependency ratio.
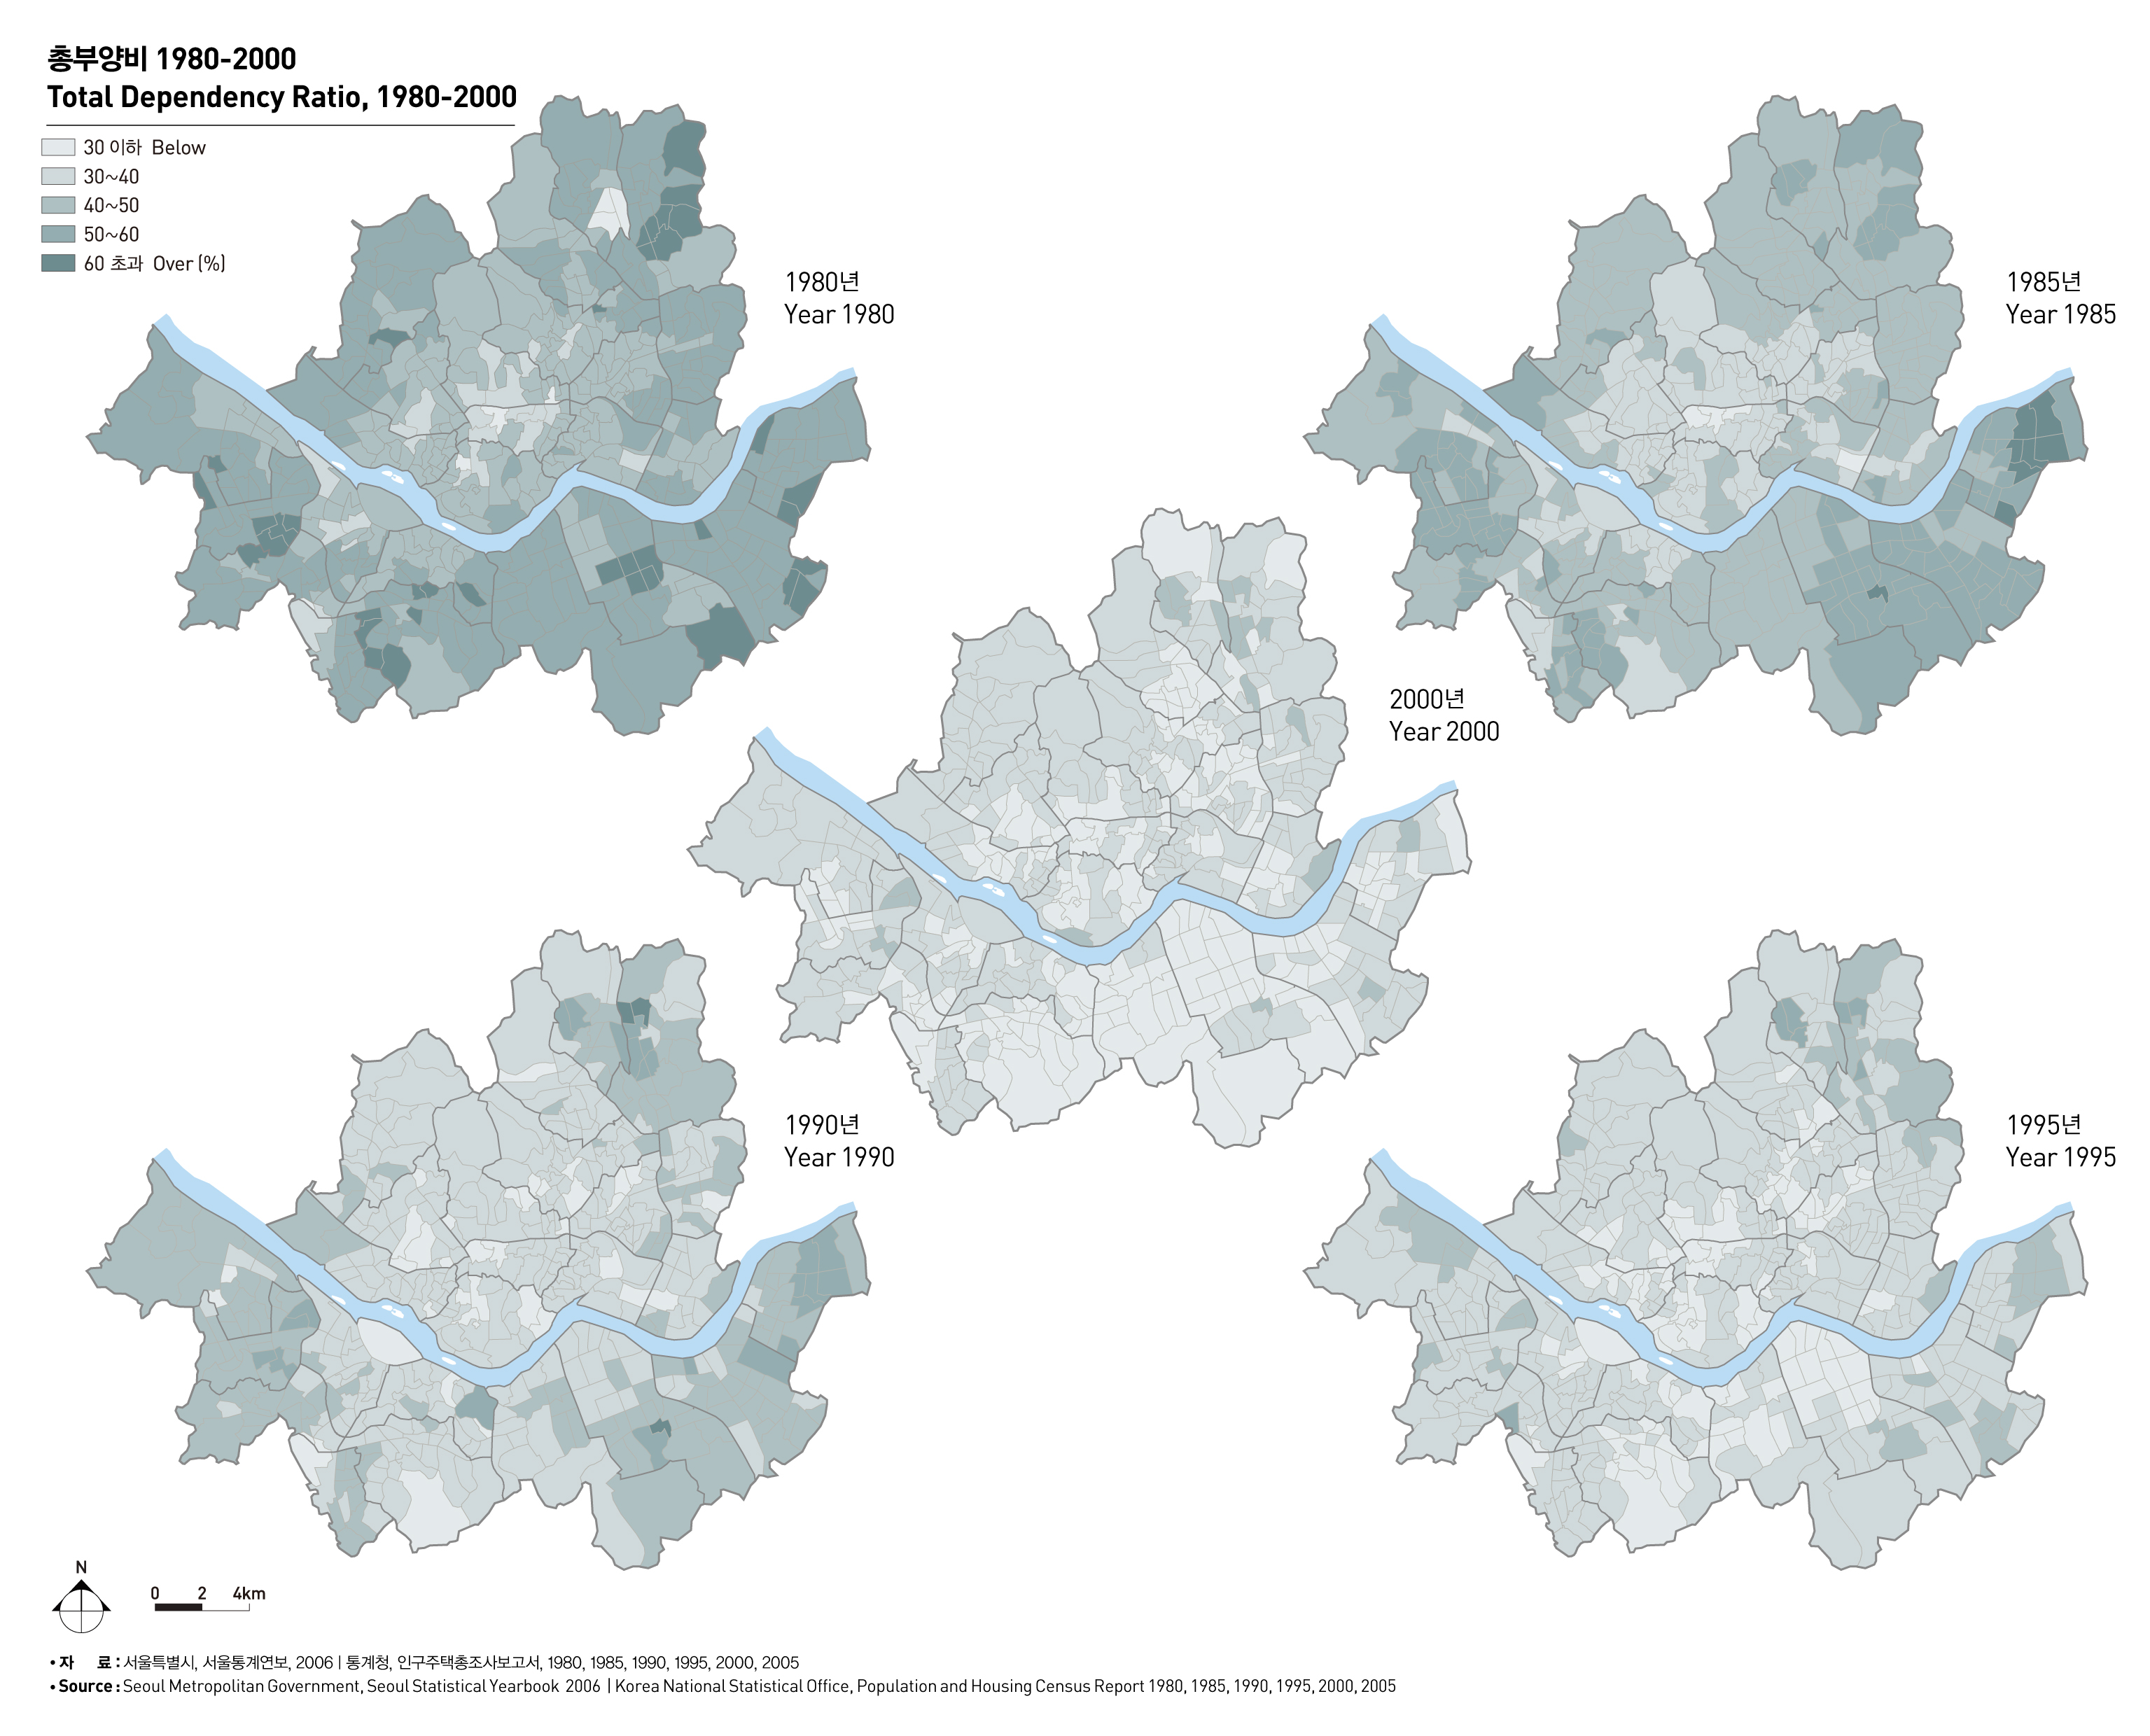
출처 : 서울특별시, 서울통계연보, 2006
통계청, 인구주택총조사보고서, 1980, 1985, 1990, 1995, 2000, 2005