
-
Housing
Residential Mobility within the Seoul Metropolitan Area
-
1. Population Migration to and from Seoul within the Seoul Metropolitan Area
1.1. Moving in and out of Seoul
Net migration of 74,000 people from Seoul annually; population reduction resulting from social factors rather than natural factors
In 2011, social factors such as move-outs contributed to a net decrease of 113,000 in the population of Seoul, while natural factors such as births and deaths contributed to a net increase of 51,000 people. While the population of Seoul decreased by 74,000 people on average annually due to net migration out of Seoul and increased by 58,000 due to births exceeding deaths over the course of 10 years from 2001 to 2011. Based on this, it can be said that the population reduction in Seoul in the past l0 years was more heavily affected by the social factors than the natural factors.
Increase in the net outflow of population since 2010
Althouth the degree of outf1ow of population decreased between 2001 and 2009, it increased dramatically after 2010. There was a net outflow of 80,000 people from Seoul on a yearly basis from 2000 to 2012.
.jpg)
Source : Statistics Korea, Population Trends Survey, each year; Statistics Korea, Korean Populatlon Migratlon Statistics, each year.
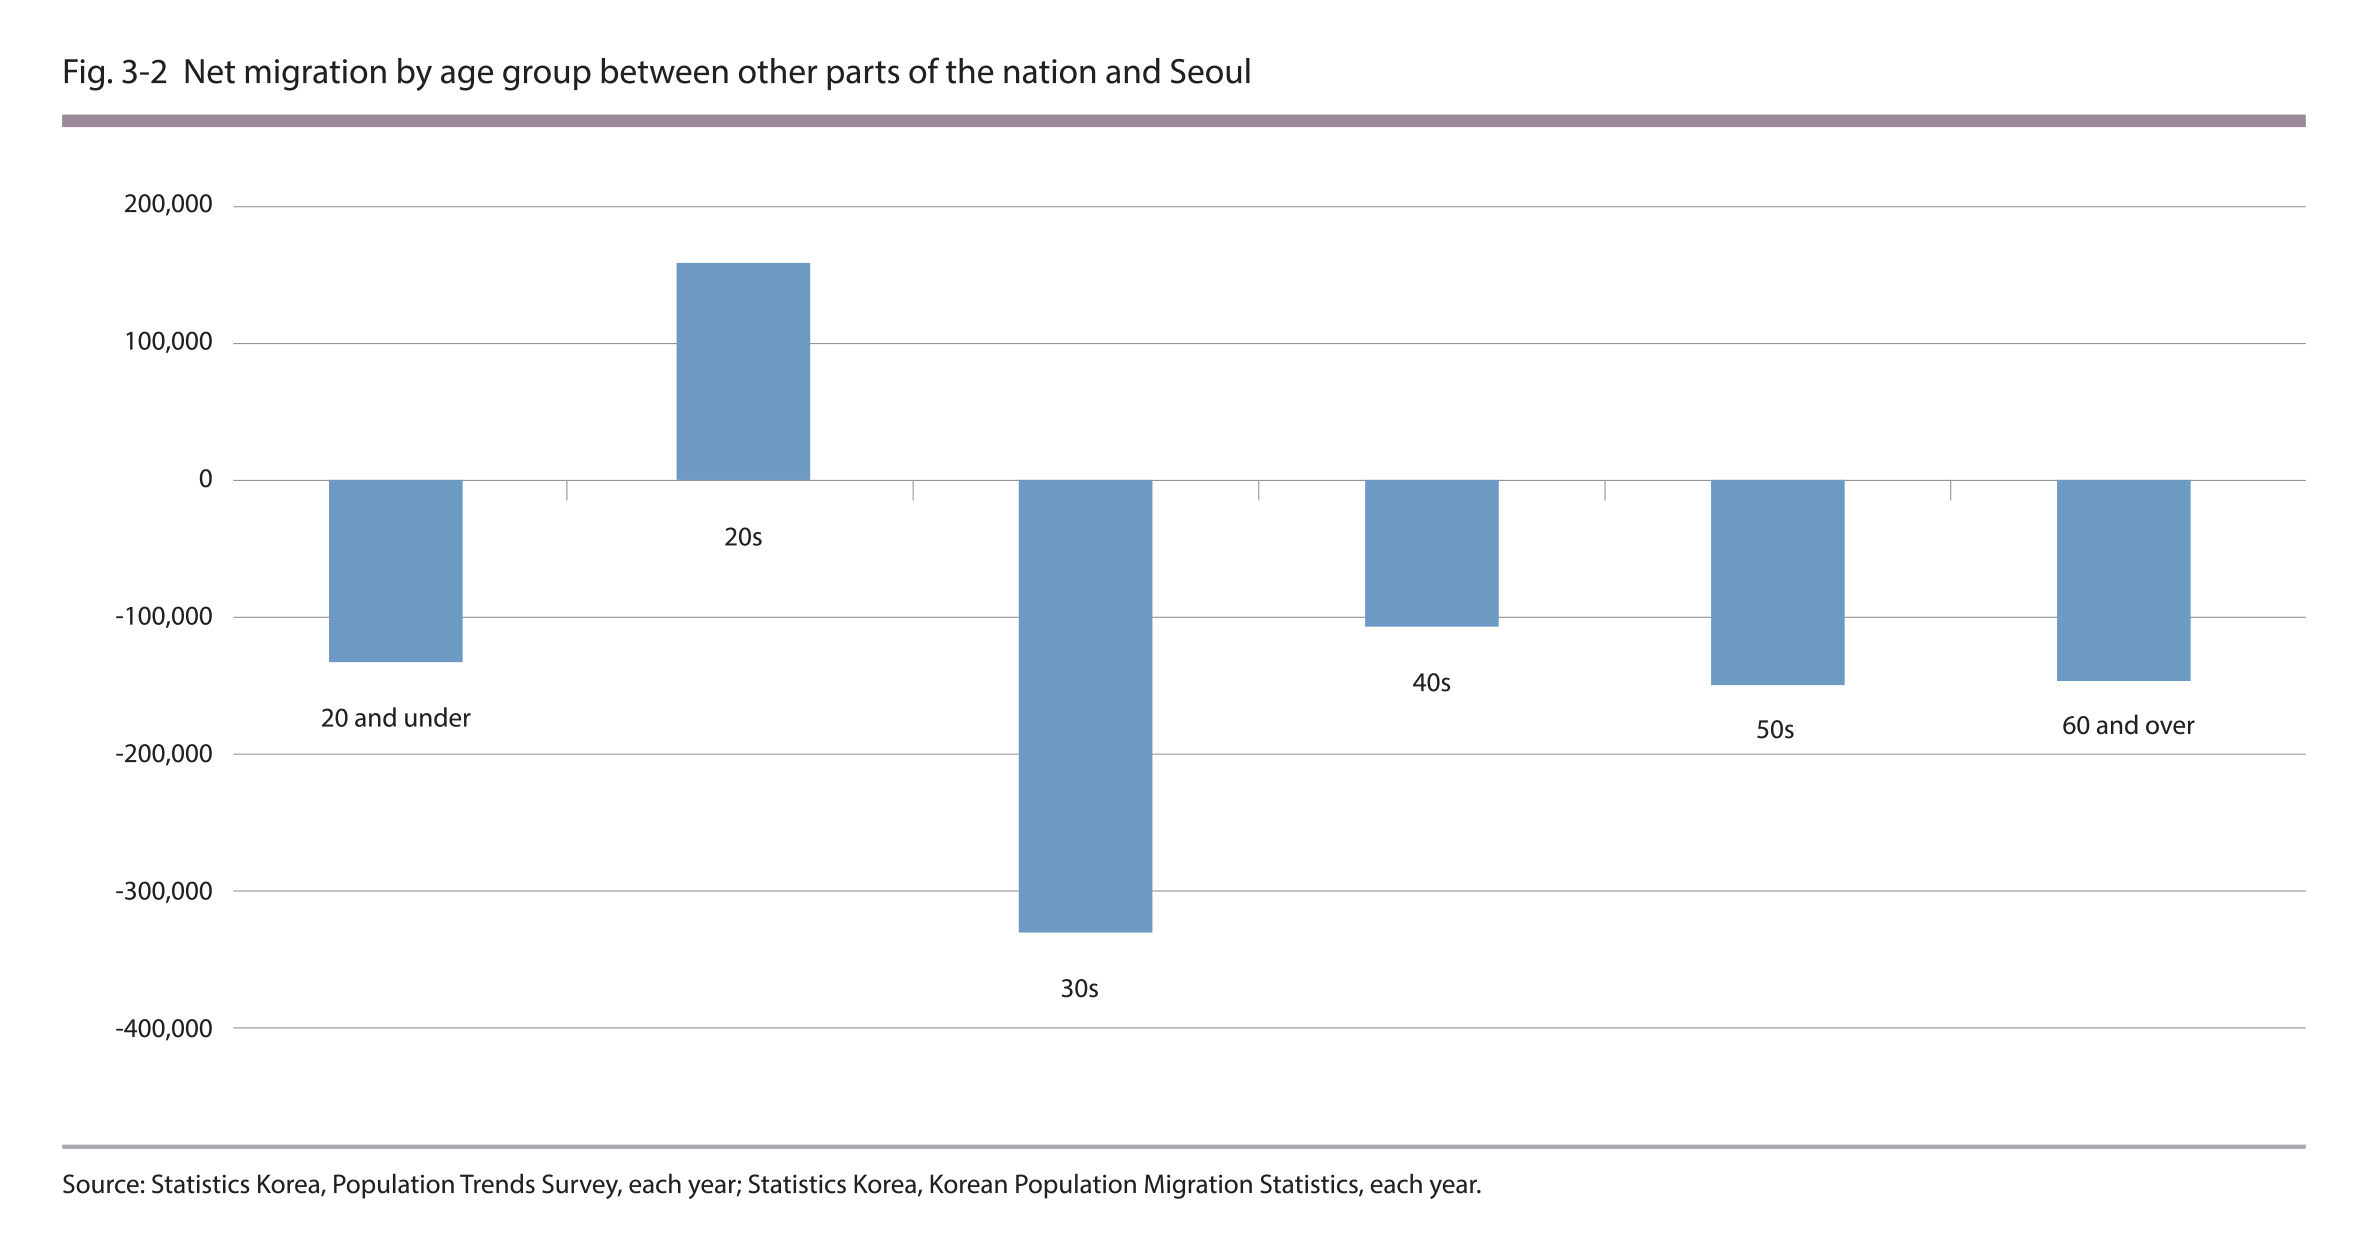
Population exodus from Seoul from all age groups, excluding the 20s, and the largest outflow of people in their 30s (2001~2010)
From 2001 to 2010, there was a net outflow of a total of 700,000 people from Seoul. There was a net outflow from all age groups, excluding the people in their 20s, as the move-out rate was higher than the move-in rate, while there was a net inflow of 17,000 people in their 20s annually on average. The net inflow of people in their 20s is speculated to have resulted from moving into Seoul to find a job or for schooling. On the other hand, there was a net outflow of 34,000 people in their 30s annually on average, and this was the highest outflow rate among all age groups. An explanation for this could be the fact that the people in their 30s get married and move to the Incheon and Gyeonggi Province, where the housing costs (rent) are relatively more affordable.
Source : Statistics Korea, Population Trends Survey, each year; Statistics Korea, Korean Populatlon Migratlon Statistics, each year.
1.2. Migration between Seoul ↔ Incheon and Gyeonggi Province
65% of the people moving out of Seoul migrated to Gyeonggi Province
A total 4.86 million people moved out of Seoul from 2001 and 20l0. The highest ratio of these people (65%) moved to Gyeonggi province, while 7% moved to Incheon and 28% moved to areas other than the Seoul Metropolitan Area. The ratio of population movement within the Seoul Metropolitan Area was high, especially between Seoul and Gyeonggi Province.
On the other hand, 52% of the people moving into Seoul departed from GGyeonggi Province, while 7% and 41% left from Incheon and areas other than the Seoul Metropolitan Area, respectively. Althouth a large number of people moved into Seoul from the regions other than the Seoul Metropolitan Area, the number of people who moved from Gyeonggi Province to Seoul was still higher.
.jpg)
Source : Statistics Korea, Korean Population Migratlon Statistics, each year.
2. Networks and Reasons for Residential Mobility
2.1. Households Moving Out of Seoul
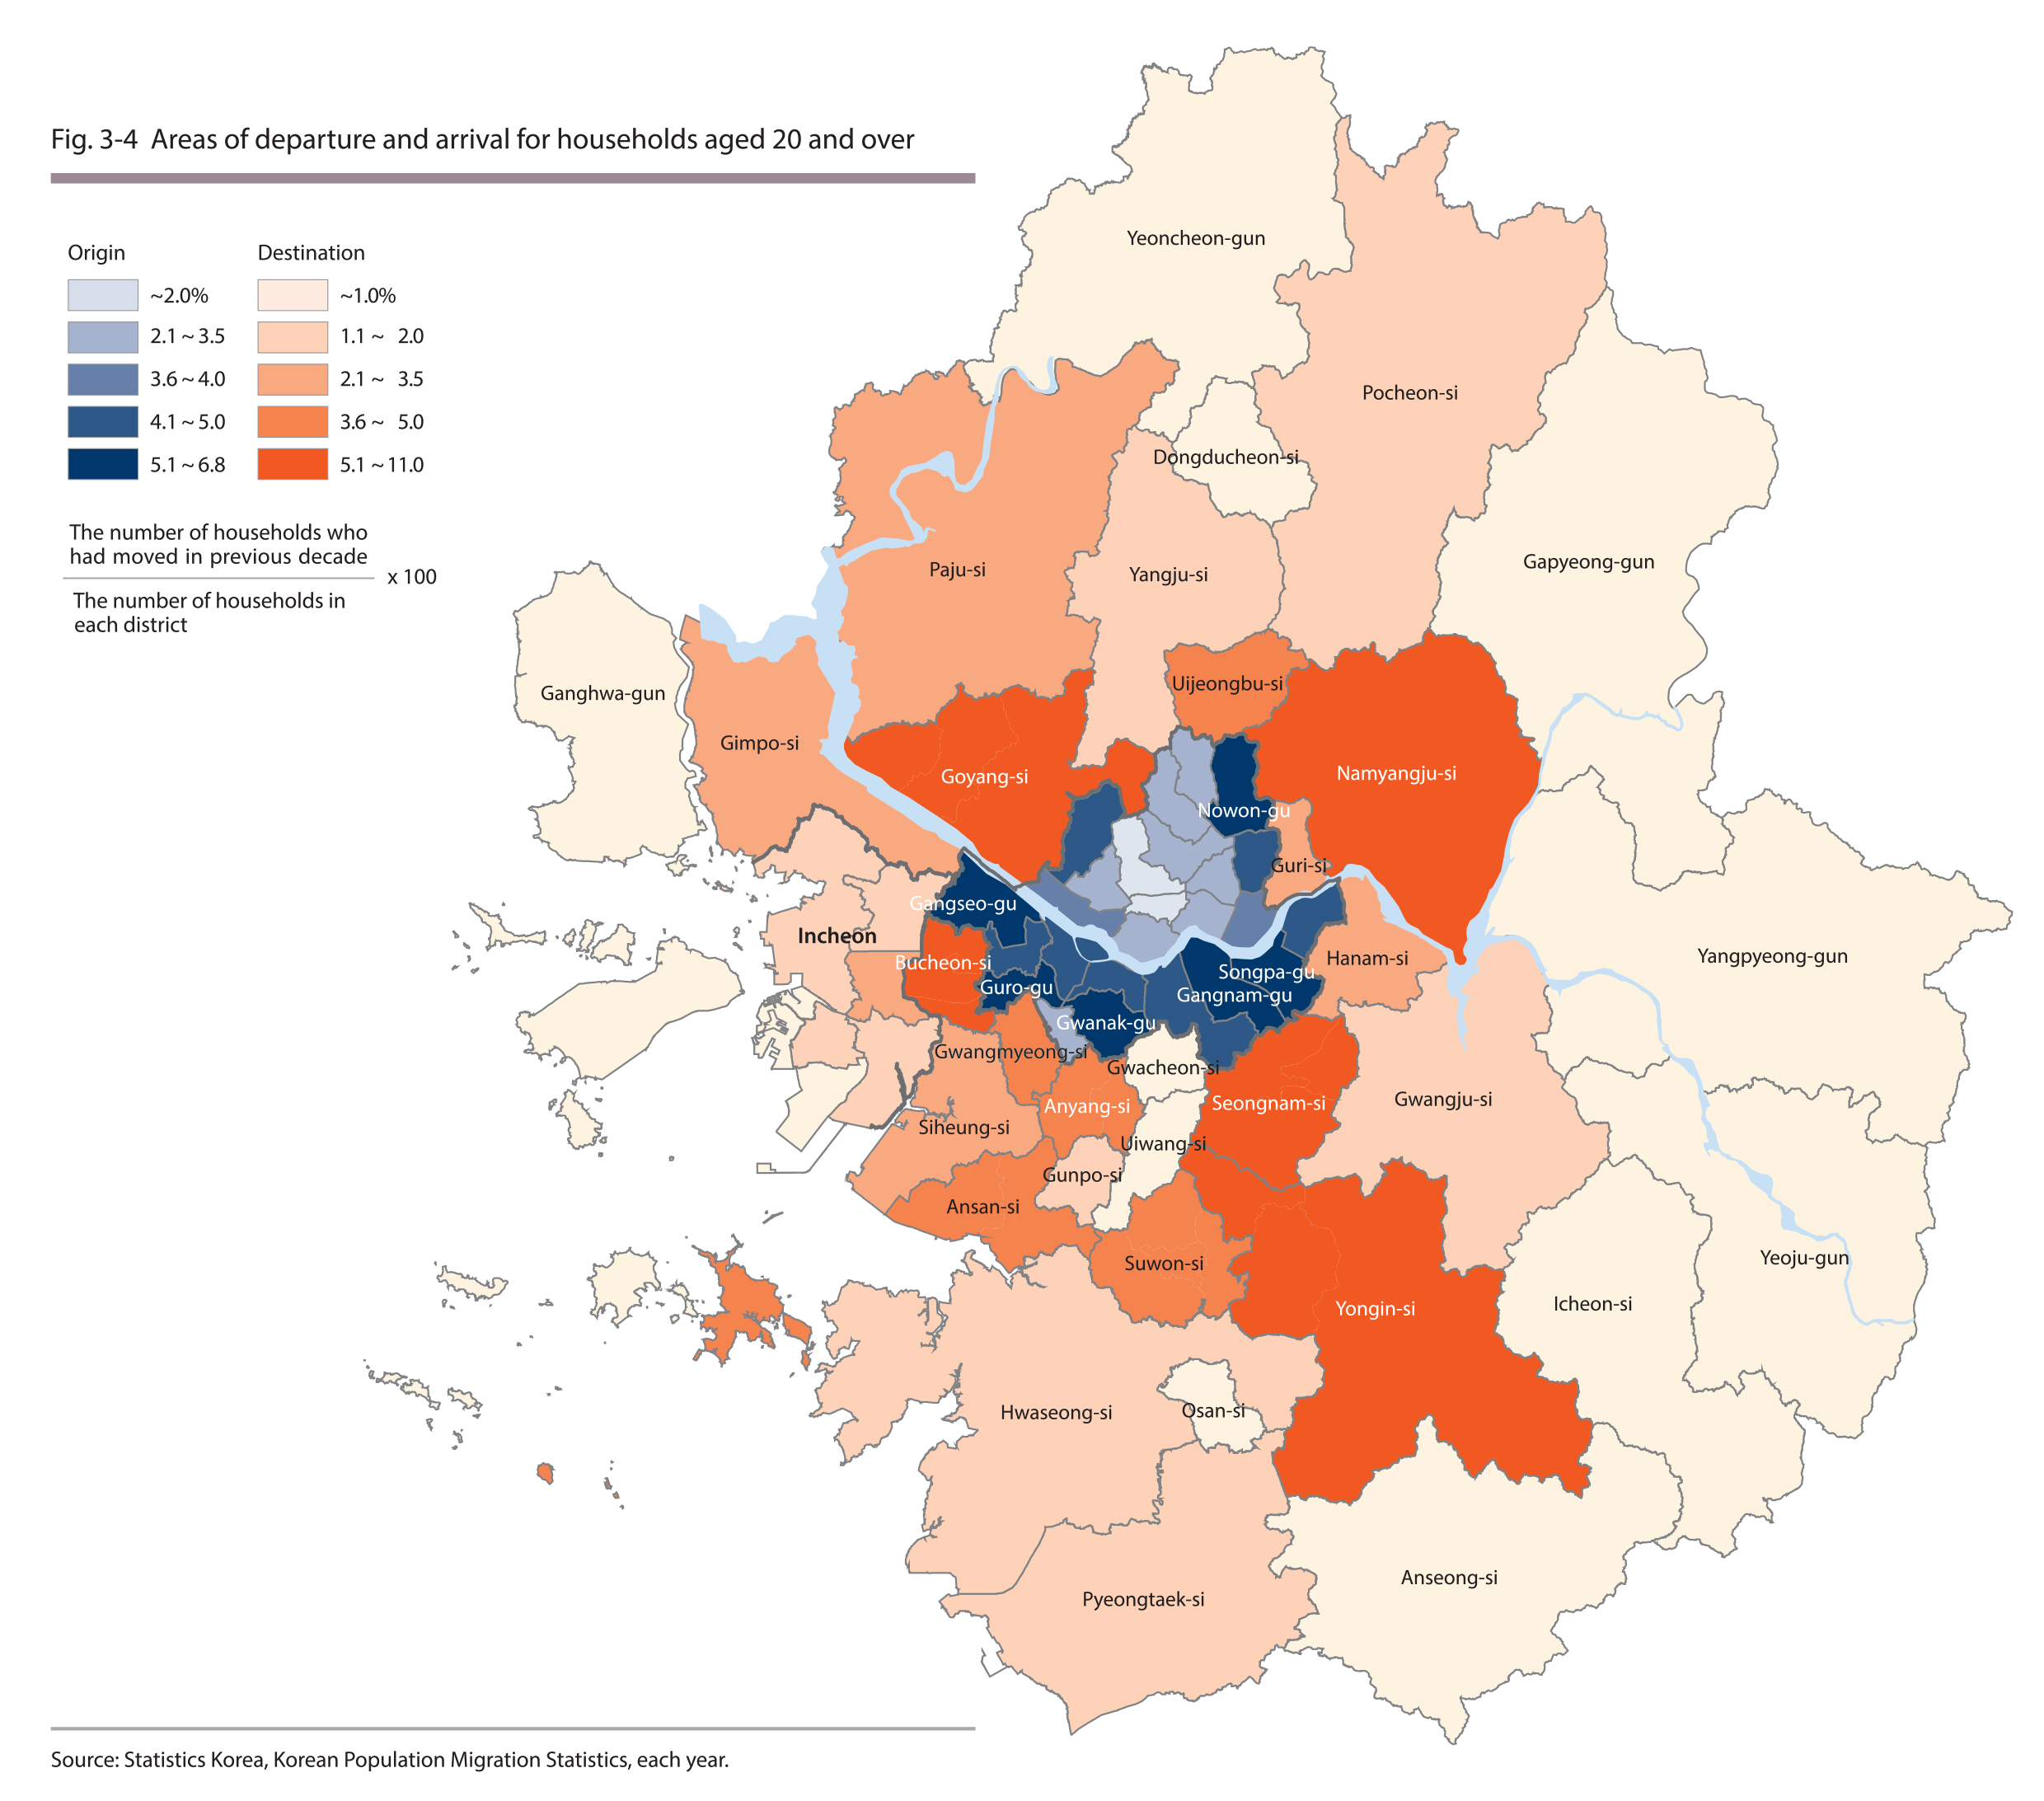
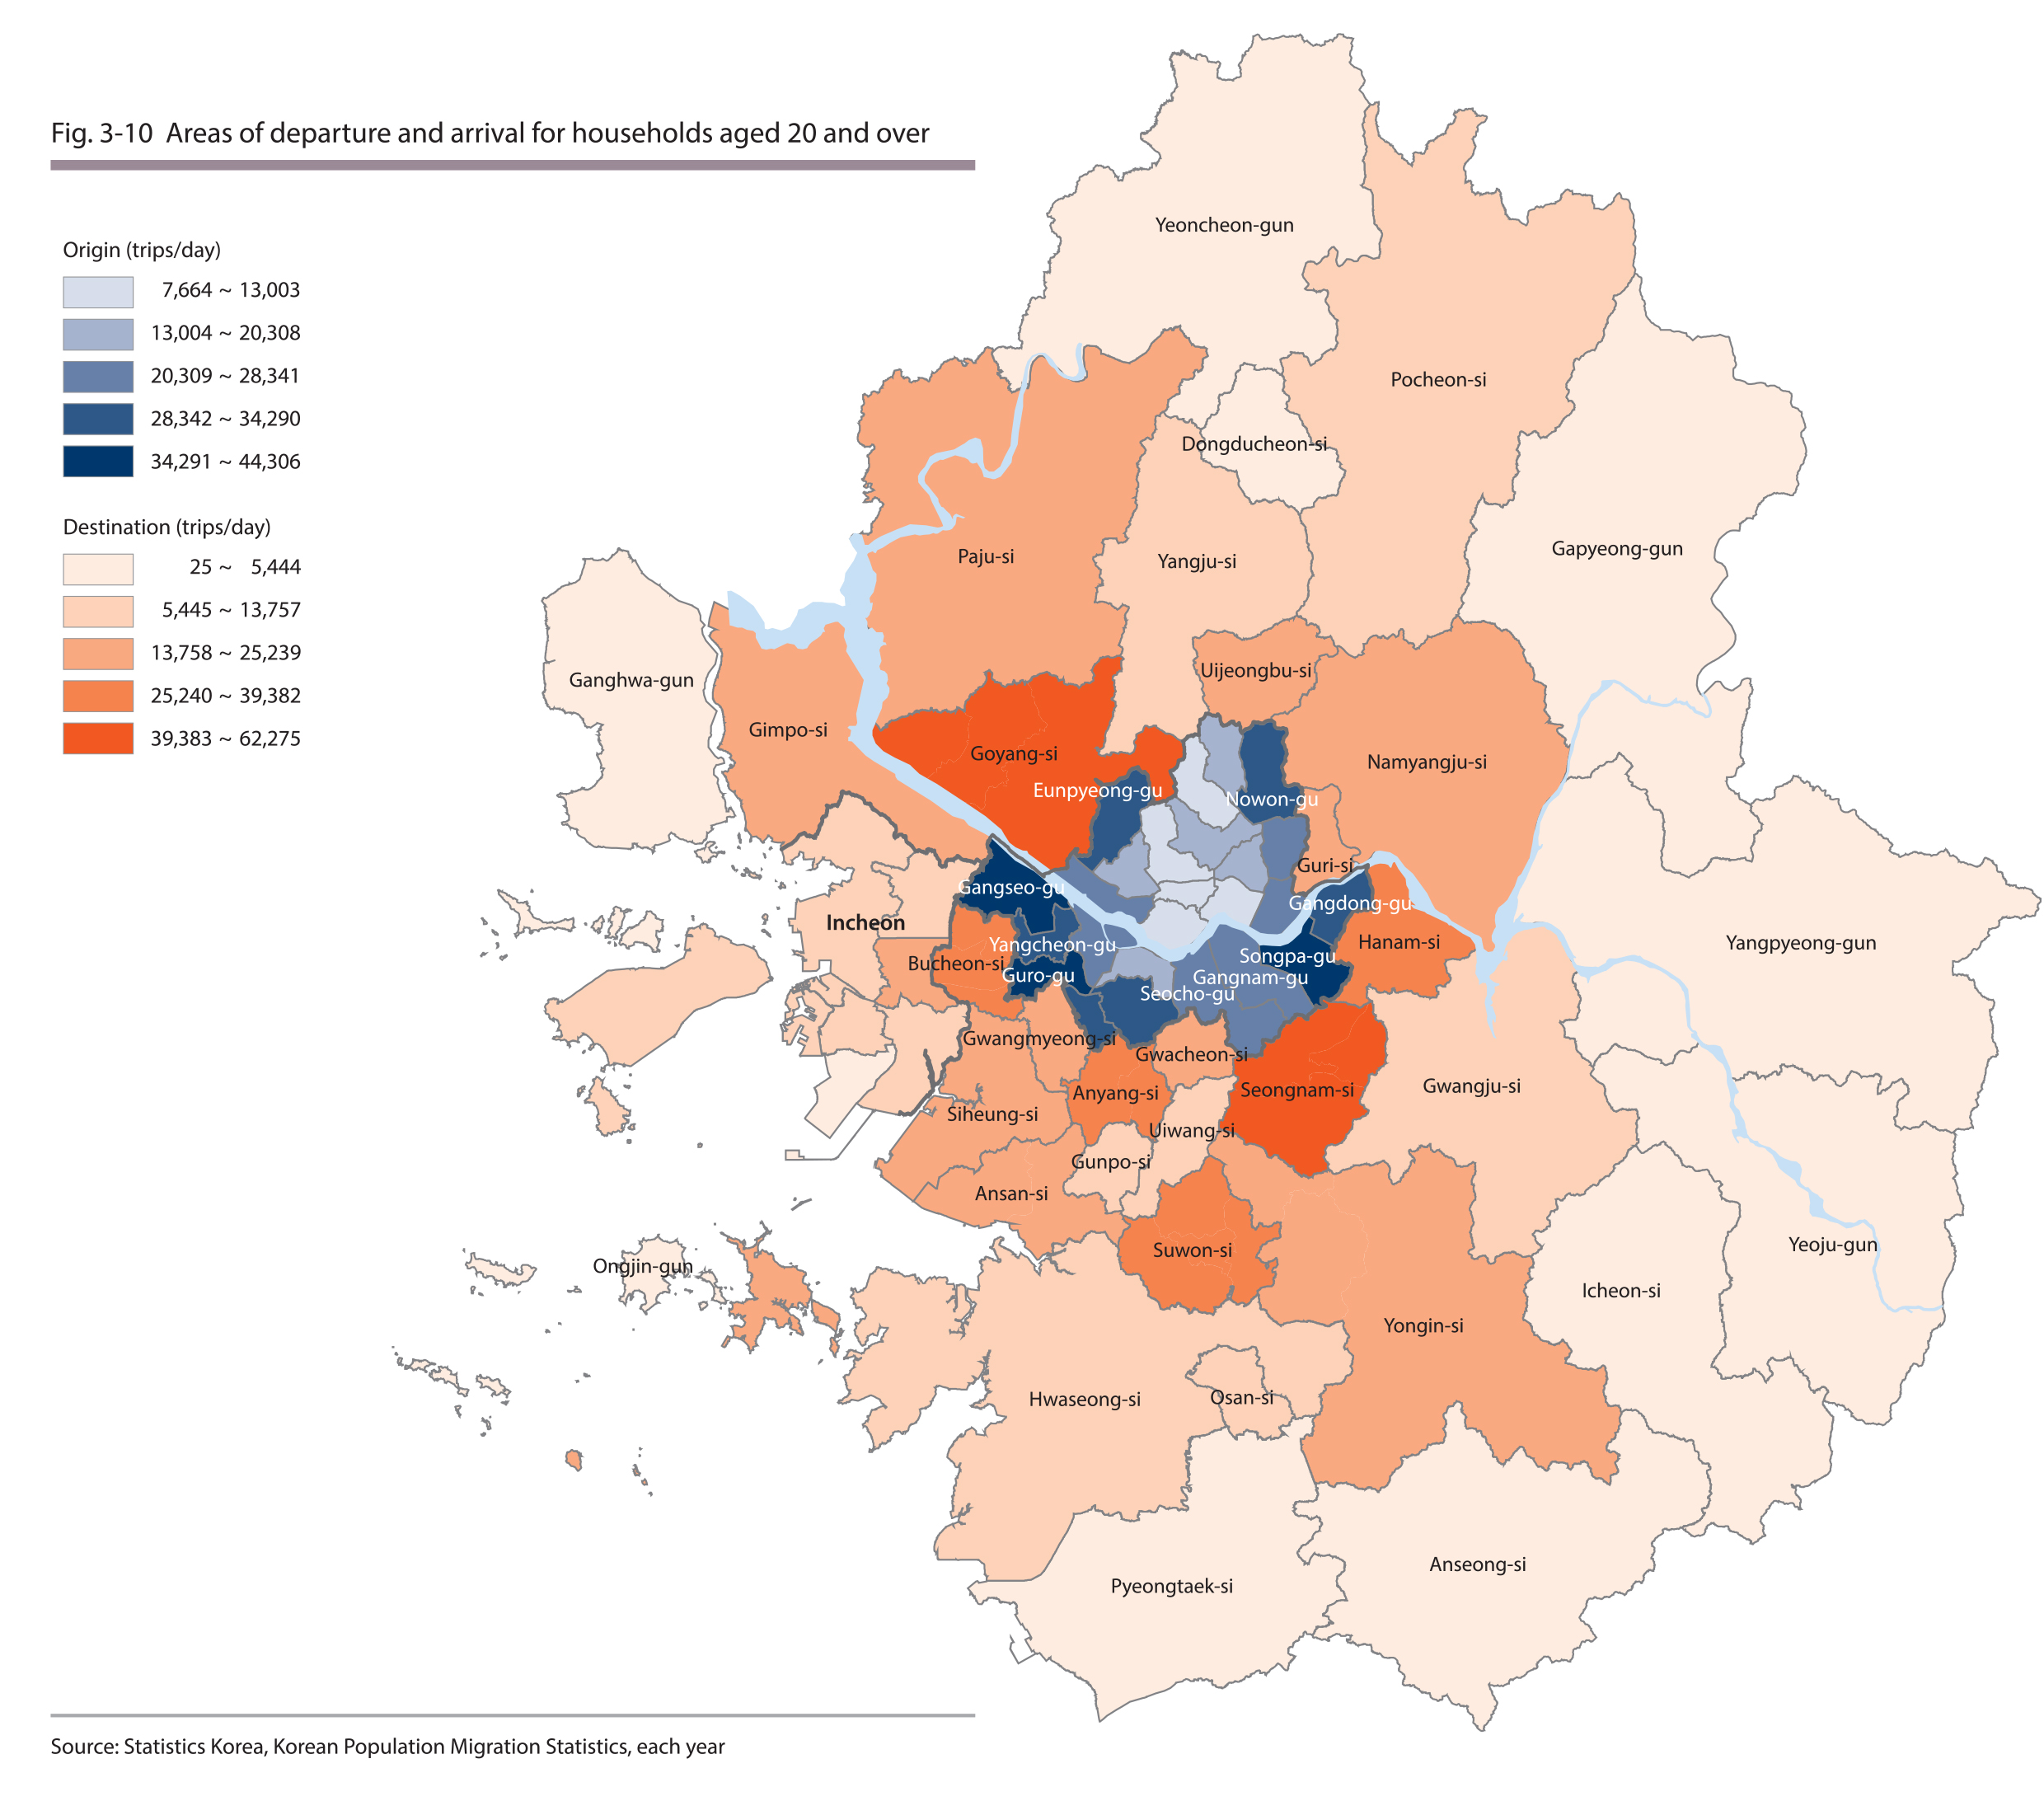
210,000 households moving from Seoul to Incheon and Gyeonggi Province annually on average
The number of households, with the heads of the households being in their 20s and older, who moved out of Seoul between 2001 and 2010, was 2.09 mi1lion, which means that 210,000 households moved out annually on average. The most common areas of departure were Songpa-gu (7%), Gwanak-gu (6%), Gangnam-gu (6%), Gangseo-gu (6%) and Guro-gu (5%) in Seoul, and there was a tendency to arrive in Goyang-si (11%), Seongnam-si (9%), Yongin-si (7%), Bucheon-si (7%) and Namyangju-si (6%) in Gyeonggi Province
2.2. Households Moving into Seoul
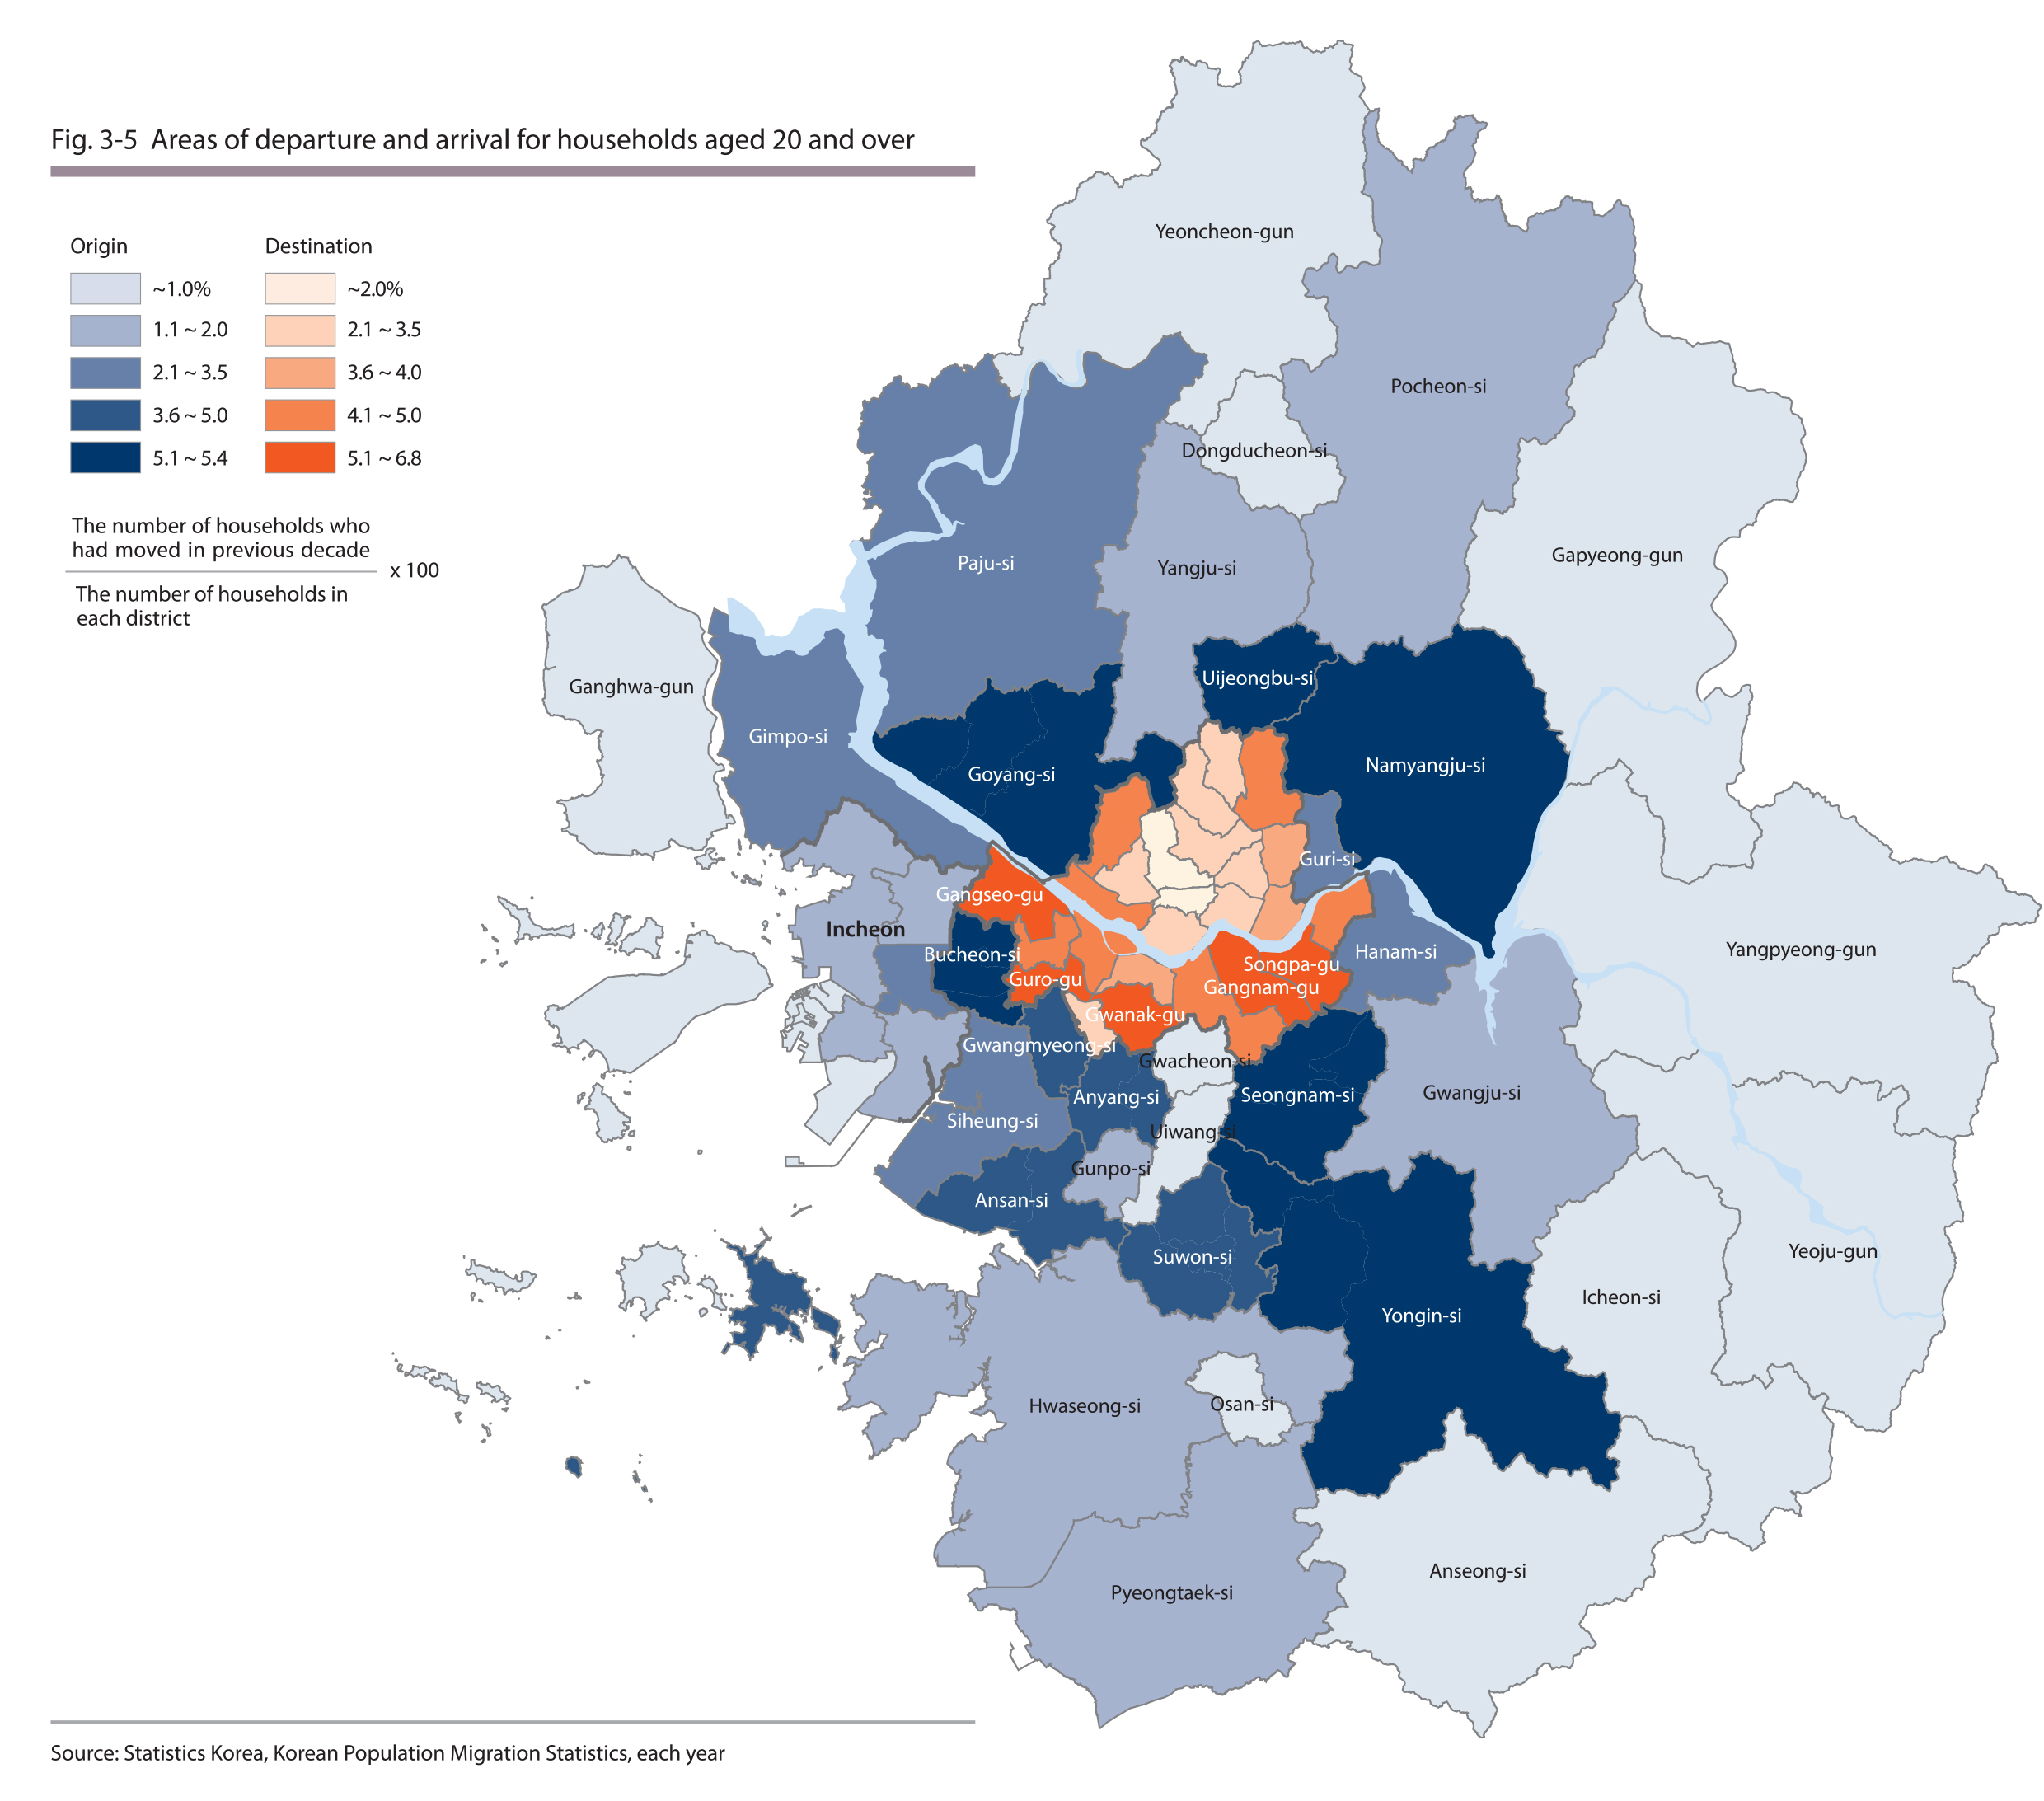
160,000 households moving into Seoul from Incheon and Gyeonggi Province annually
A total of 1.6 million households, with the heads of the households being in their 20s, moved into Seoul from 2000 and 2010, which means that 160,000 households moved into Seoul on average annually. The common areas of departure were Goyang-si (11%), Seongnam-si (9%), Bucheon-si (7%), Yongin-si (6%), and Namyangju-si (5%) in Gyeonggi Province and there was a tendency to move into Songpa-gu (7%), Gangnam-gu (7%), Gwanak-gu (6%), Gangseo-gu (6%) and Guro-gu (5%) in Seoul.
Source : Statistics Korea, Korean Population Migratlon Statistics, each year.
Source : Statistics Korea, Korean Population Migratlon Statistics, each year.
2.3. Reasons for Residential Mobility
Households moved out of Seoul to purchase a home or due to a new job
Households moving out of Seoul tended to move to Incheon and Gyeonggi Province due to a new job (24%), to purchase a home (22%) or in search of larger and better housing (14%). 12% moved out of Seoul due to the financial burden caused by rent and lower income, and this figure was 4%p higher compared to the households that moved into Seoul for the same reasons. It is deemed that the development of new towns in Gyeonggi Province, large supply of new housing and relatively more affordable housing costs compared to Seoul had an impact on the decision to move out of Seoul.
As of 2012, "a new job" became an increasingly important factor causing households to move out of Seoul, while "purchasing a home" became a less important factor compared to 2008.
Households moved into Seoul due to a new job or for child education
It was found that the primary reasons for moving into Seoul were a new job (24%) and child education (21%). As of 2012, "child education" and "transportation access and location" became increasingly important factors causing households to move into Seoul, while "purchasing a home" became a less important factor compared to 2008.
.jpg)
Source : Ministry of Land, Transport and Maritime Affairs, Survey on Residential Conditions, 2008, 2010, 2012.
.jpg)
Source : Ministry of Land, Transport and Maritime Affairs, Survey on Residential Conditions, 2008, 2010, 2012.
3. Conditions and Characteristics of Commuters in the Metropolitan Living Area
The term, "households in the metropolitan living area," refers to the "households that cross the city boundaries for daily commuting purposes," and they are divided into "inflow commuters" commuting to Seoul for work while living in Incheon or Gyeonggi Province and "outflow commuters" commuting to Incheon or Gyeonggi Province while living in Seoul.
3.1.lnflow Commuters
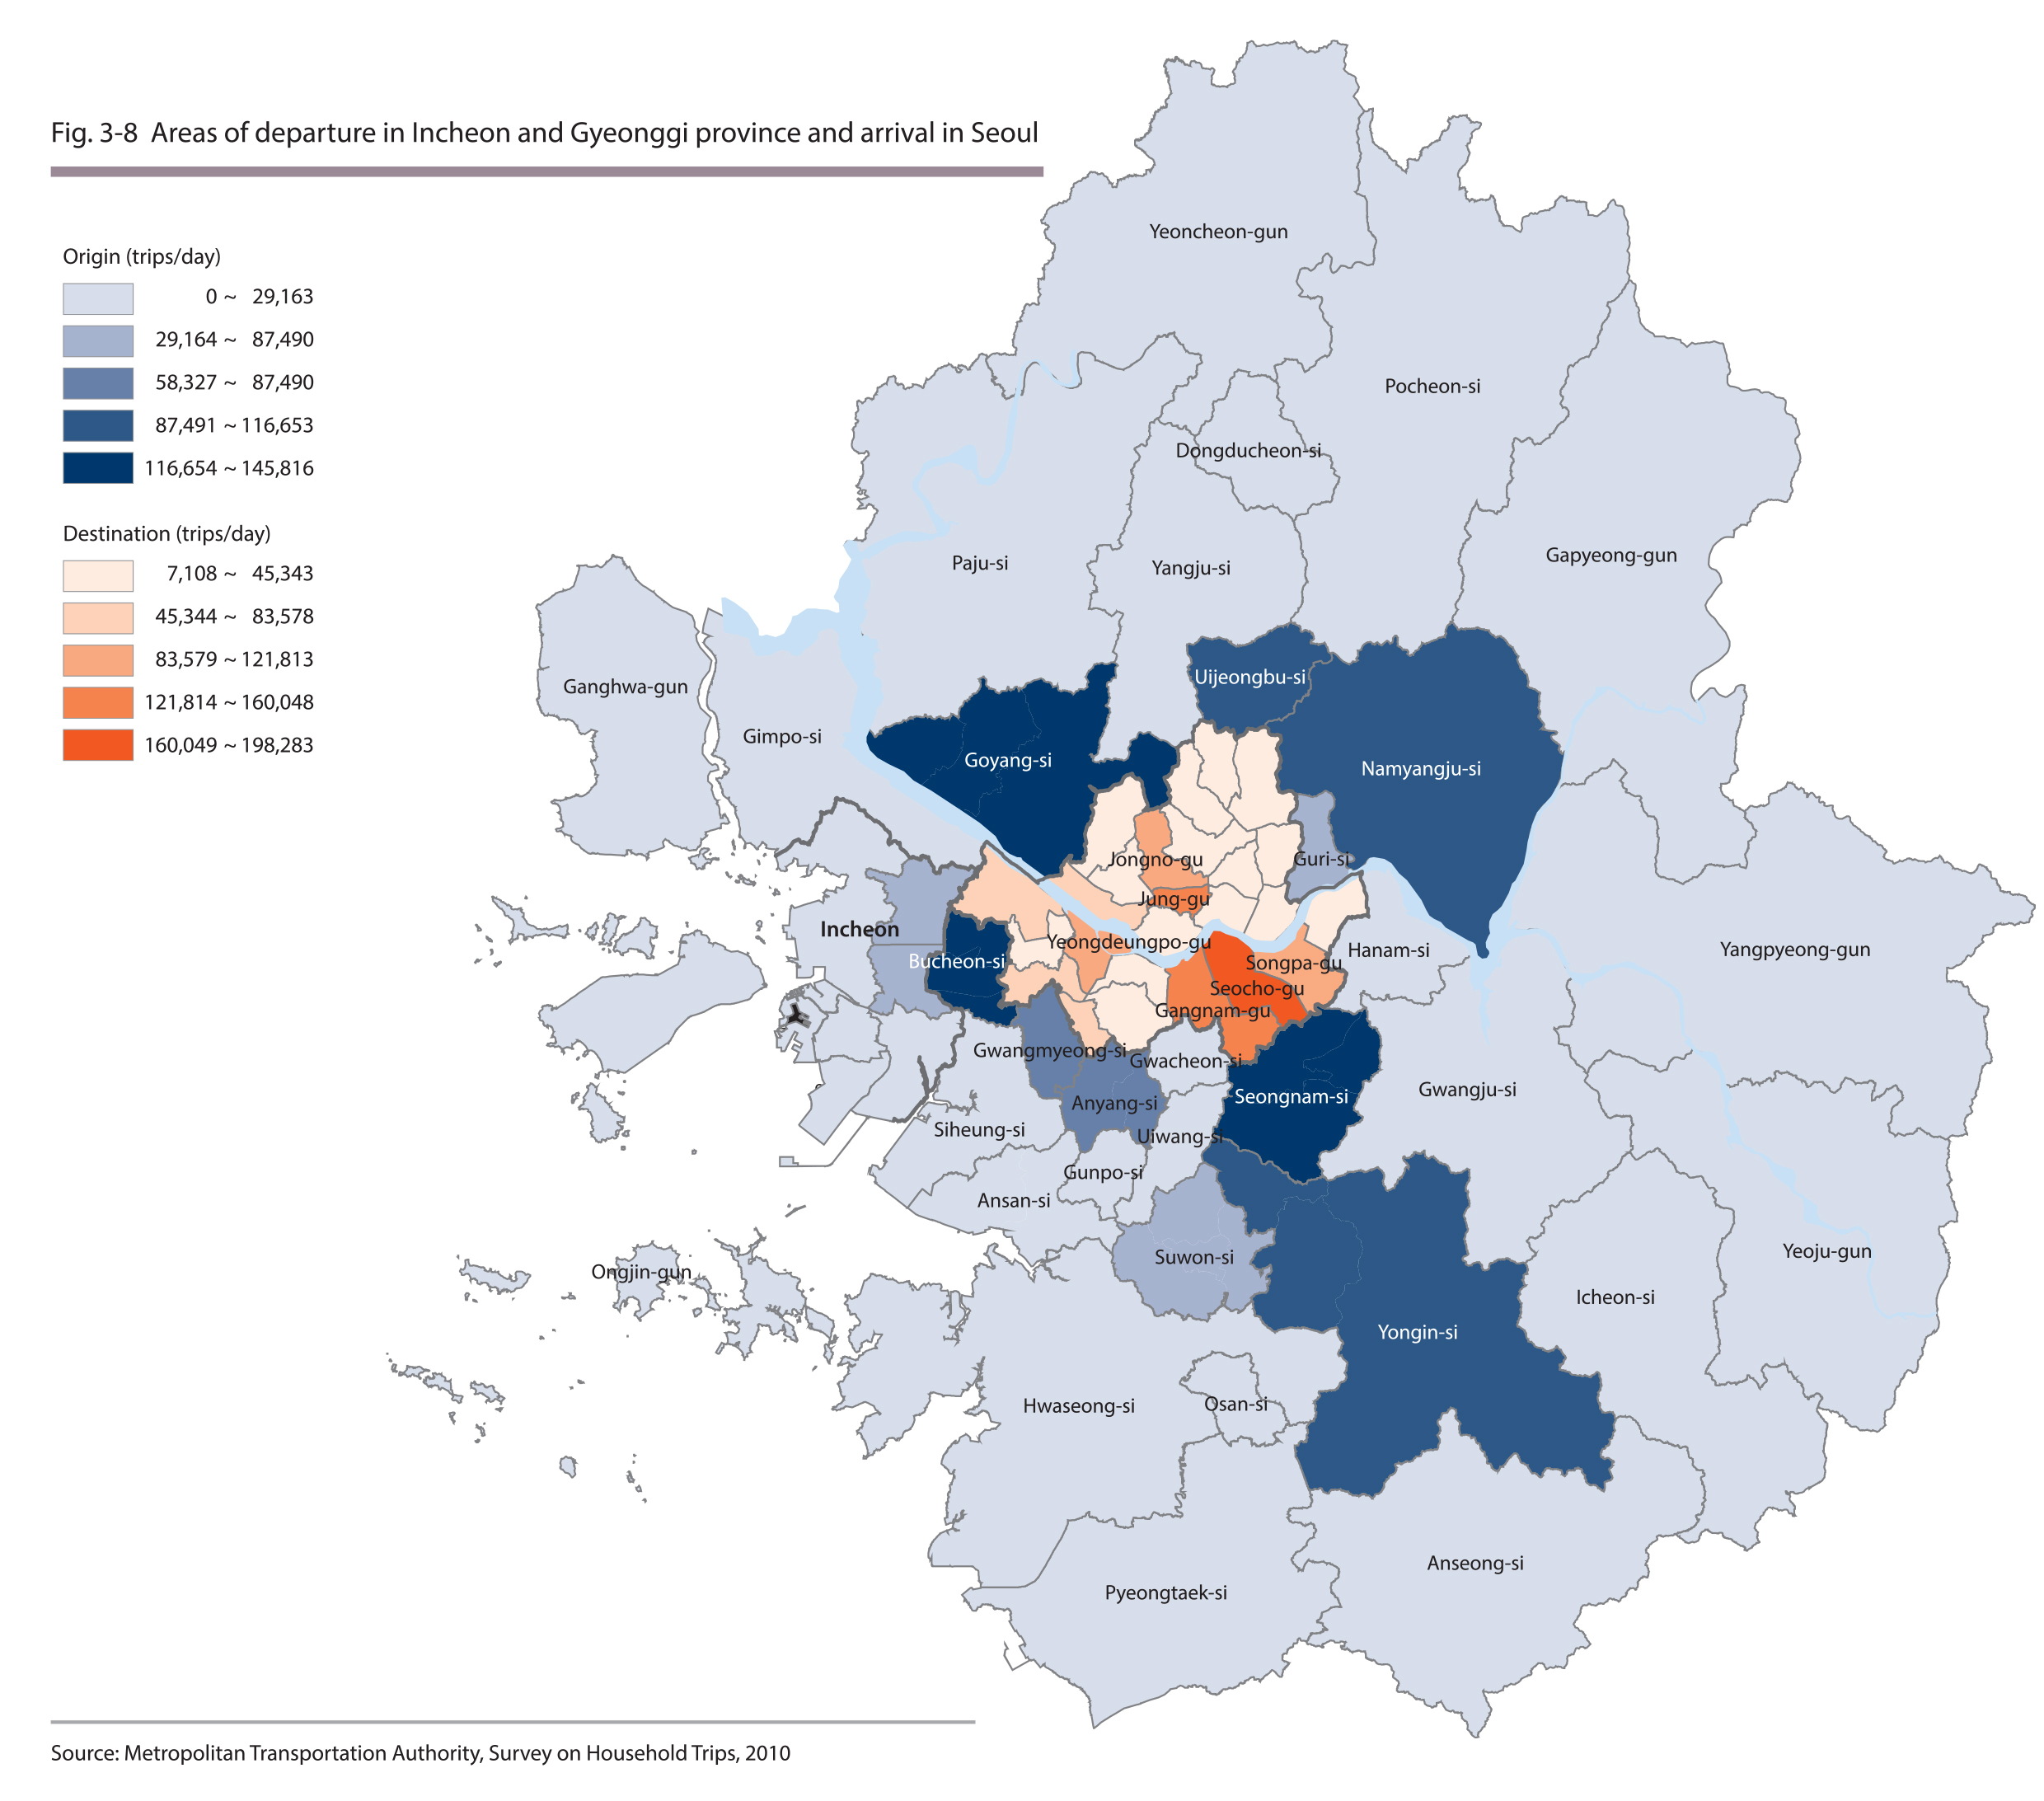
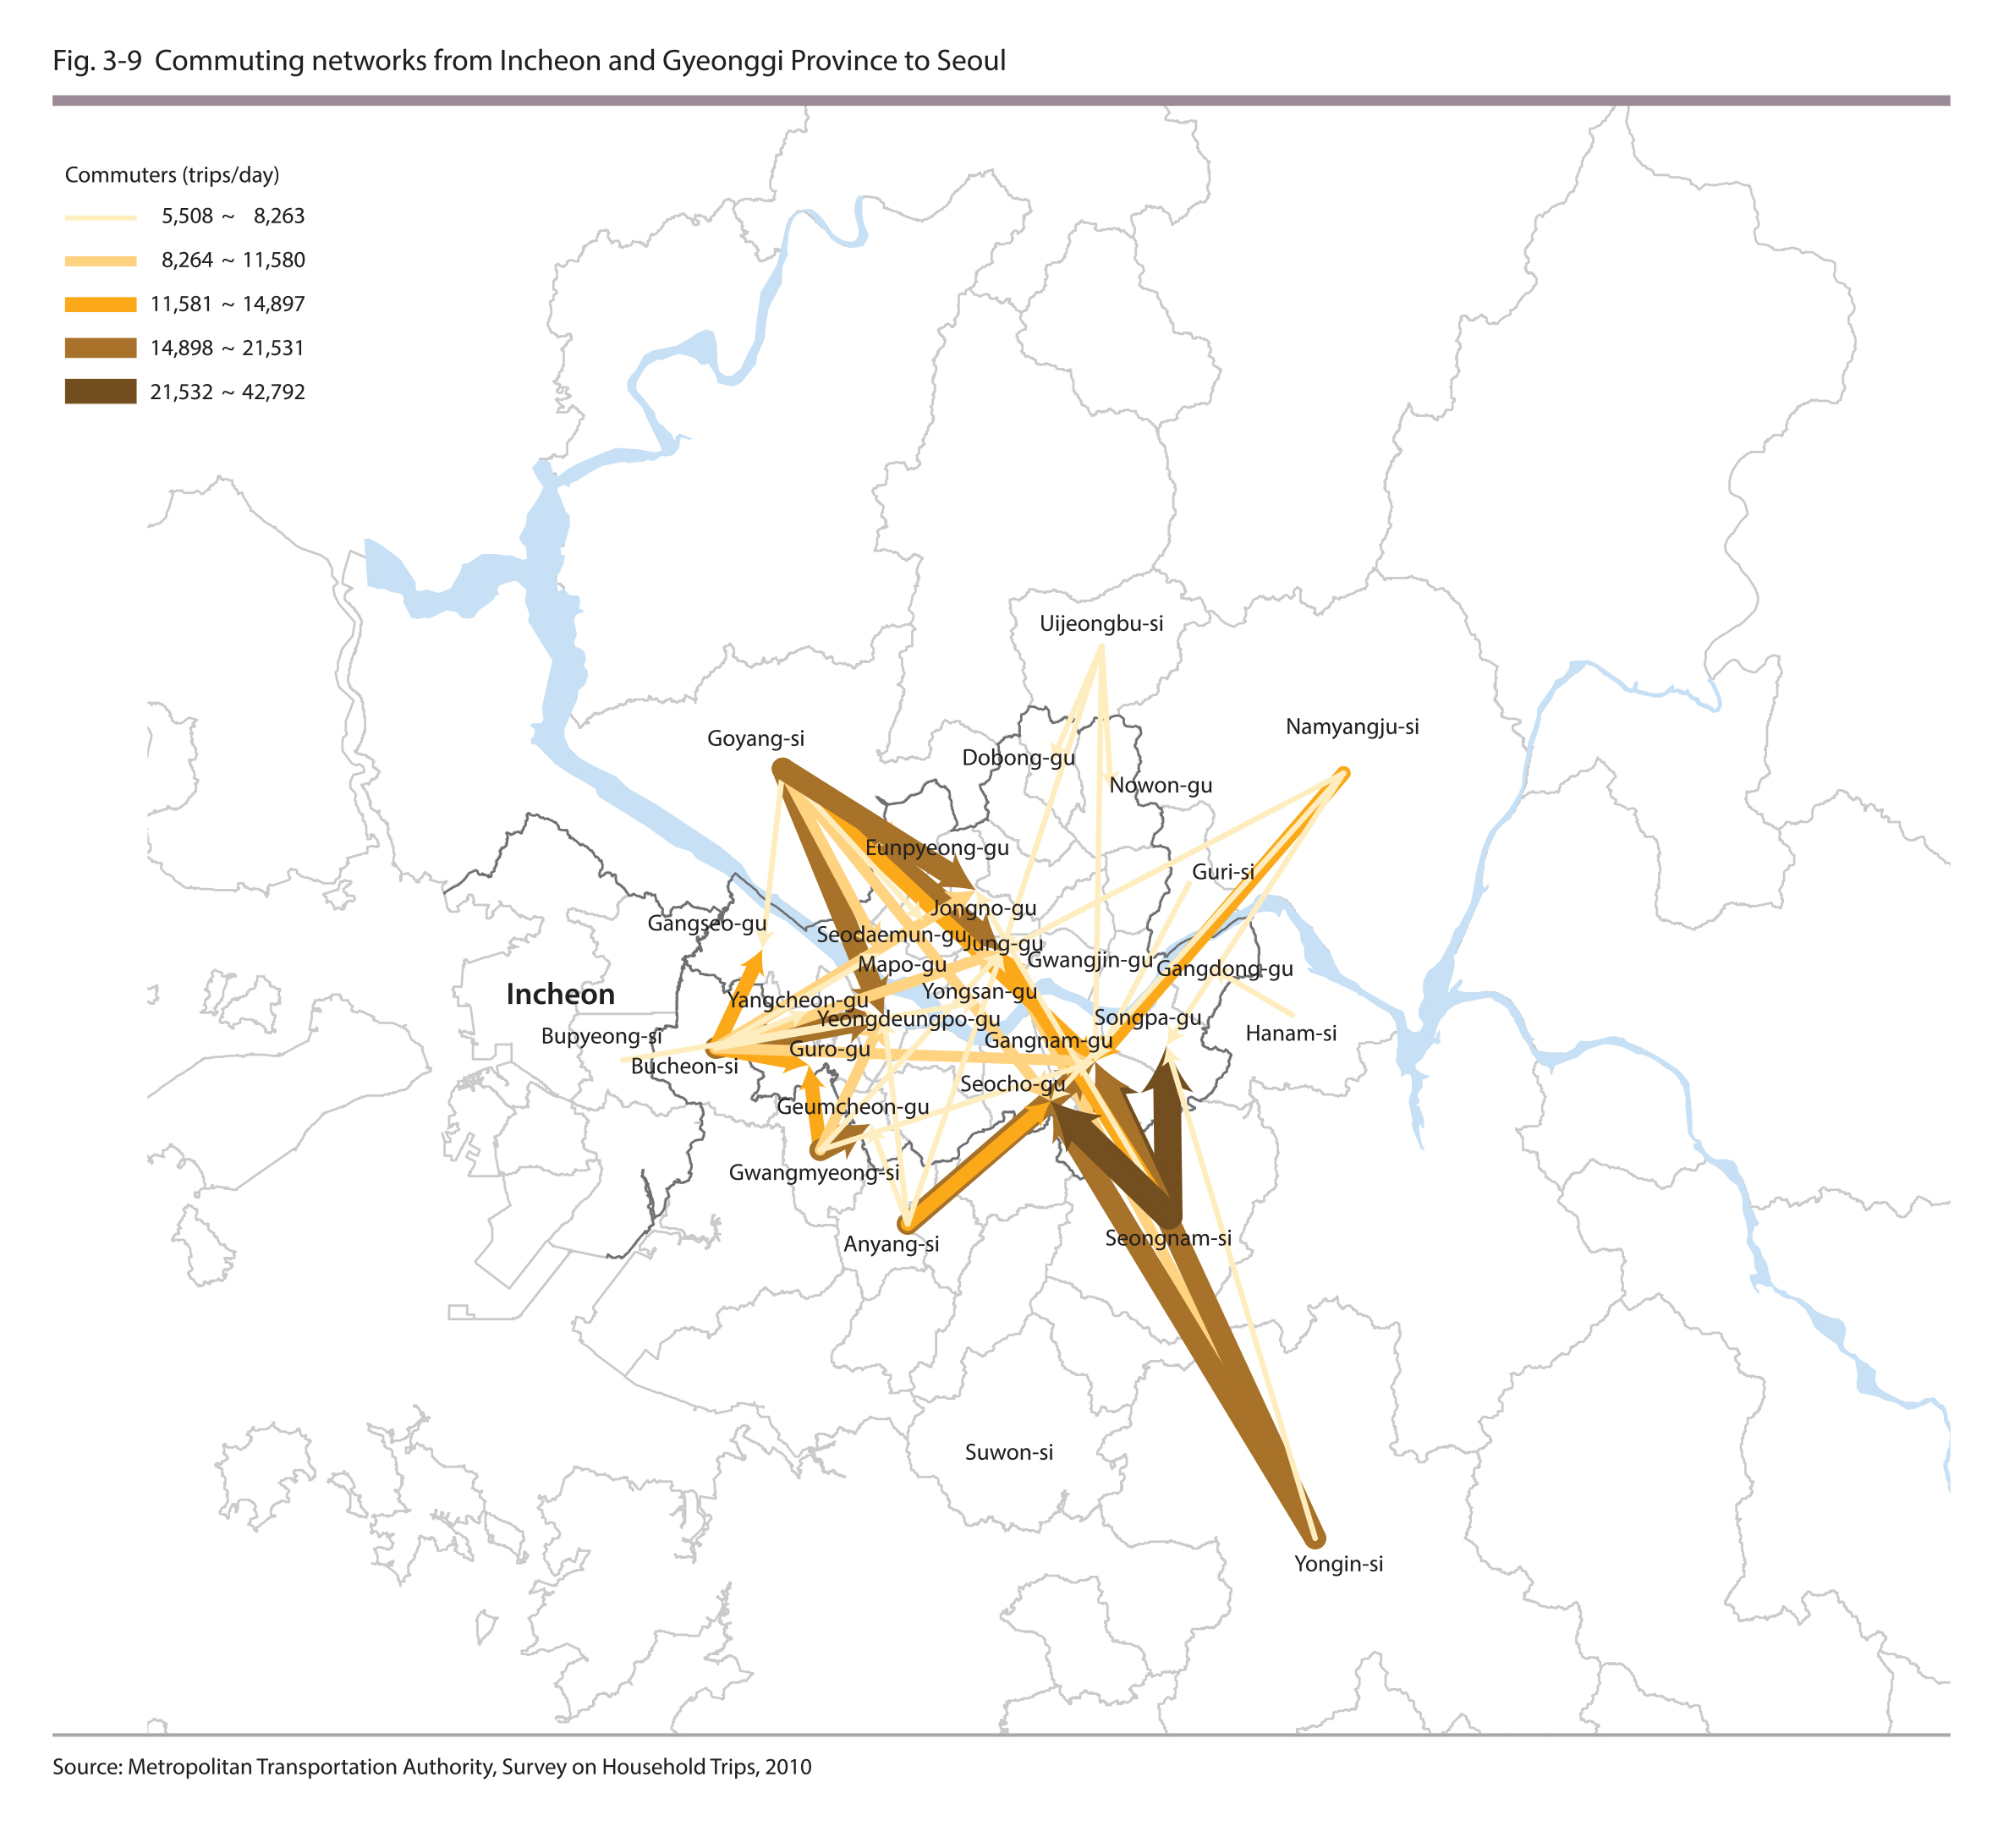
1.25 million inflow commuters on a daily basis; a large number of commuters departing from Seongnam-si and Goyang-si and arriving in Gangnam-gu, Seocho-gu and Jung-gu
As of 2010, there are 1,253,000 inflow commuters coming into Seoul from Incheon and Gyeonggi Province on a daily basis. A large number of such commuters depart from Seongnam-si (12%), Goyang-si (11%), Bucheon-si (9%), Gwangmyeong-si (7%), Anyang-si (6%), Yongin-si (6%) and Namyangju-si (6%) in Gyeonggi Province and arrive in the business centers located in Gangnam-gu (16%), Seocho-gu (11%), Jung-gu (10%), Yongdeungpo-gu (8%), and Jongno-gu (7%) in Seoul.
Bigger network of commuters from new towns to business centers such as Gangnam and a negligible number of commuters entering the northeastern area
The majority of the inflow commuters tended to leave from the first new town development areas and arrive in central business centers in Seoul such as Gangnam and Yeouido. There was a formation of three large commuting networks and they are the southeastern area centering on Gangnam, the northwestern area centering on the city center, and the southwestern area centering on Yeongdeungpo, and more specifically, Seongnam-si ↔ Gangnam-gu (43,000), Seocho-gu (25,000) and Songpa-gu (24,000), Goyang-si ↔ Jung-gu (20,000), Yongin-si ↔ Gangnam-gu (19,000) and Seocho-gu (19,000), Gwangmyeong-si ↔ Geumcheon-gu (19,000), Bucheon-si ↔ Yeongdeungpo-gu (17,000). The northeasteRN area of Seoul receives few inflow commuters, and is believed to have negligible influence.
Source : Metropolitan Transportation Authority, Survey on Household Trips, 2010
Source : Metropolitan Transportation Authority, Survey on Household Trips, 2010
3.2. Outflow Commuters
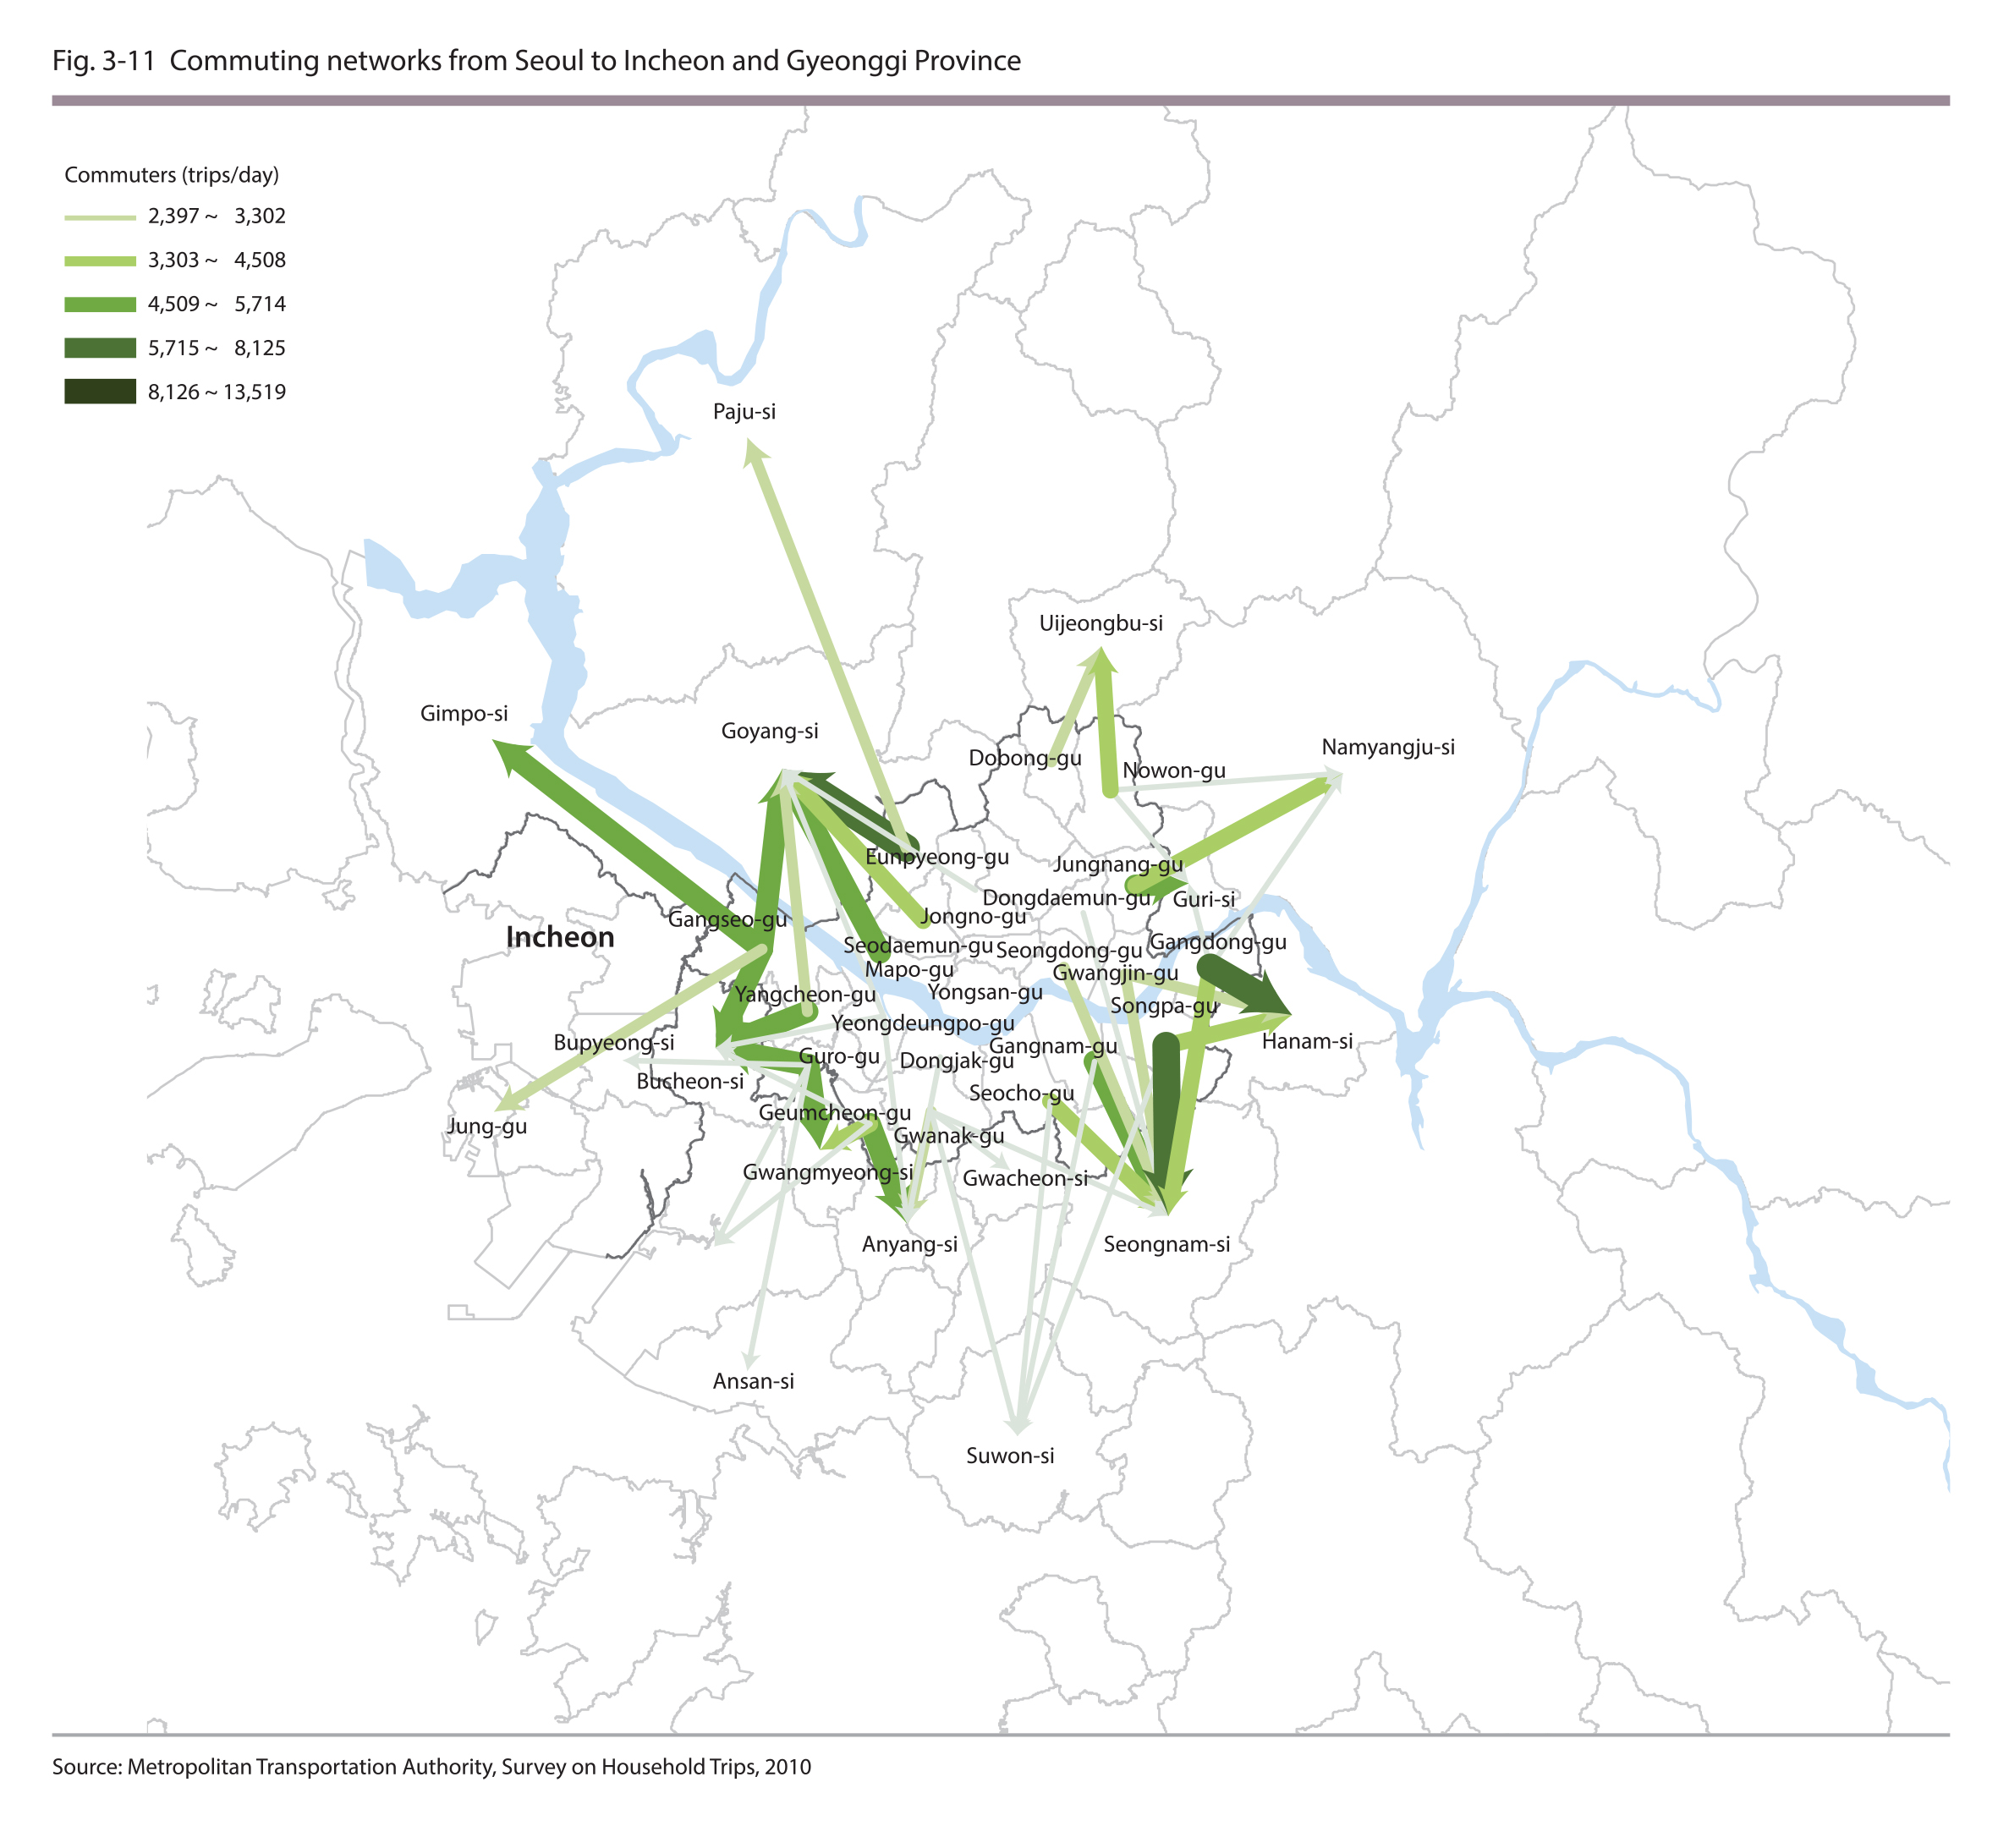
620,000 outflow commuters on a daily basis; a large number of commuters departing from Gangseo-gu and Songpa-gu and arriving in Goyang-si and Seongnam-si
As of 20lO, there are 618,000 outflow commuters traveling from Seoul to Incheon and Gyeonggi Provincn for work. A large number of commuters leave from south of the Hangang River such as Gangseo-gu (7%), Songpa-gu (7%), Guro-gu (7%) and Yangcheon-gu (6%) and commute to nearby municipalities such as Goyang-si (10%), Seongnam-si (10%), Bucheon-si (6%), Anyang-si (6%), Hanam-si (5%) and Suwon-si (4%) in Gyeonggi Privince.
Outflow commuters reside in the outskirts of Seoul and form a commuting network around the nearby municipalities of Incheon and Gyeonggi Province
There was a definite formation of commuting networks of the outflow commuters in the northwestern, southeastern and southwestern areas and a part of the network has formed around the northeastern area. Based on the descending order of the size of the commuting network, outflow commuters travel from Eunpyeong-gu ↔ Goyang-si (14,000), Songpa-gu ↔ Seongnam-si (13,000), Gangdong-gu ↔ Hanam-si (9,000), Jungnang-gu ↔ Guri-si (7,000), Gangnam-gu ↔ Seongnam-si (7,000), Guro-gu ↔ Gwangmyeong-si (7,000) and Bucheon-si (7,000) and Gangseo-gu ↔ Goyang-si (7,000).
While the commuters from Incheon and Gyeonggi Province to Seoul went to the major business centers of the city, commuters from Seoul commuted to the nearby municipalities of Incheon and Gyeonggi Province more evenly, except for the northeastern area.
Source : Statistics Korea, Korean Population Migration Statistics, each year
Source : Metropolitan Transportation Authority, Survey on Household Trips, 2010
3.3. Characteristics of Inflow and Outflow Commuters
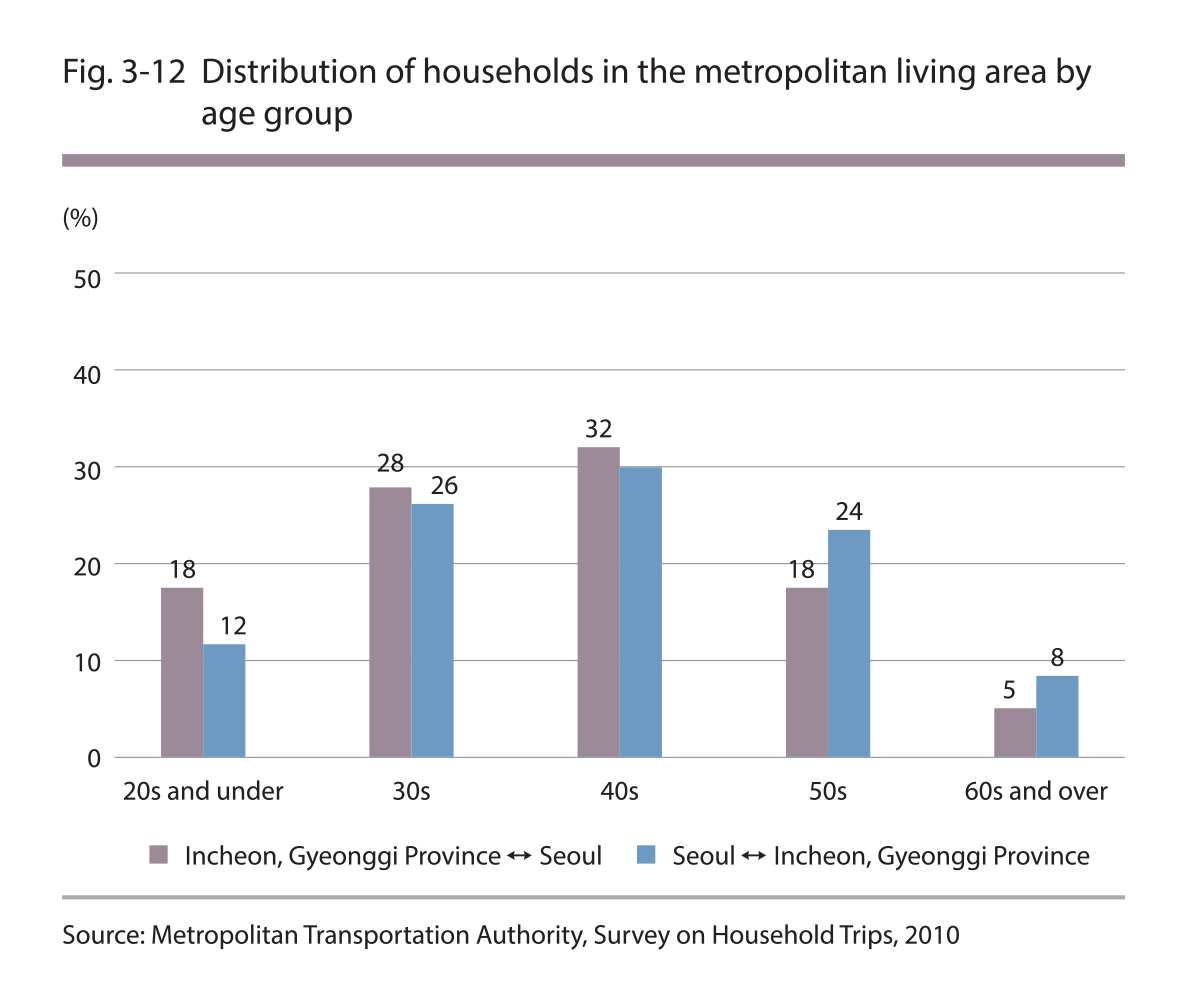
Most inflow commuters are in their 40s or younger and most outflow commuters are in their 50s or older
The majority of the inflow commuters from Incheon and Gyeonggi Province (Gyeongin) to Seoul were in their 40s (32%), followed by those in their 30s (28%), 20s (18%) and 50s (18%). On the other hand, the majority of the outflow commuters from Seoul to Incheon and Gyeonggi Province were in their 40s (30%), followed by those in their 30s (26%), 50s (24%) and 20s (12%). While a large number of inflow commuters are aged below the age of 40, a large number of outflow commuters are over the age of 50.
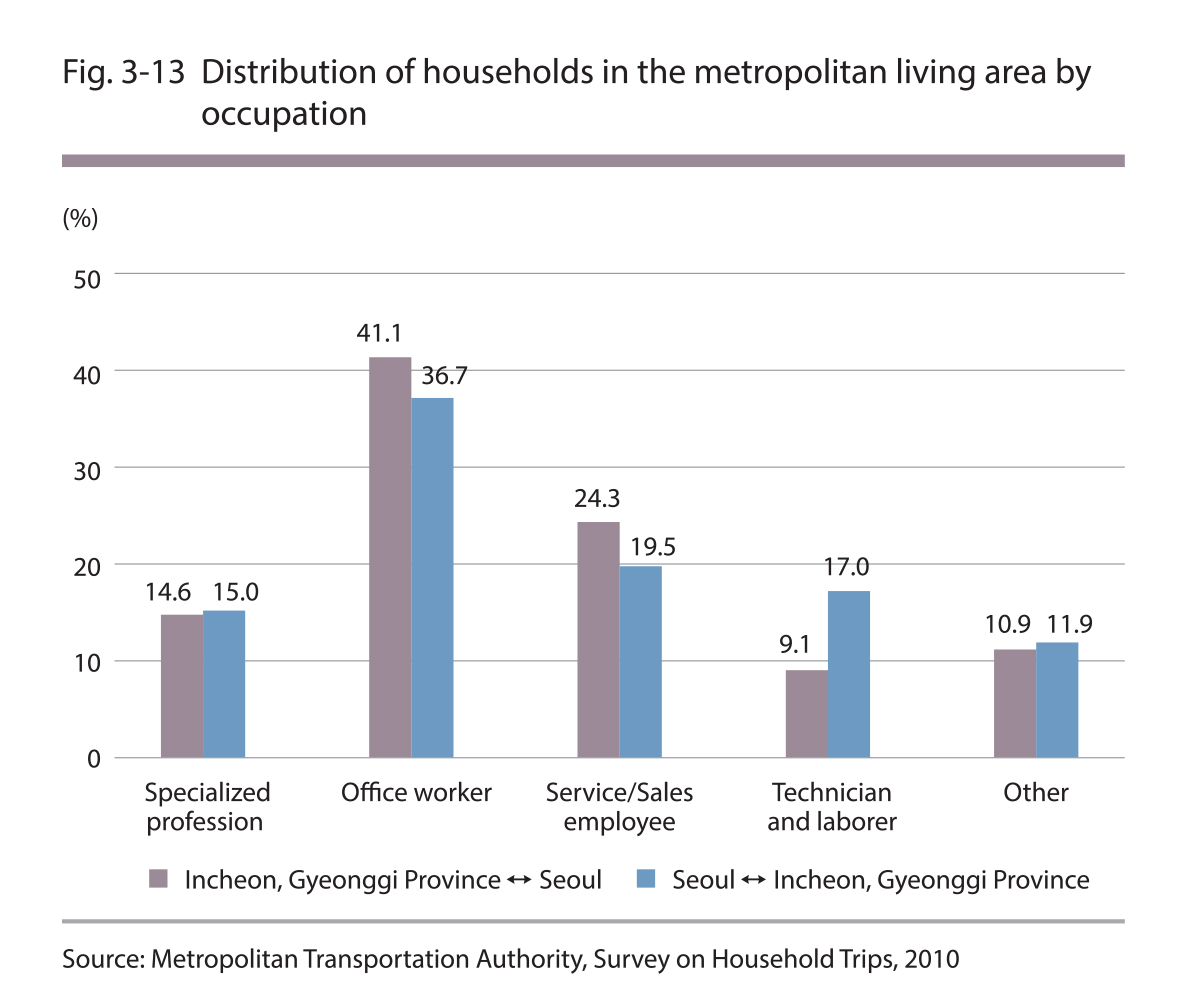
A large number of commuters are office workers and workers in the service and sales industries, and most outflow commuters are laborers
A large number of both the inflow and outflow commuters were found to be householders working in the office or in the service or sales industry. However, while the number of office workers and those working in the service and sales industries were higher among the inflow commuters, a relatively larger number of householders were technicians and laborers among the outflow commuters.
Source : Metropolitan Transportation Authority, Survey on Household Trips, 2010
Source : Metropolitan Transportation Authority, Survey on Household Trips, 2010