
-
Housing
Housing in Seoul
-
1. Housing Stock
1.1. Stock by Housing Type
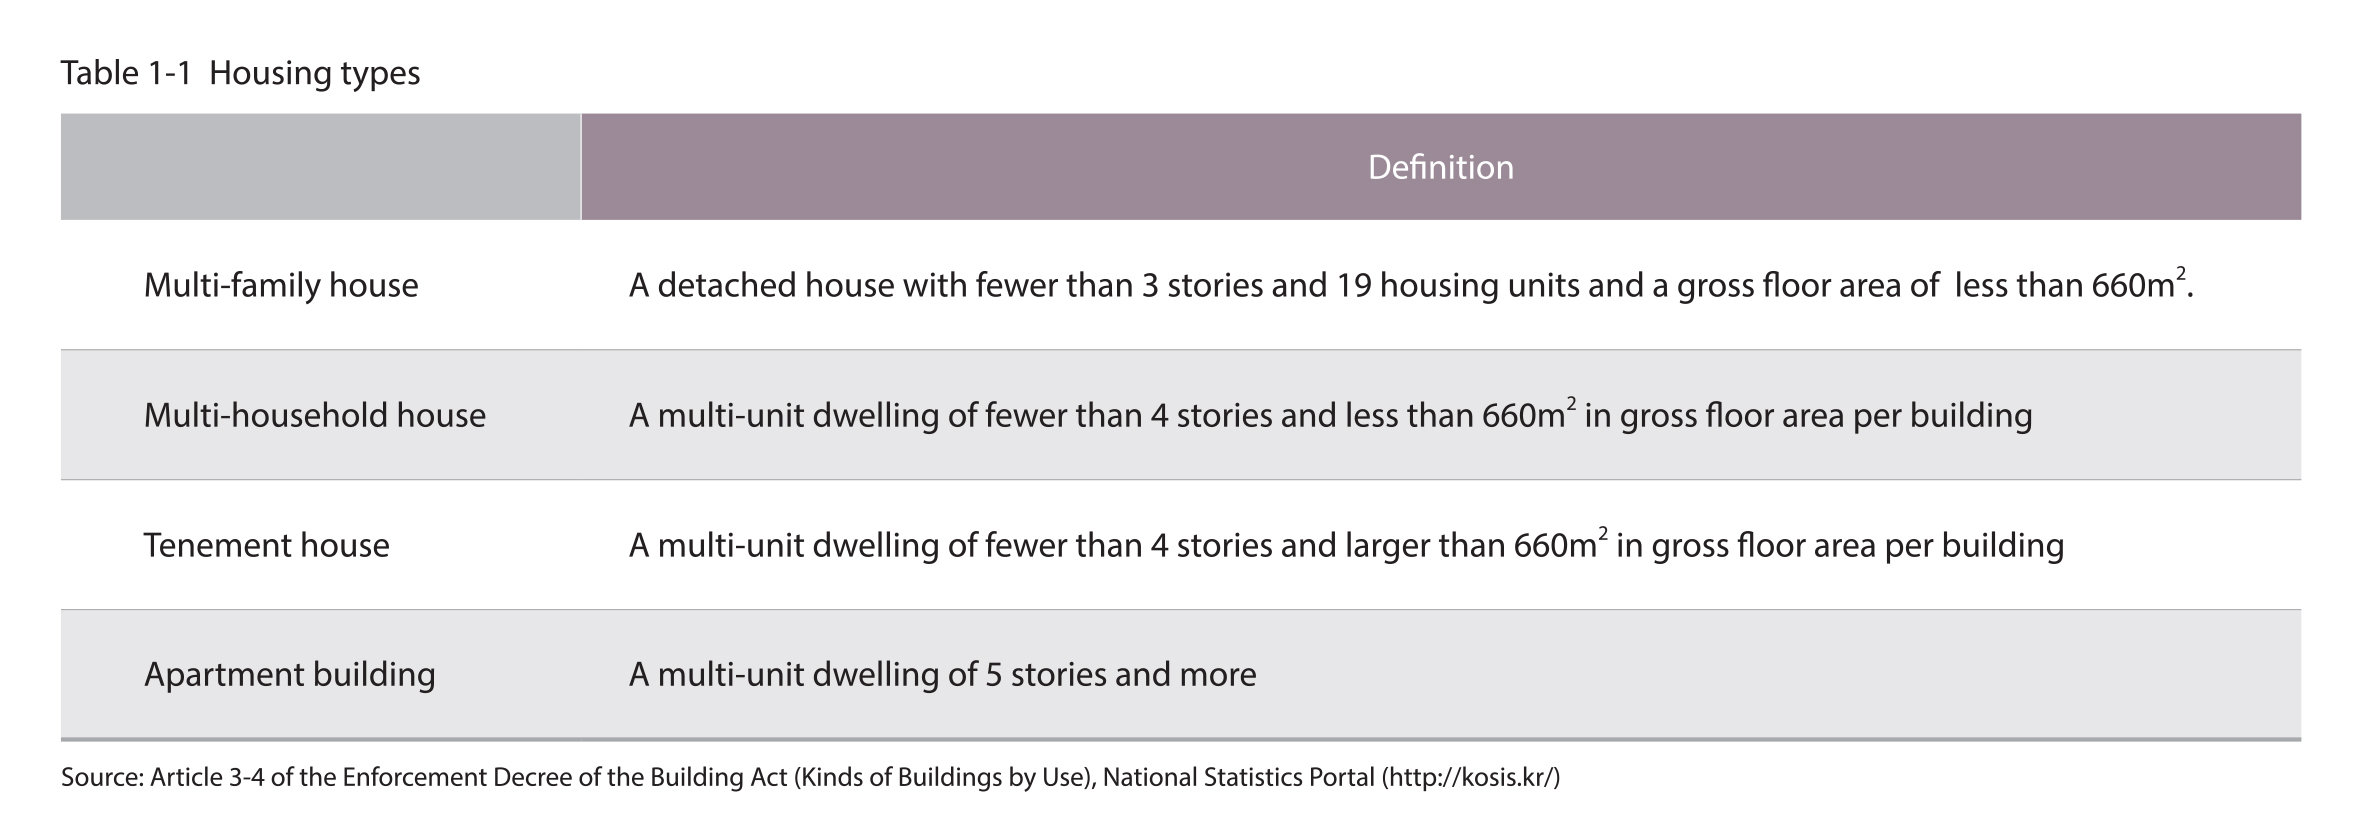
Classification of housing types
The housing types in Seoul are largely divided into detached houses and multi-unit dwellings. Detached houses are further divided into general detached houses in the form of an isolated residential area and multi-family houses in which multiple families can live. A multi-family house is defined as a detached house with fewer than 3 stories and 19 housing units and a gross floor area of less than 660㎡. On the other hand, multi-unit dwellings are sub-divided into multi-household houses, tenement houses and apartment buildings. A multi-household house is a multi-unit dwelling of fewer than 4 stories and less than 660㎡ in gross floor area, while a tenement house is a multi-unit dwelling of fewer than 4 stories and larger than 660㎡ in gross floor area. An apartment building is a multi-unit dwelling of 5 stories and more.
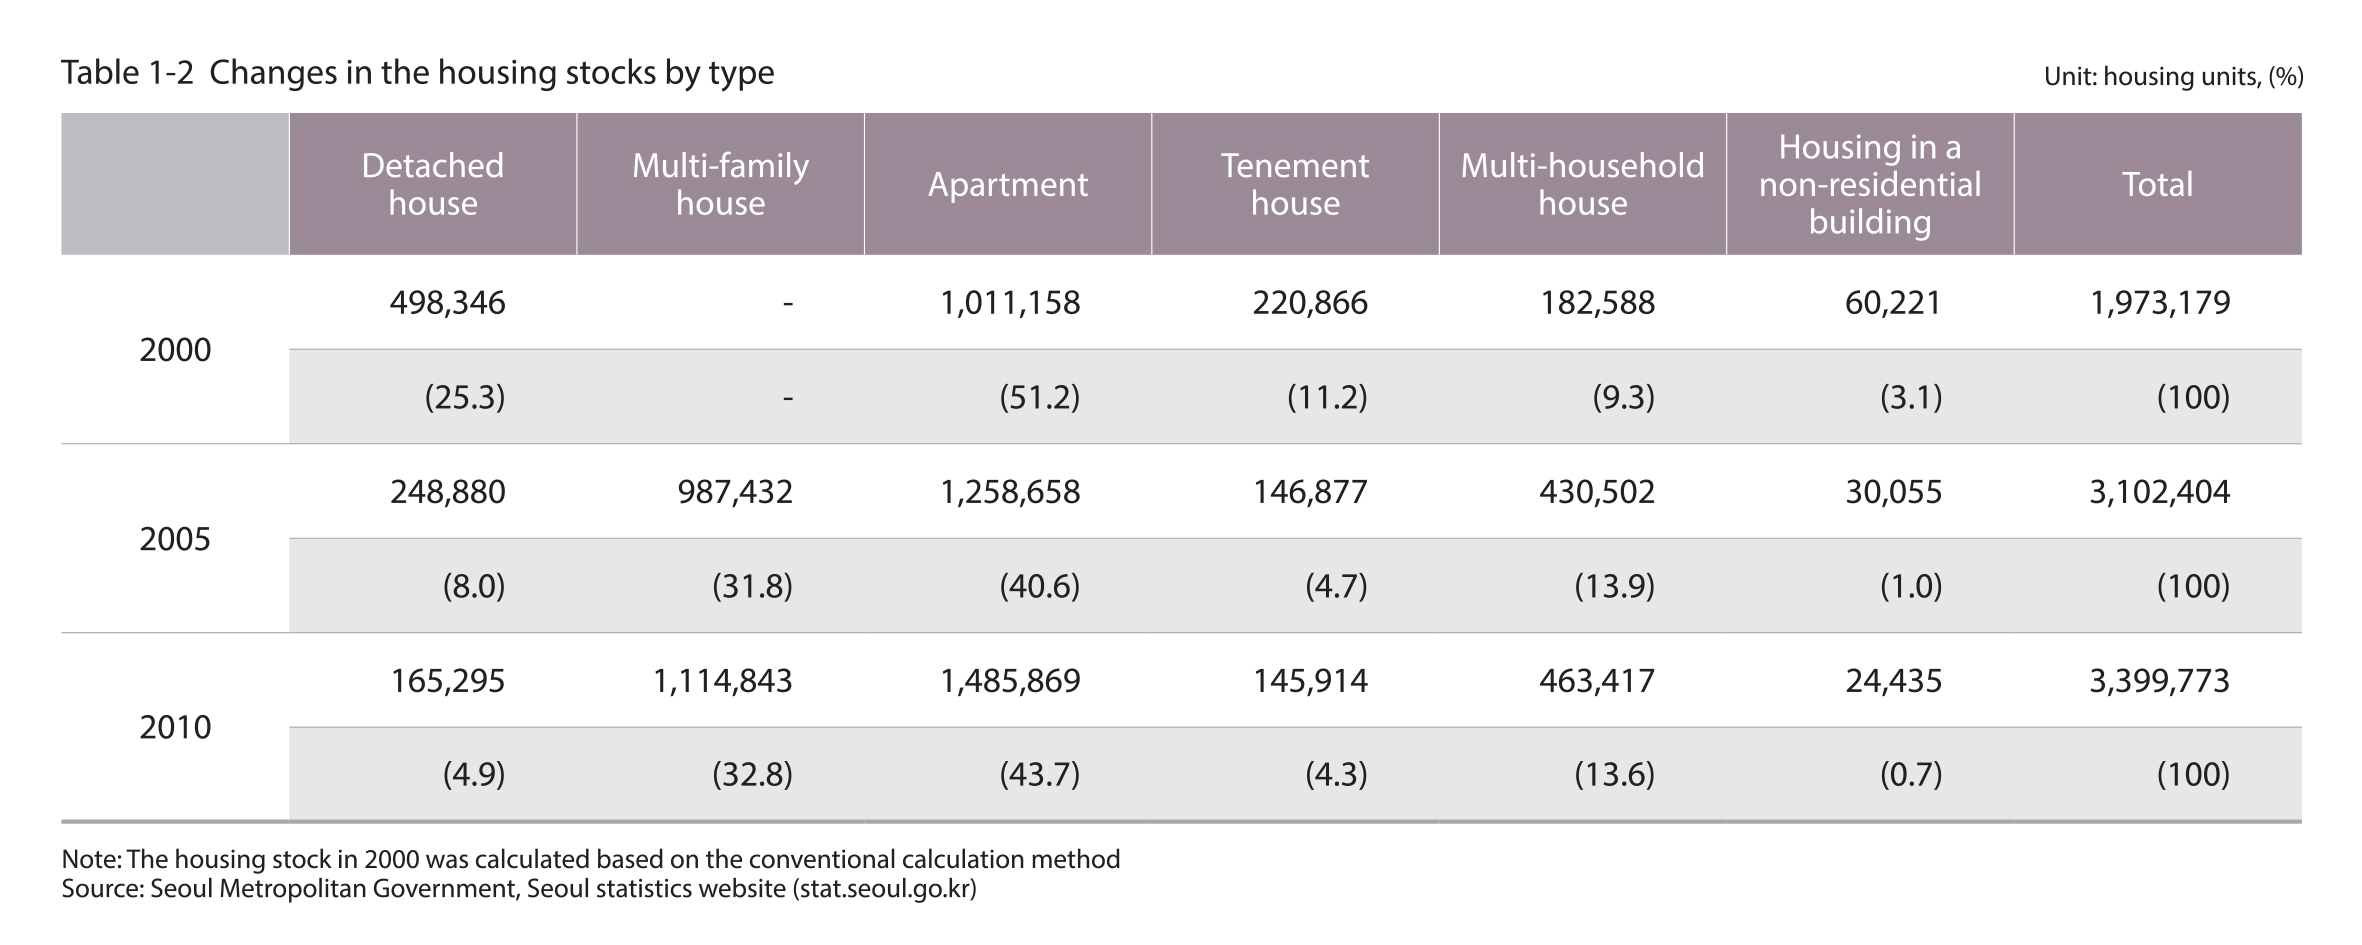
The housing stock in Seoul as of 2010 is 3.4 million, with apartments accounting for 43.7%
The housing stock in Seoul as of 2010 is nearly 3.4 million. The most common housing type is apartment, which accounts for 43.7% of the total housing stock at 1,486,000 units, followed by multi-family houses at 32.8% (1,114,000 units) and multi-household houses at 13.6% (463,000 units). The housing stock in Seoul increased by 200,000 units from 2005 to 2010. Although the apartment and multi-household house stocks are growing, the detached and multi-family house stocks are declining.
Source : Article 3-4 of the Enforcement Decree of the Building Act (Kinds of Buildings by Use), National Statistics Portal (https://kosis.kr/)
1.2. Housing Supply Rate
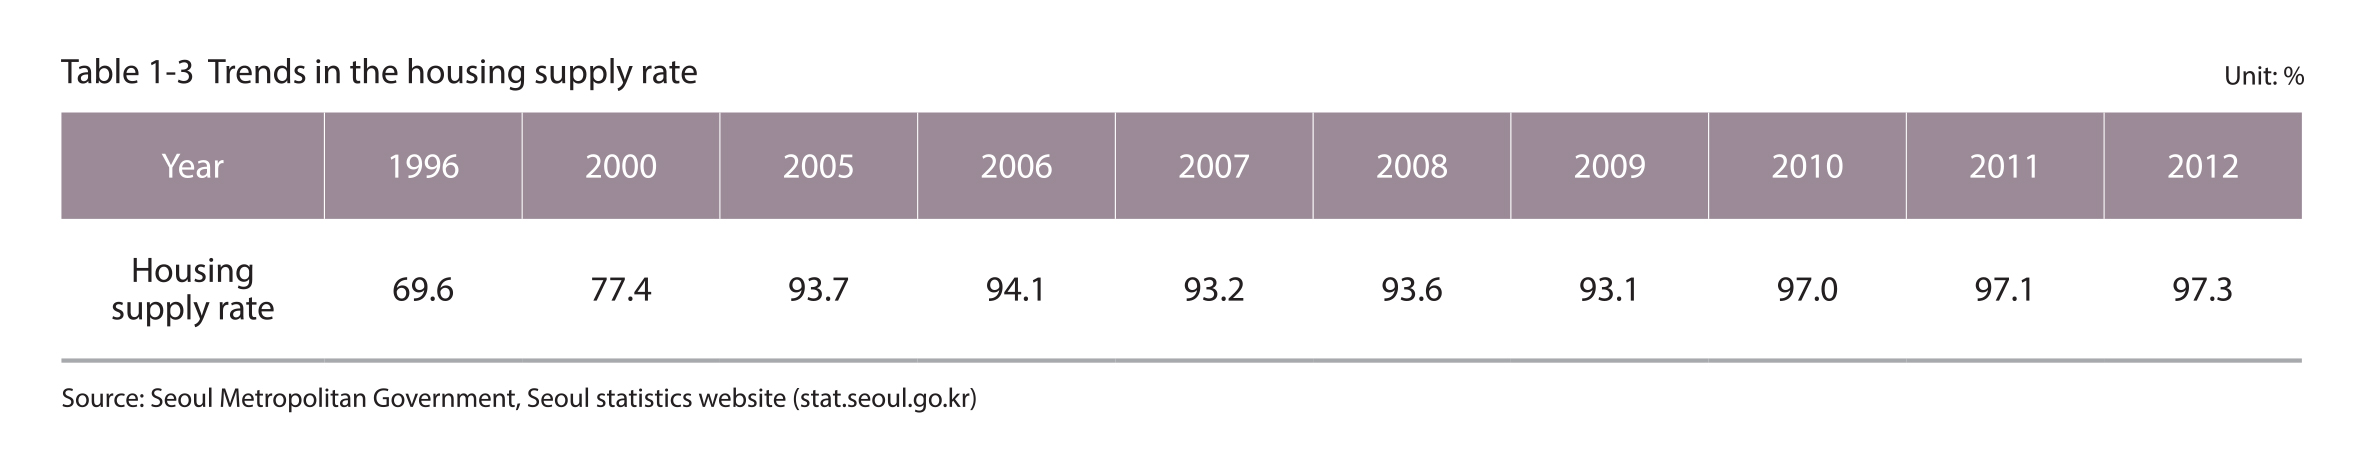
The housing supply rate in Seoul was 97.3%
The housing supply rate in Seoul was 97.3% in 2012. There was a dramatic increase in the housing supply rate in Seoul from 77.4% in 2000 to 93.7% in 2005, and this is attributed to the use of a revised method of calculating the housing supply rate since 2005. To be more specific, each unit of the multi-family houses is now included in the calculation, and this method of calculation has increased the total number of housing units.
Source : Seoul Metropolitan Government, Seoul Statistics website (stat.seoul.go.kr)
Source : Seoul Metropolitan Government, Seoul Statistics website (stat.seoul.go.kr)
1.3. Building Age
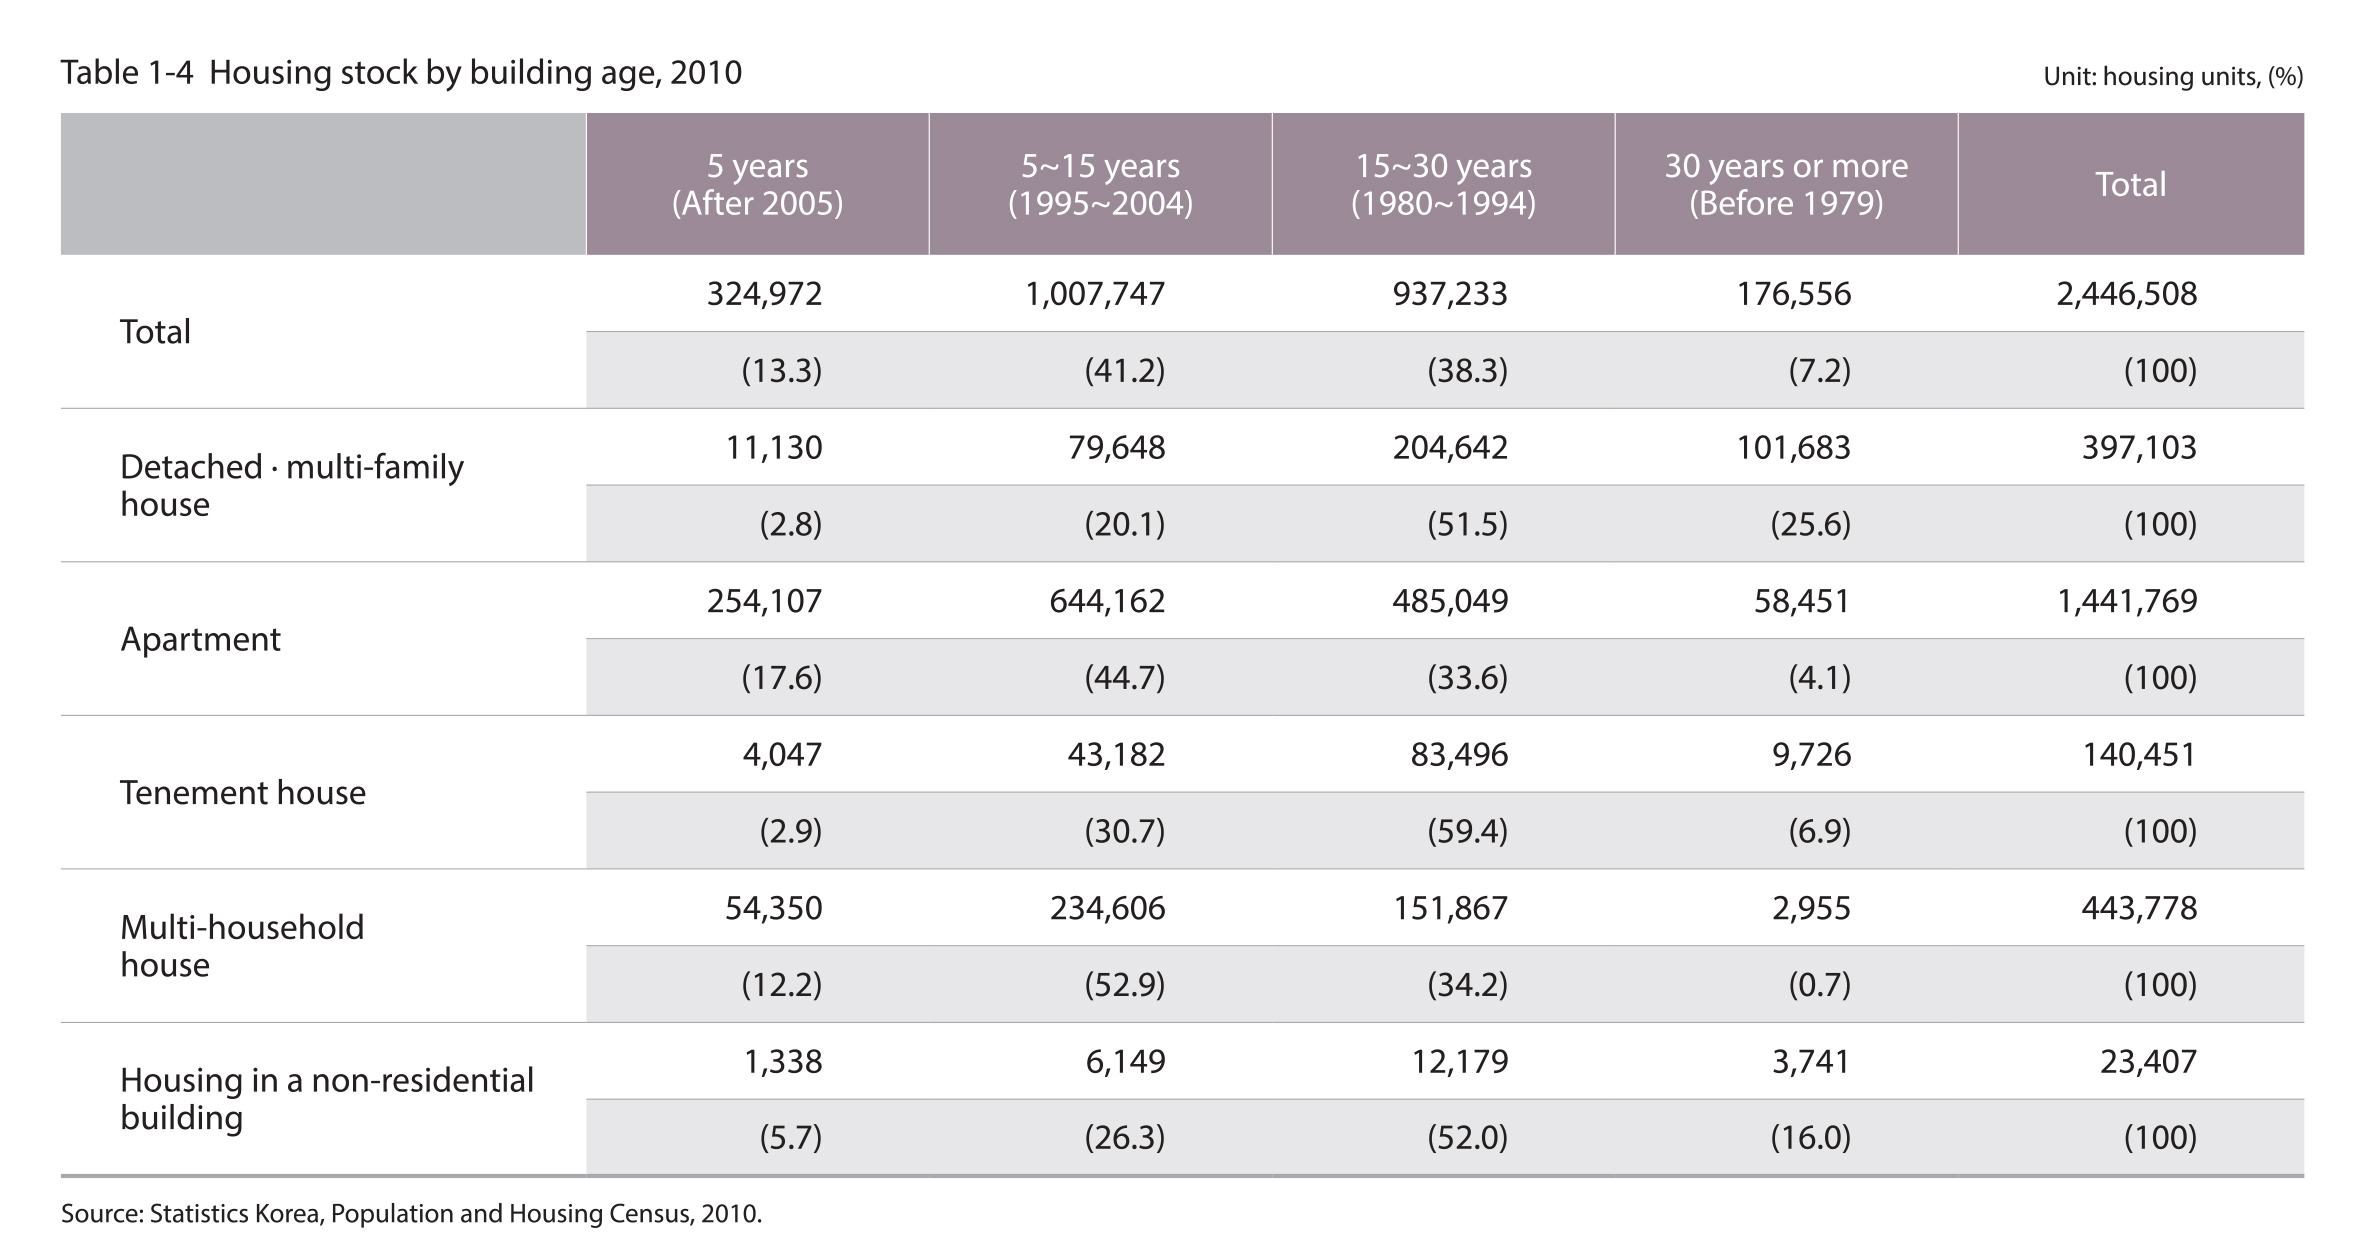
7% of all houses are over 30 years old and 46% are over 15 years old
As of 2010, of the 2,447,000 housing units in the housing stock of Seoul, those that are over 30 years of building age account for 7% of the tota1 number of houses and those that are over 15 years of building age account for 46% (1,114,000).
The building age of the detached and multi-family houses tended to be higher than other housing types. For instance, 26% of the detached and multi-family houses were over 30 years old, and 77% were over 15 years old. In the case of tenement houses, they were relatively older compared to the apartments and multi-household houses, and 66% of tenement houses were built at least 15 years ago.
Source : Statistics Korea, Population and Housing Census, 2010.
1.4. Public Rental Housing
165,000 public rental housing units in stock accounting for 5% of the total housing stock
As of 2010, there are 165,000 public rental housing units in stock in Seoul, and this accounts for 596 of the total housing stock. The number of rental houses approved for construction in Seoul between 2001 and 2012 was 74,000, with about 6,000 units being approved annually on average. The number of rental houses approved for construction in the Seoul Metropolitan Area was 540,000, with about 45,000 units being approved annually on average.
The public rental housing supply rate in Seoul and the Seoul Metropolitan Area grew until 2007 and fell thereafter. The public rental housing supply rate reached its peak at 13,000 in 2005 in Seoul and at 72,000 in 2007 in the Seoul Metropolitan Area. The average supply ratio of public rental housing to the total housing units was 10% in Seoul and 17% in the Seoul Metropolitan Area between 2001 and 2012.
.jpg)
Source : Ministry of Land, Infrastructure, and Transport - Housing Construction Performance by Year and Sector
2. Housing Supply
2.1. Supply by Housing Type
83,000 new housing units supplied annually while depending on the economic situation
The new housing supply in Seoul as of 2012 was about 89,000 units (calculation based on the number of households). The new housing supply in Seoul decreased from 2002 to 2006, but began increasing in 2009. As for the Seoul Metropolitan Area, the new housing supply decreased following the supply of some 170,000 housing units in 2002, but it has been slightly increasing since 2009.
The ratio of apartments to the new housing supply decreased from 80% to 48%
The ratio of apartments to the new housing supply in Seoul, which had been 30% in 2001, increased significantly until the mid-2000s and reached 84% by 2005. However, it gradually decreased thereafter to about 50%. On the other hand, the ratio of apartments to the new housing supply in the Seoul Metropolitan Area increased from 31% in 2001 to 89% in 2005, but it has since been declining to about 56% by 2012. The reason for the increase in the percentage of multi-household and tenement house supply and the decrease in the percentage of apartments is the increased supply of a new housing type that is literally called, "urban-type housing"
.jpg)
Source : Ministry of Land, lnfrastructure, and Transport - Housing Construction Performance by Year
.jpg)
Source : Ministry of Land, Infrastructure, and Transport - Housing Construction Performance by Year
2.2. Supply by Housing Size
Dramatic increase in supply of housing units of 60㎡ in floor area and smaller in 2012
In 2012, 59,000 small-sized housing units of 60㎡ in floor area and smaller were newly supplied in Seoul, and this accounted for 69% of total housing supply in the city. On the other hand, about 17,000 medium-sized housing units of 60~85㎡ in floor area and 10,000 large-sized housing units of 85㎡ and bigger were supplied, and they accounted for 19% and 12% of the total housing supply, respectively.
In Seoul, the ratio of small-sized housing supply to the total housing supply was 31% in 2001, and it steadily increased to 69% by 2012, whereas the ratio of the large-sized housing supply to the total housing supply decreased from 20% to 12% during the same time period. The ratio of the medium-sized housing supply to the total housing supply remained steady in the 40% range until 2009, but it was greatly reduced following the year 2009 and it reached 19% in 2012. As for the Seoul Metropolitan Area, while the supply of small-sized housing has increased significantly since 2009, the ratio of medium and large-sized housing supply to the total housing supply has continually dropped from 34% in 2007 to 14% in 2012.
.jpg)
Source : Ministry of Land, Infrastructure, and Transport - Housing Construction Performance by Year and Type
3. Housing Price Trends
3.1. Housing Sales Prices
Housing sales prices have doubled between 2001 and 2013, but remained stagnant since the 2008 financial crisis
The housing sales price index doubled from January 2001 to March 2013. The housing sales prices continually climbed up until the 2008 financial crisis, but remained stagnant before taking a downturn in December 2009.
In terms of the housing size, the housing sales price index of large-sized housing units has been declining, while that of small-sized housing units increased slightly after 2008. This is because the increase rate was smaller and the decrease rate was larger for the large-sized housing, while the opposite was true for small-sized housing.
.jpg)
Source : Kookmin Bank, house price Index time series, 2013.6.
.jpg)
Source : Kookmin Bank, house price Index time series, 2013.6.
3.2. Jeonse* Prices
The Jeonse prices have continually increased, especially for apartments and small- and medium-sized housing units
The Jeonse price index in Seoul has steadily increased between 2001 and March 2013, except for a 2-year period between 2003 and 2005. In terms of housing size, the month-on-month increase rate was comparatively higher for small- and medium-size housing units than the large-sized housing units. Since 2012, the rate of the Jeonse price increase has been similar, regardless of the housing size.
*Jeonse is a process unique to South Korea's rental system. It does not involve monthly rent payments, instead tenants provide the landlord with a deposit based on the value of the property as an investment during the lease. The property owners keep the returns on the investment and repay the principle deposit once the lease comes to an end.
.jpg)
Source : Kookmin Bank, house price Index time series, 2013.6.
.jpg)
Source : Kookmin Bank, house price Index time series, 2013.6.
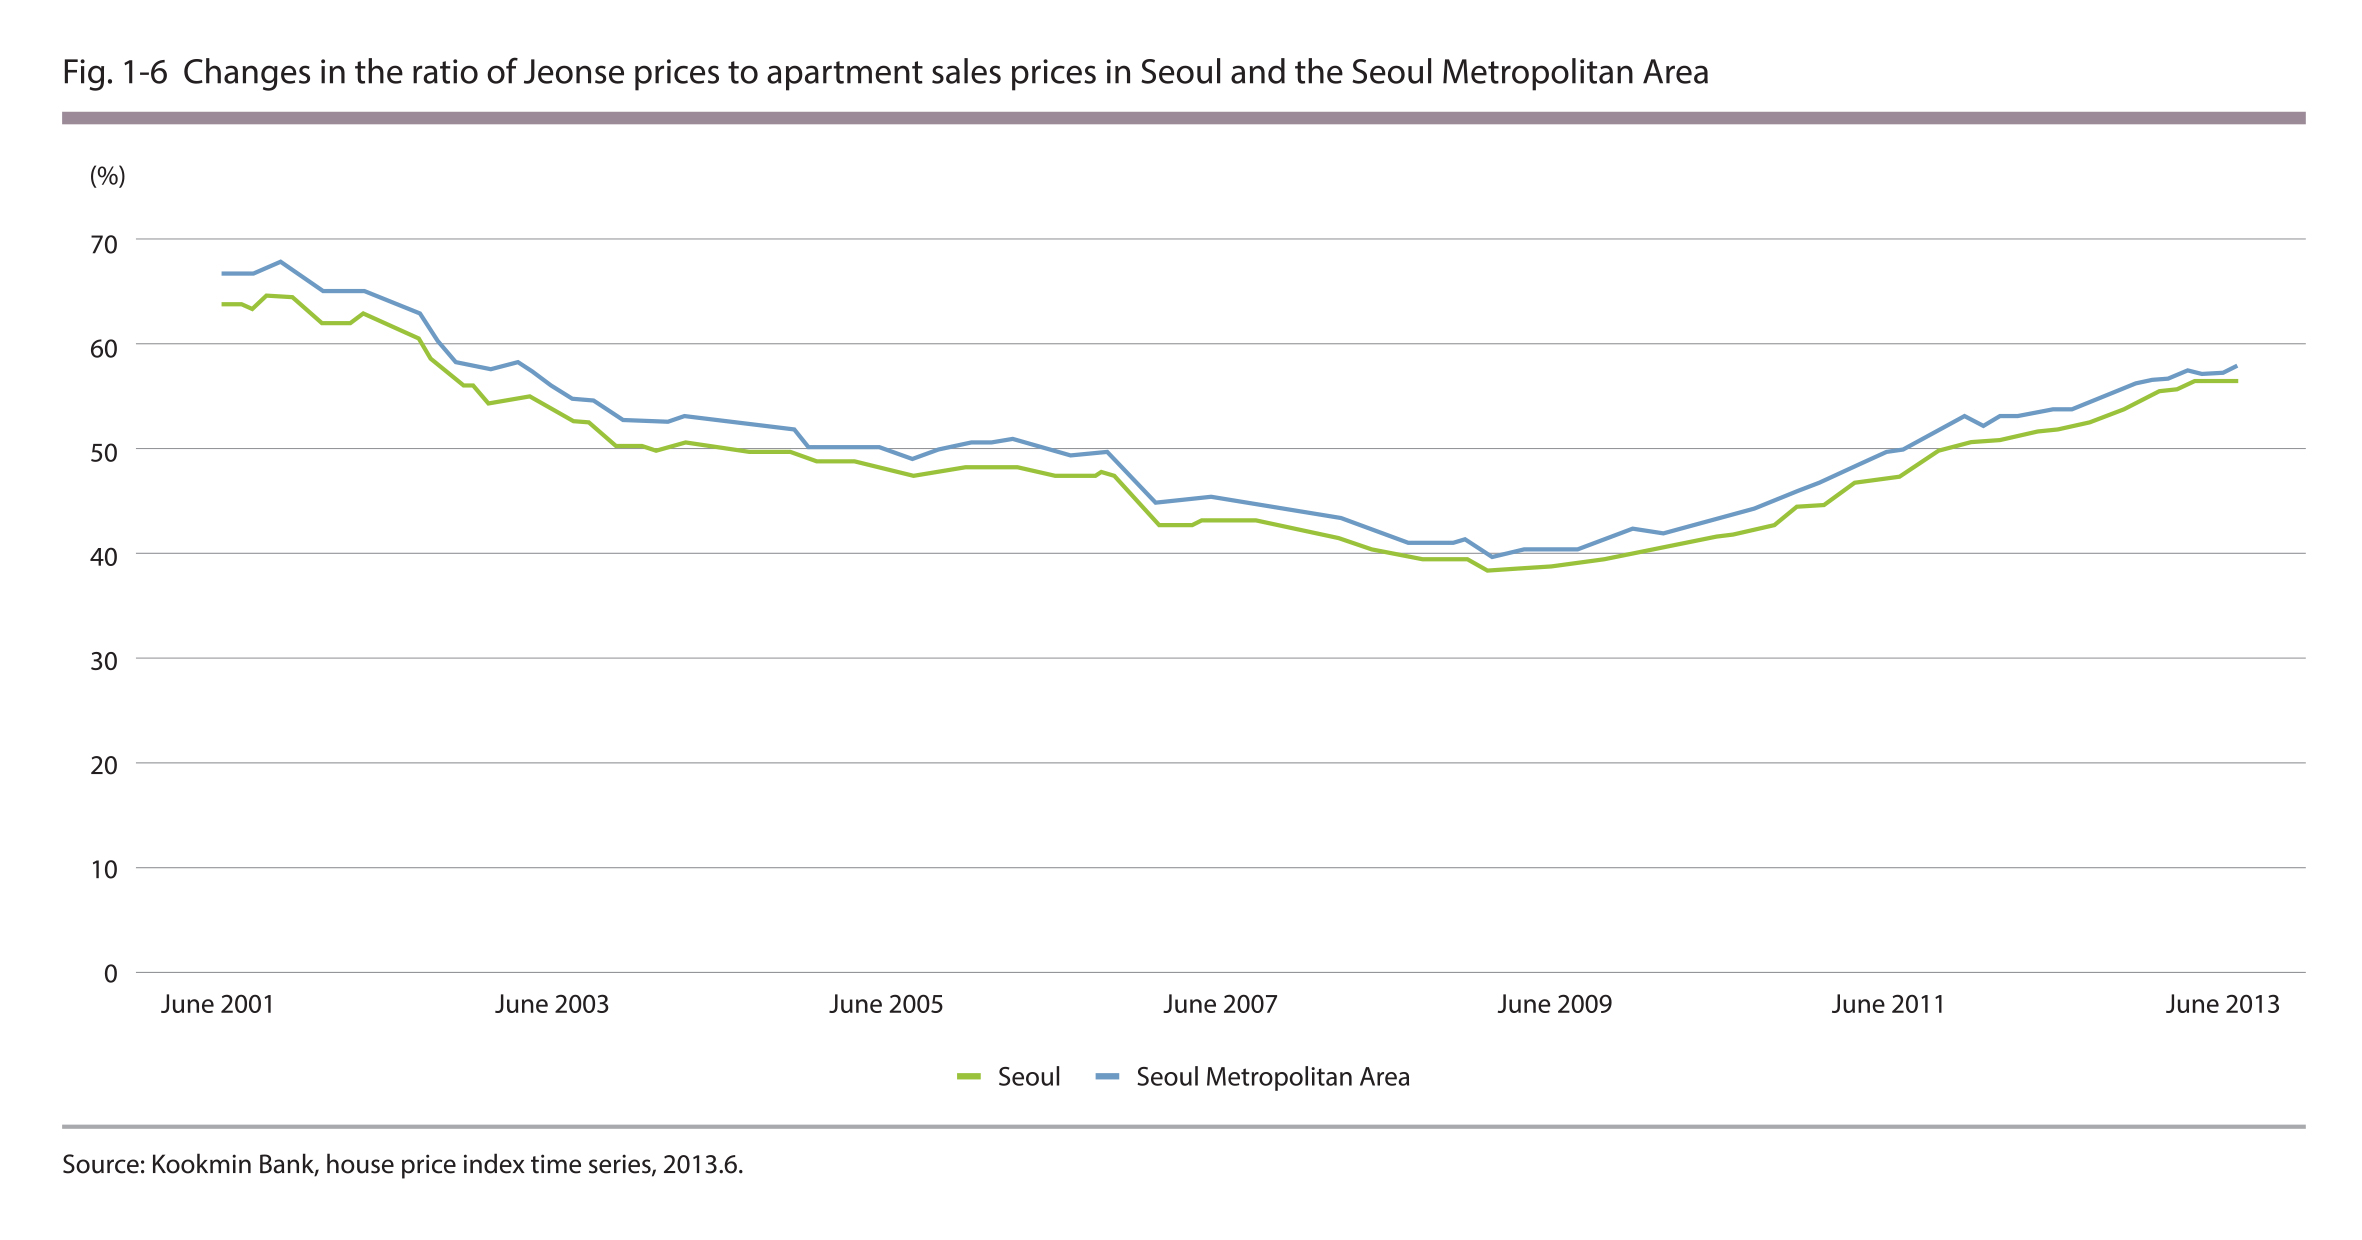
3.3. Ratio of Jeonse Prices to Housing Sales Prices
The ratio of Jeonse prices to housing sales prices in Seoul, on the rise since 2009 to 54.5% in 2013
In June 2013, the ratio of Jeonse prices to housing sales prices was recorded at 58.6% on average for the nation, 54.5% for Seoul and 54.8% for the Seoul Metropolitan Area. In terms of the housing type, the ratio of Jeonse prices to housing sales prices on average was 58.0% for tenement houses, 56.7% for apartments and 40.9% for detached houses.
The ratio of Jeonse prices to apartment sales prices on average in Seoul decreased for 64.0% in June 2001 to 38.9% in June 2009, but it has been increasing since then and reached 56.7% in June 2013. The ratio of Jeonse prices to apartment sales prices on average in the Seoul Metropolitan Area showed similar tendencies as that of Seoul, and it reached 57.8% in June 2013. For reference purposes, the ratio of Jeonse prices to apartment sales prices on average in the nation is 63.7% as of June 2013.
Source : Kookmin Bank, house price Index time series, 2013.6.
.jpg)
.jpg)