-
Transportation
Sustainable Transportation
-
1. Walking
1.1. Length and Area of Sidewalks
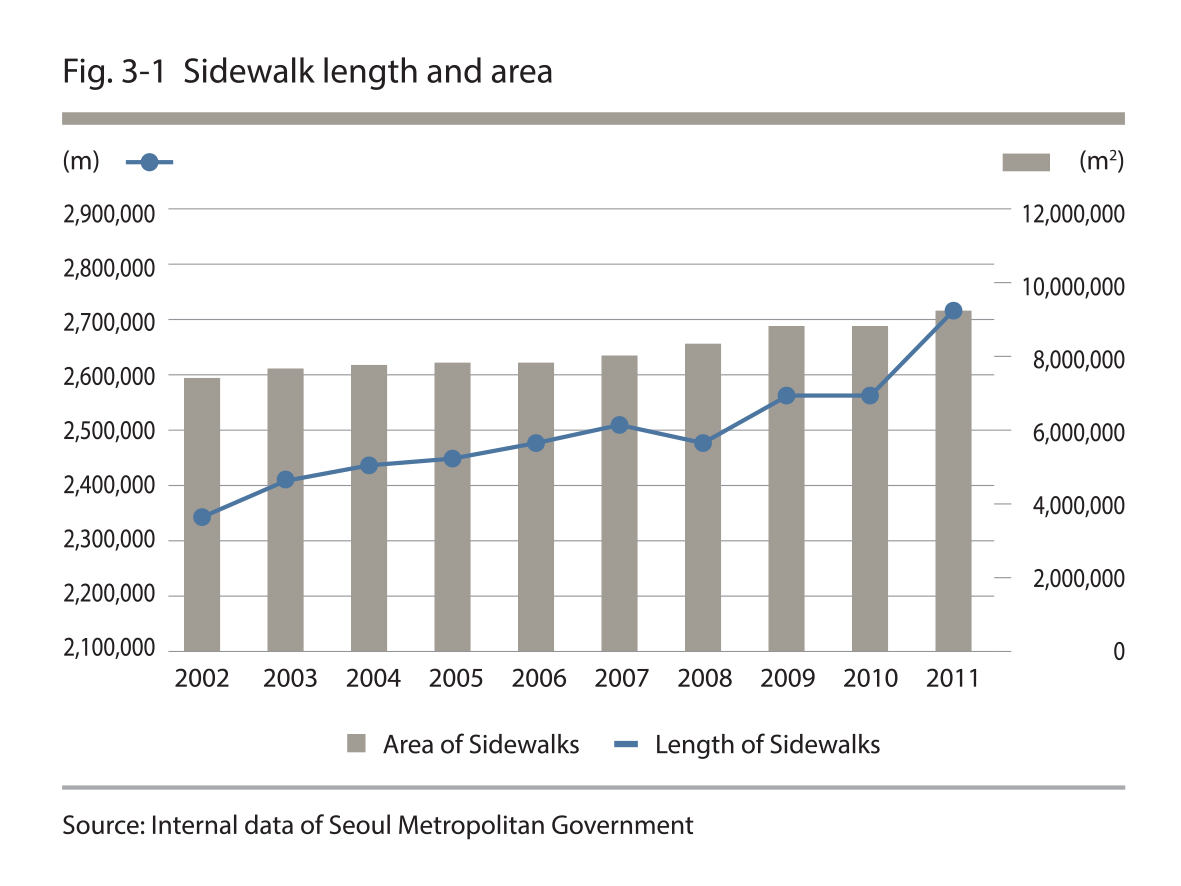
The sidewalks in Seoul extended 2,789km in distance and were 10,249,537㎡ in area in 2011
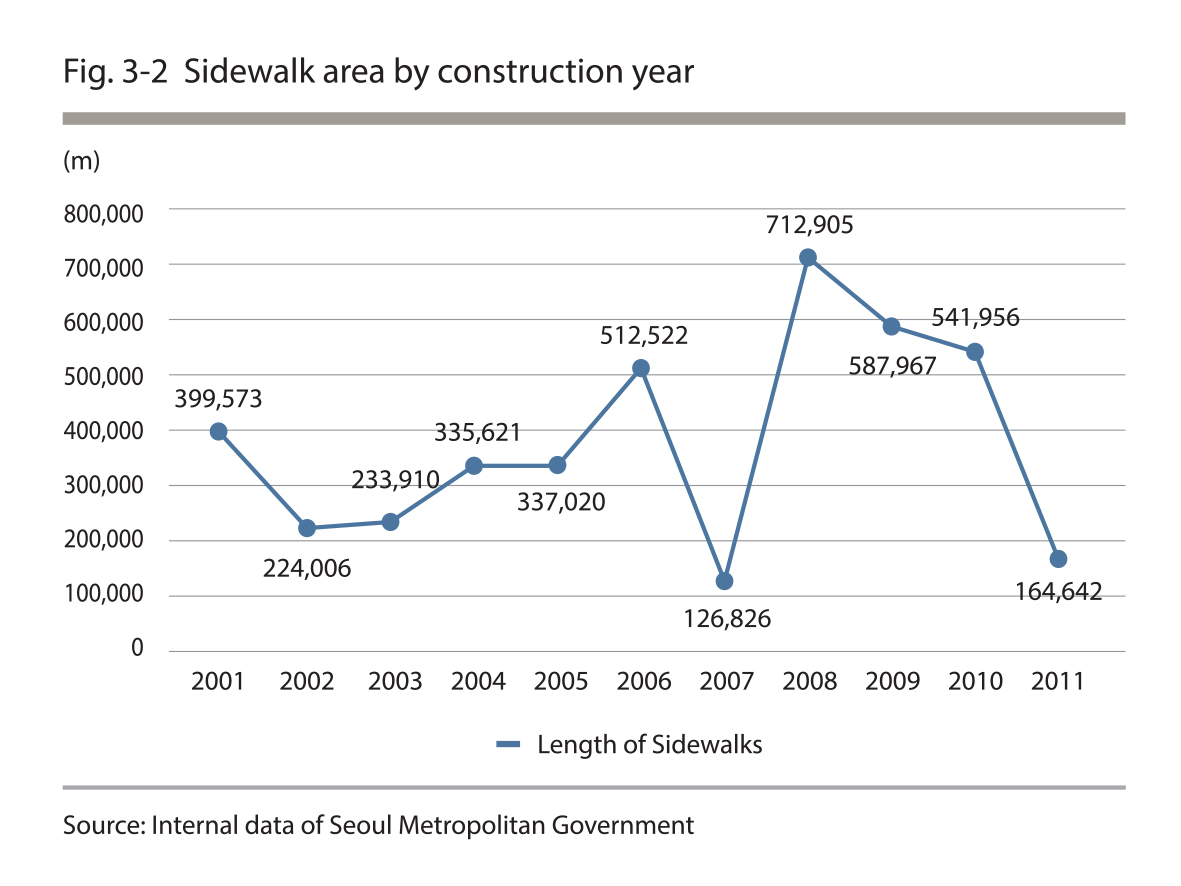
The sidewalks (i.e. pedestrian paths) in Seoul in 2011 extended 2,788,619m in distance, which was 413,860m longer than in 2002, and they were 10,249,537㎡ in total area, which was 2,087,520㎡ larger than in 2002. There was a significant decline in sidewalk construction starting in 2000. Sidewalk construction work increased substantially with a large-scale sidewalk improvement project implemented in 2008, but it has been gradually declining ever since.
Source : Internal data of Seoul Metropolitan Government
Source : Internal data of Seoul Metropolitan Government
Source : Internal data of Seoul Metropolitan Government
Source : Internal data of Seoul Metropolitan Government
1.2. Road Crossing Facilities
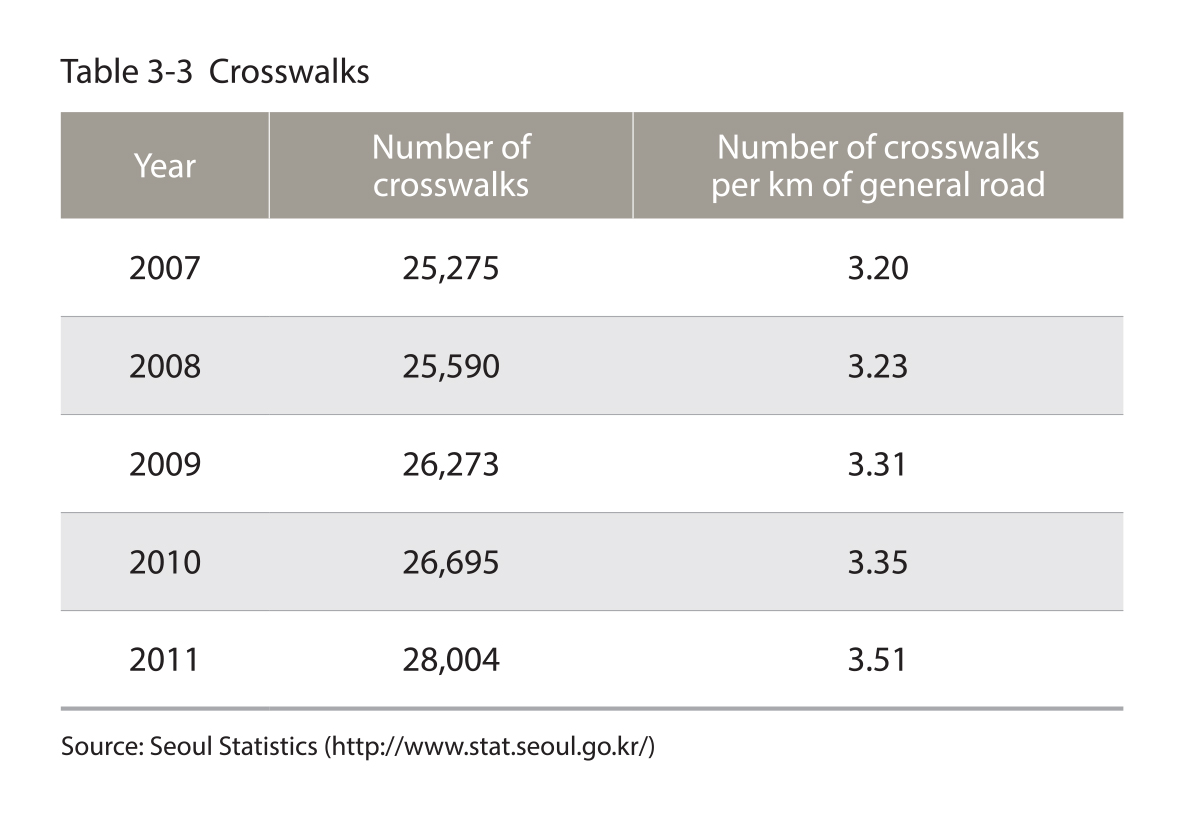
A total of 28,004 crosswalks, with 3.51 crosswalks for every kilometer of general road
As of 2011, there are 28,004 crosswalks and 3.51 crosswalks for every kilometer of general road with an estimated interval of 285m between the crosswalks in Seoul.
Source : Seoul Statistics (http://www.stat.seoul.go.kr/)
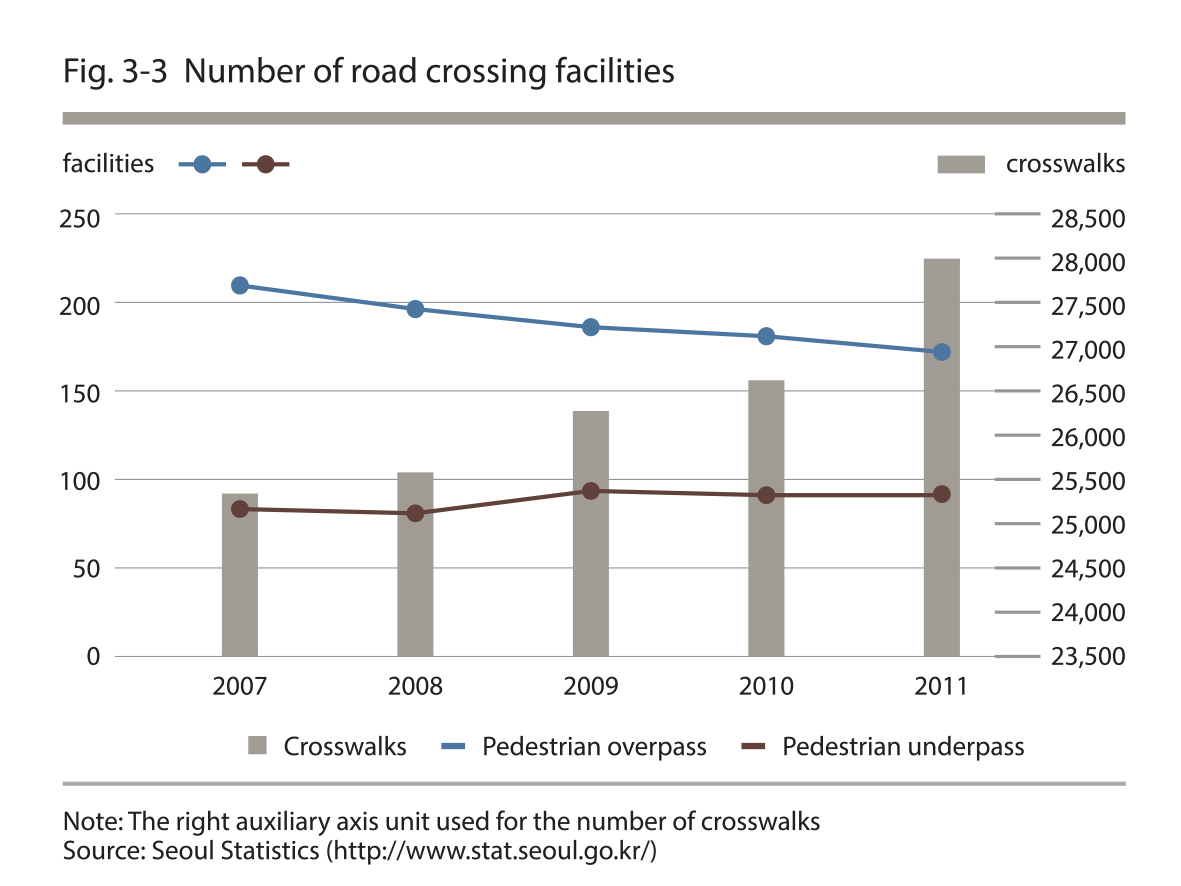
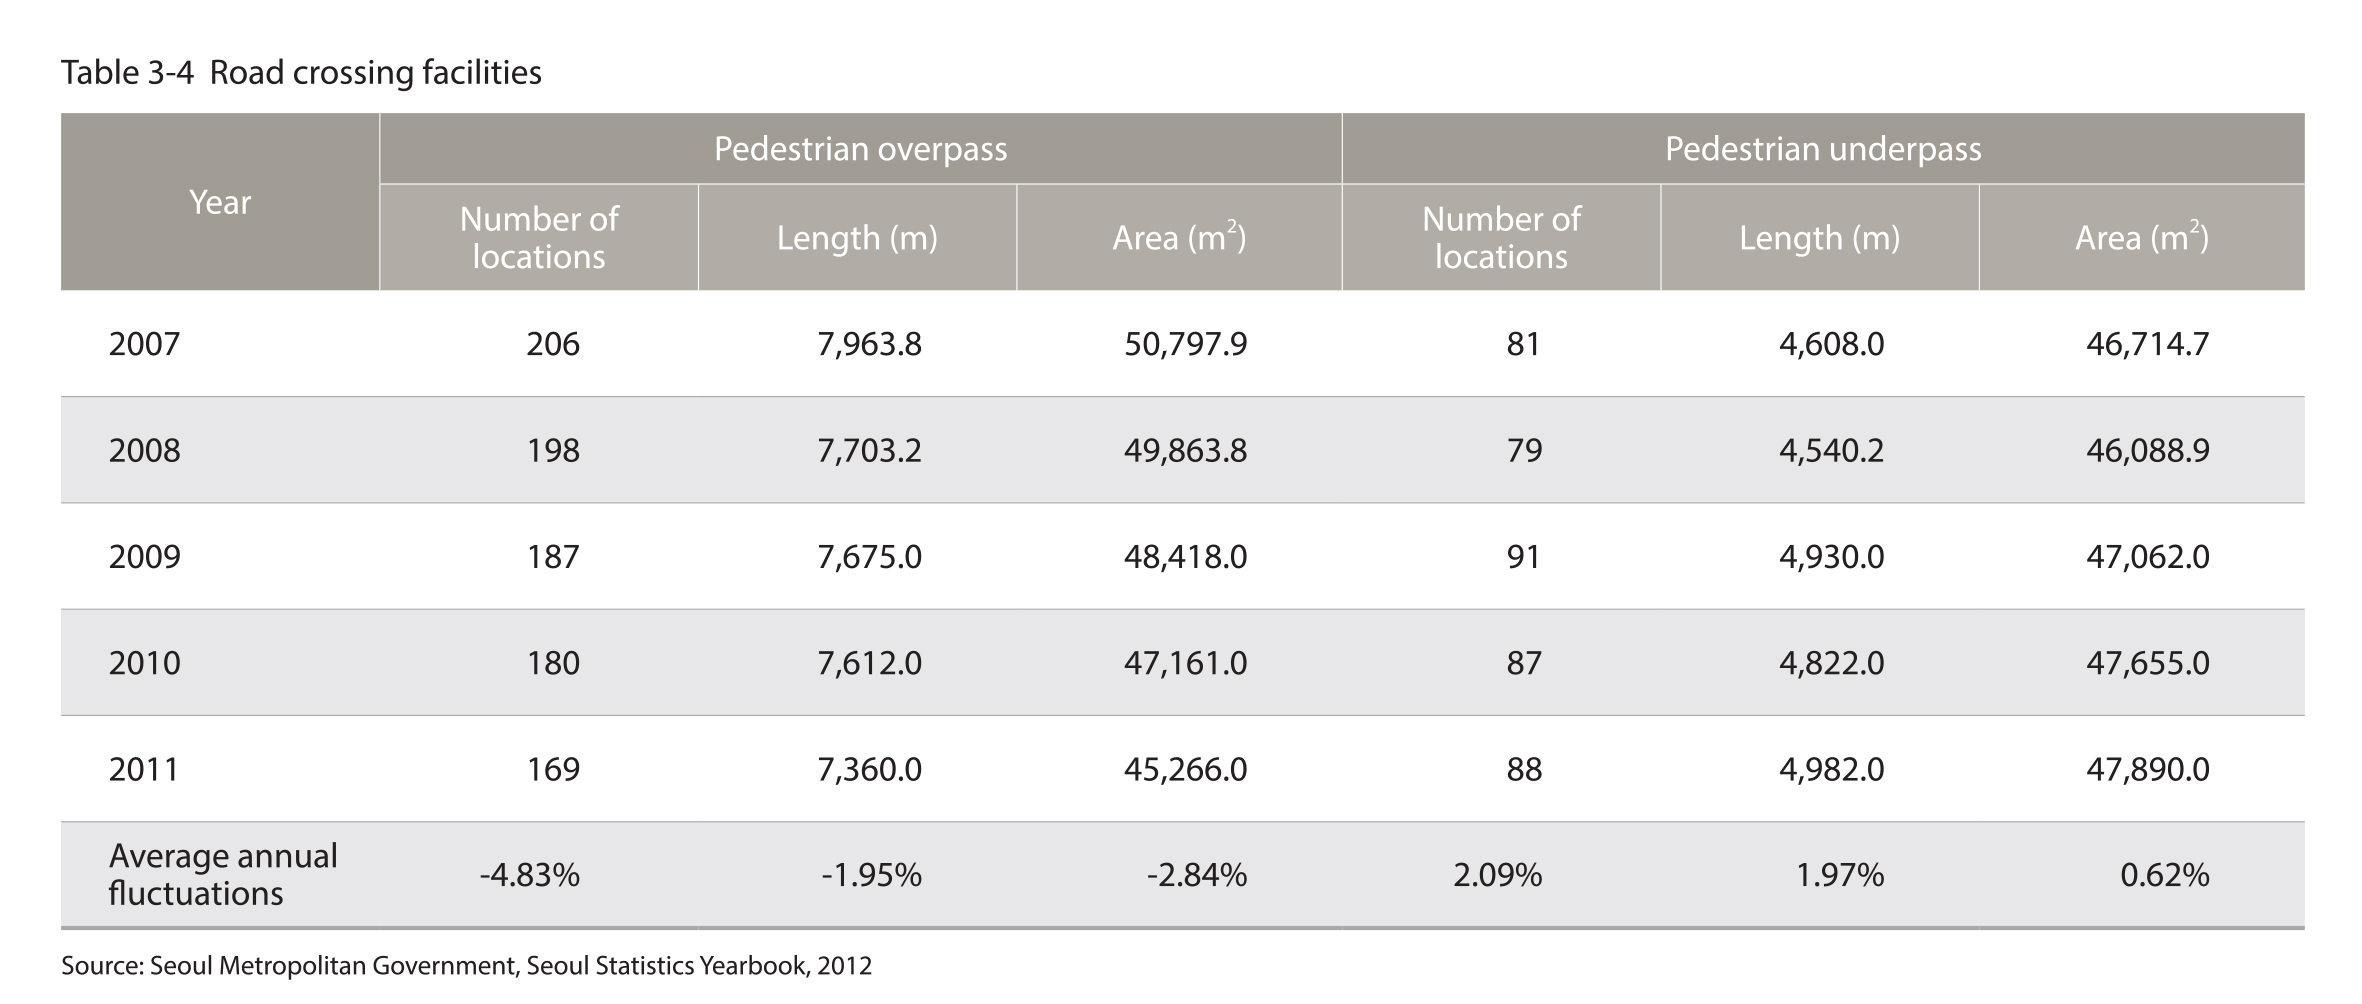
169 pedestrian overpasses and 88 pedestrian underpasses in Seoul as of 2011
As of 2011, there are 169 pedestrian overpasses and 88 pedestrian underpasses in Seoul. The length of pedestrian overpasses has been decreasing at an average annual rate of 1.95% since 2007, while the length of pedestrian underpasses has been increasing at an average annual rate of 1.97%.
Source : Seoul Statistics (http://www.stat.seoul.go.kr/)
Source : Seoul Metropolitan Government, Seoul Statistics Yearbook 2012
2. Bicycling
2.1. Bicycle Paths and Facilities
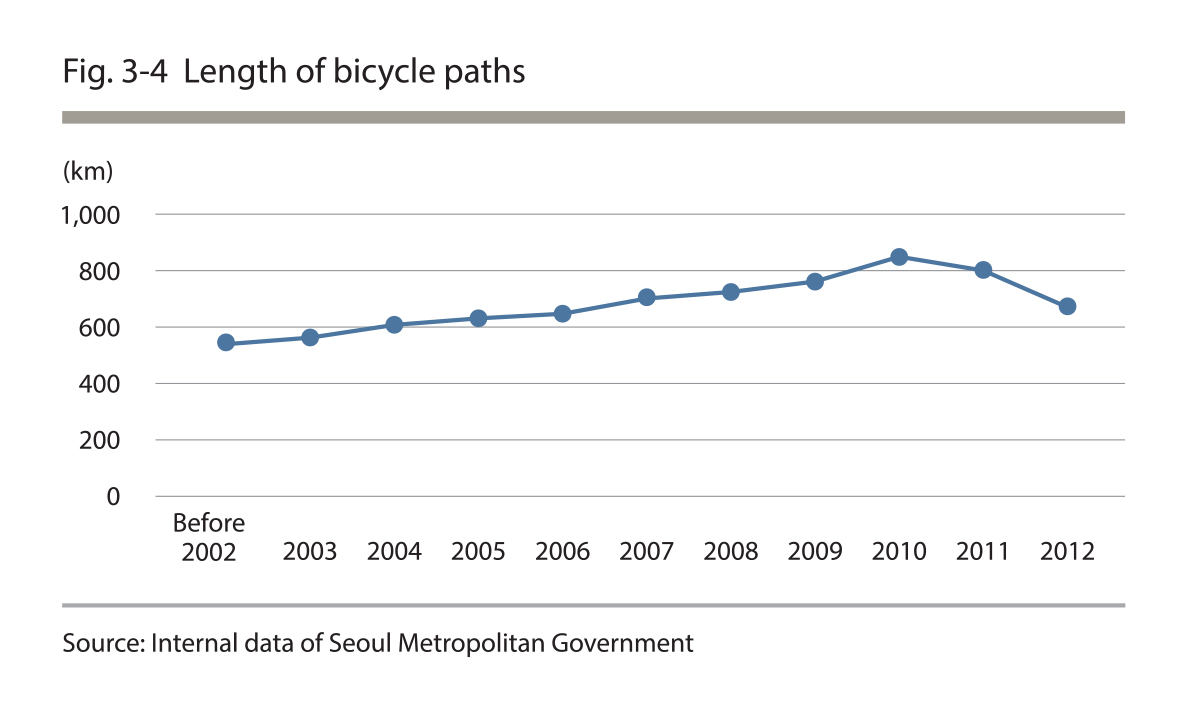
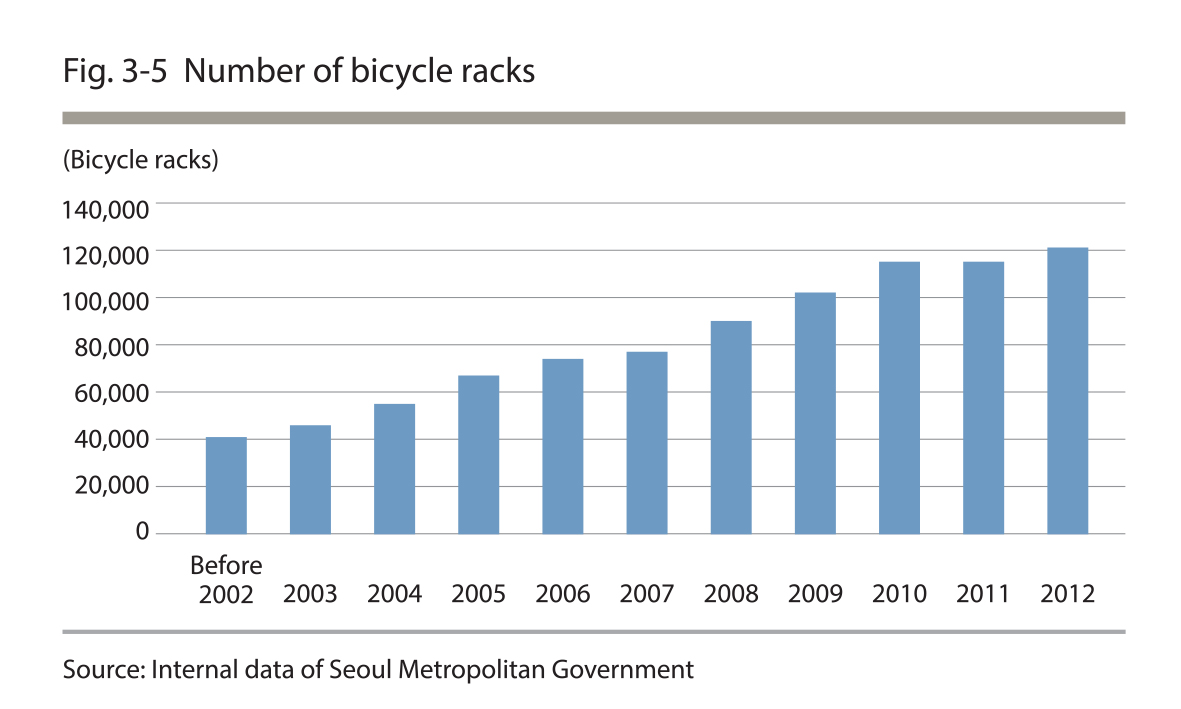
As of 2012, the bicycle paths extend 674km in distance and there are 121,092 bicycle racks
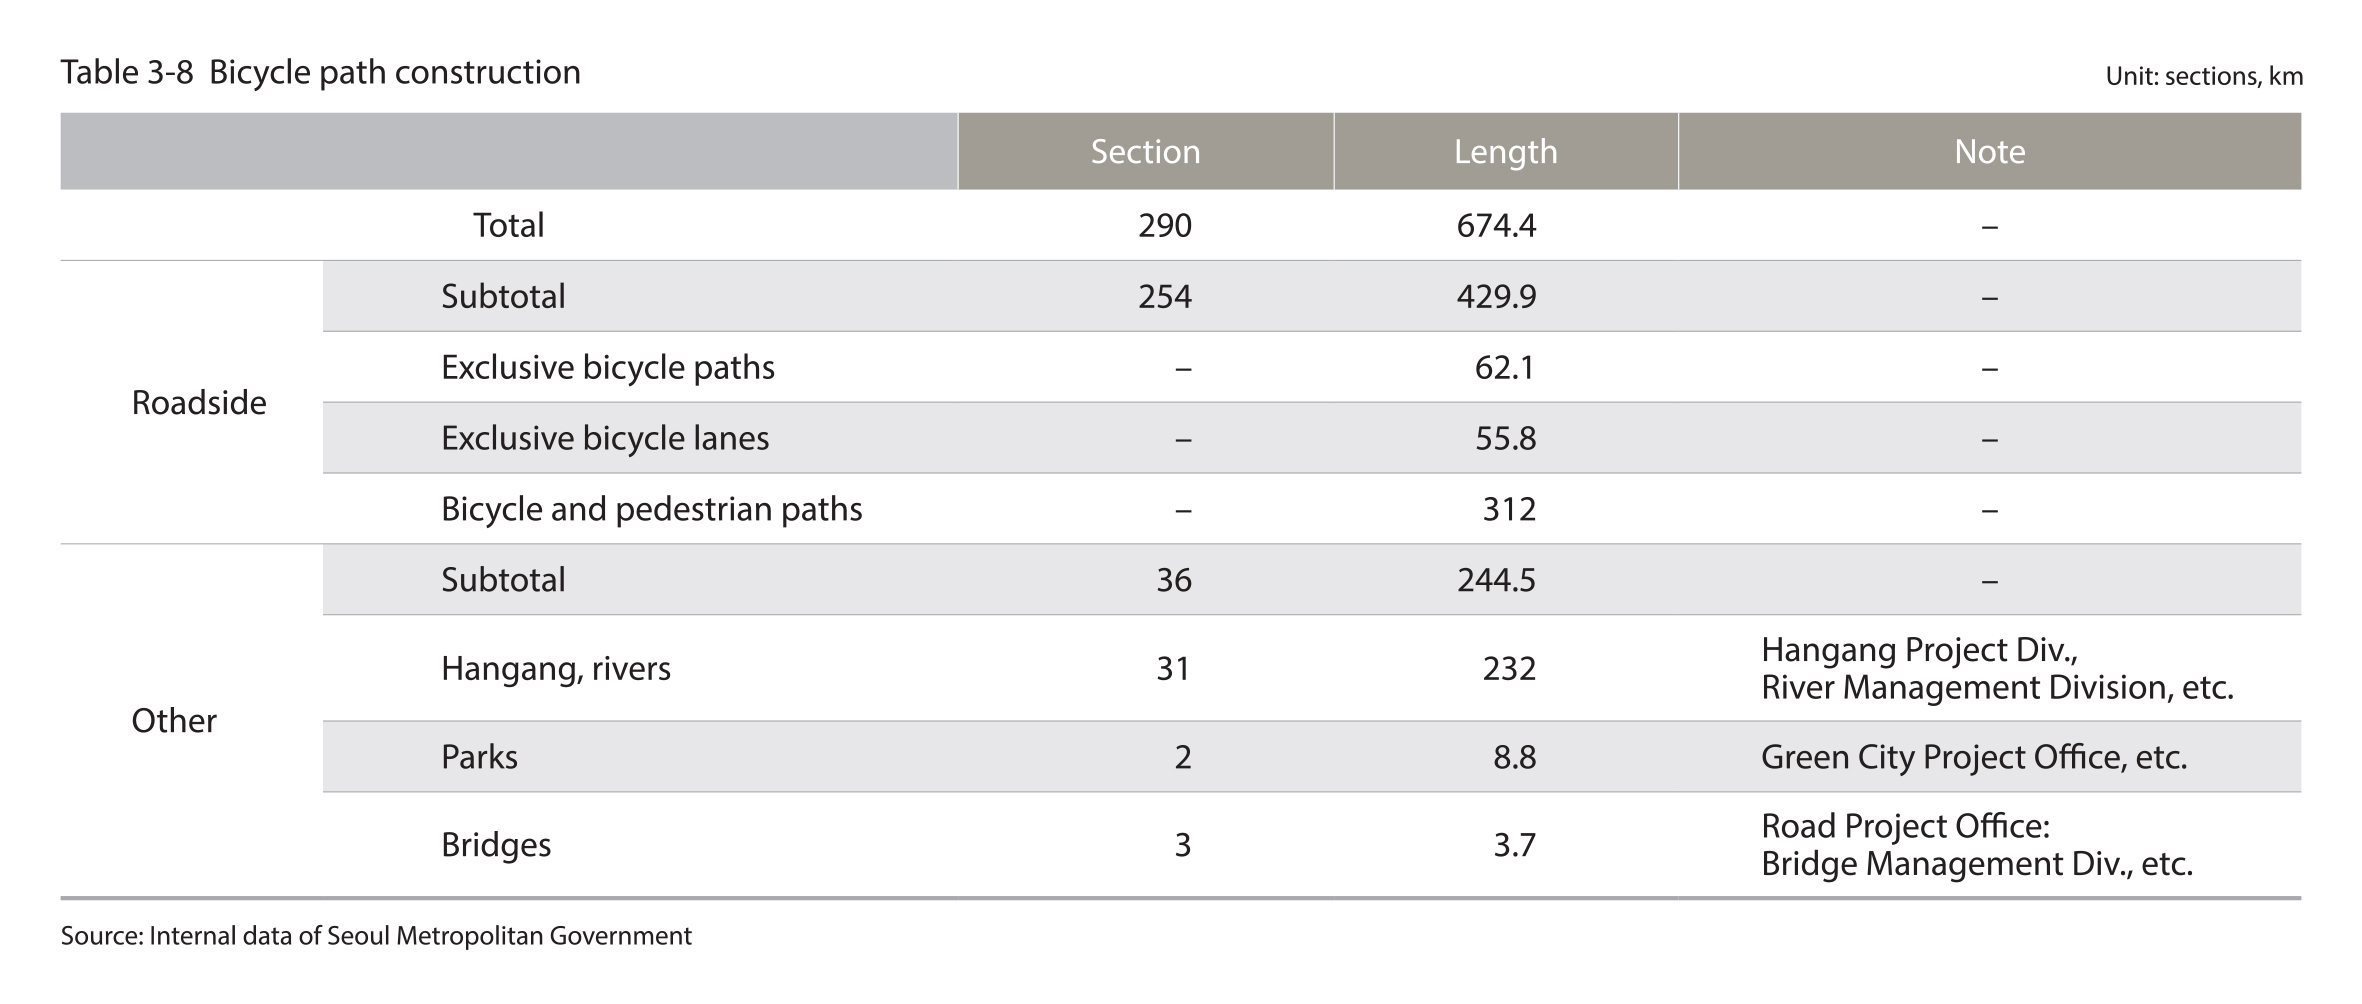
The total distance of bicycle path in Seoul has been increasing gradually to 674km as of 2012, while the total number of bicycle racks was reported to be 121,092, which was a 192% (79,581) increase from 41,511 racks in 2002. Compared to the year 2010, the distance of the bicycle paths decreased by 40.5km in 2011 as a result of the Hangang Bicycle Path Removal and Improvement Project, Road Renaissance Project, and Pedestrian and Bicycle Path Improvement Project. Also, there was a problem of redundancy in the previous calculation method; to be more specific, some of the autonomous-gu offices took into account the single-lane, bi-directional bicycle paths twice when calculating the distances of the bicycle paths, and the standards for the statistical data differed among the autonomous-gu offices. Thus, the total distance of the bicycle paths decreased once the standards for the statistical data were established to eliminate redundant data.
Source : Internal data of Seoul Metropolitan Government
Source : Internal data of Seoul Metropolitan Government
Source : Seoul Metropolitan Government, Seoul Statistics Yearbook, 2012
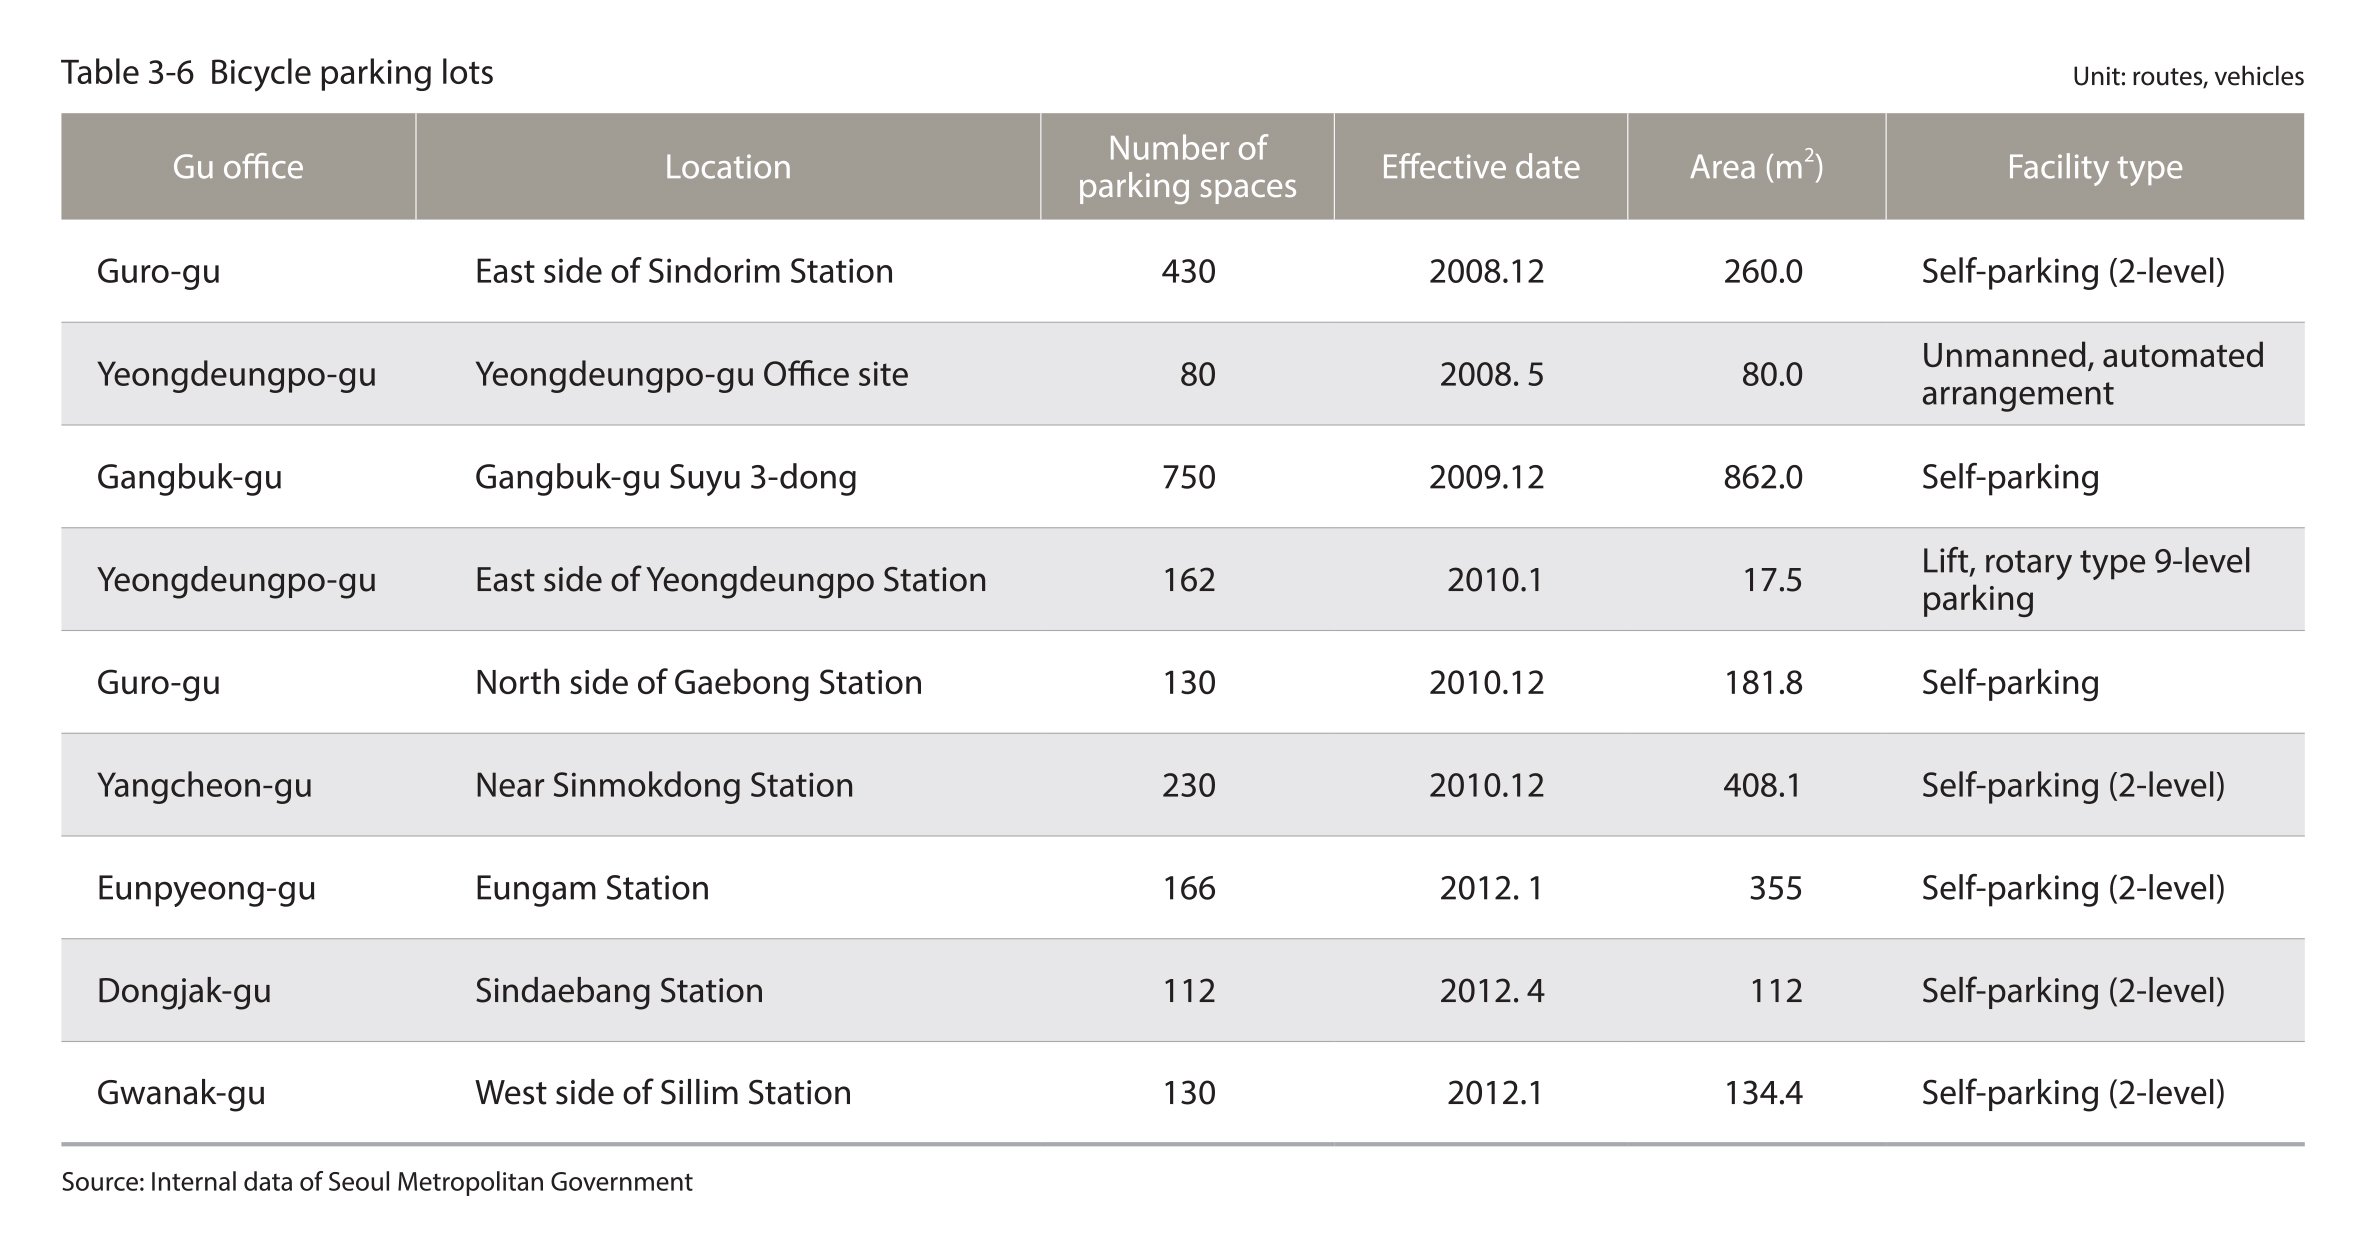
9-gu offices operate a bicycle parking lot each (total area : 2,411㎡ and 2,l90 parking spaces)
As of 2012, the 9 autonomous-gu offices of Seoul operate a bicycle parking lot each and there is enough space to park a total of 2,190 bicycles.
2.2 Bicycle Path to Road Ratio
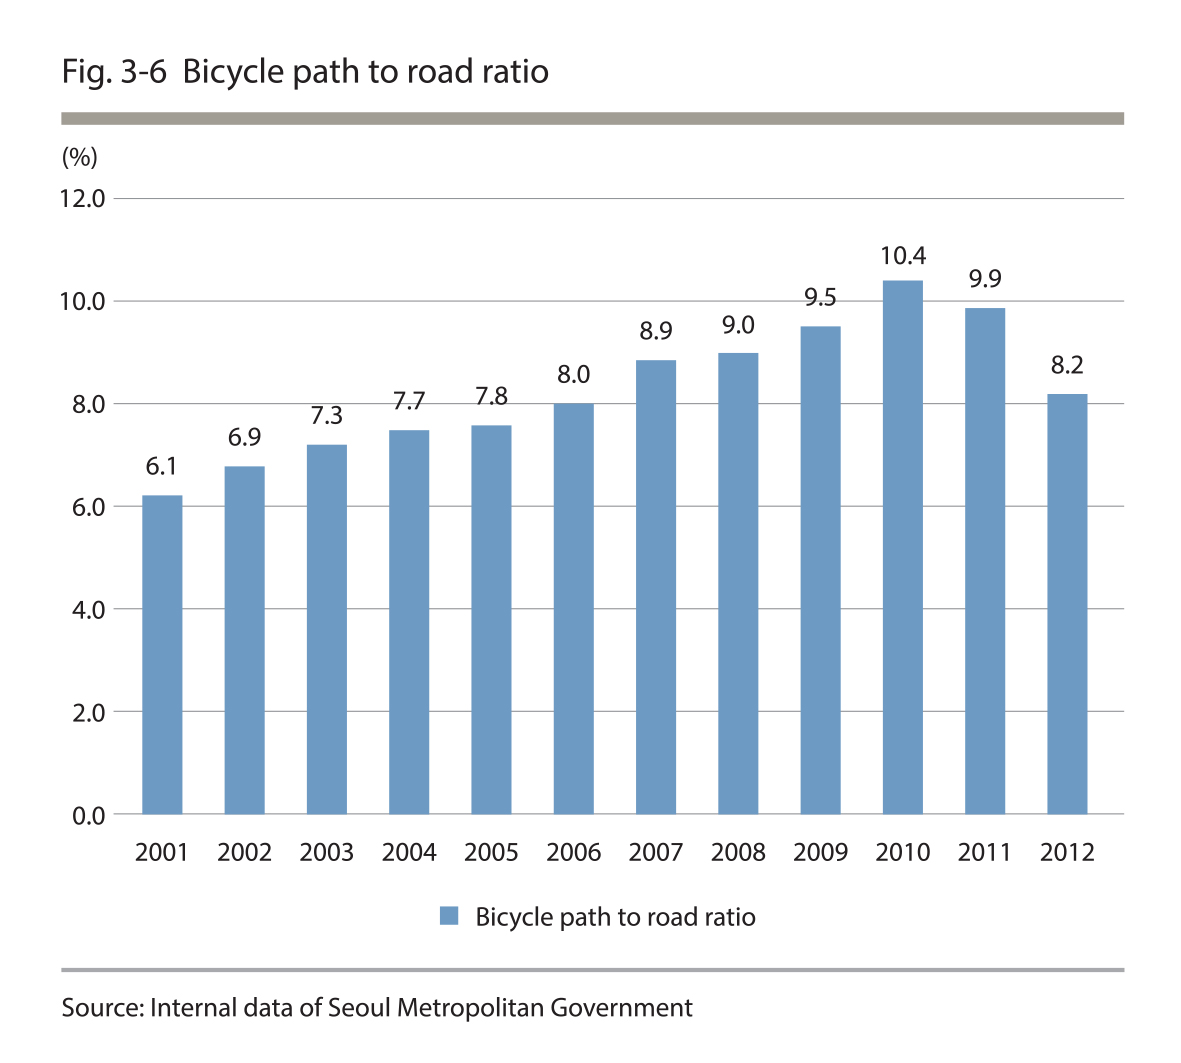
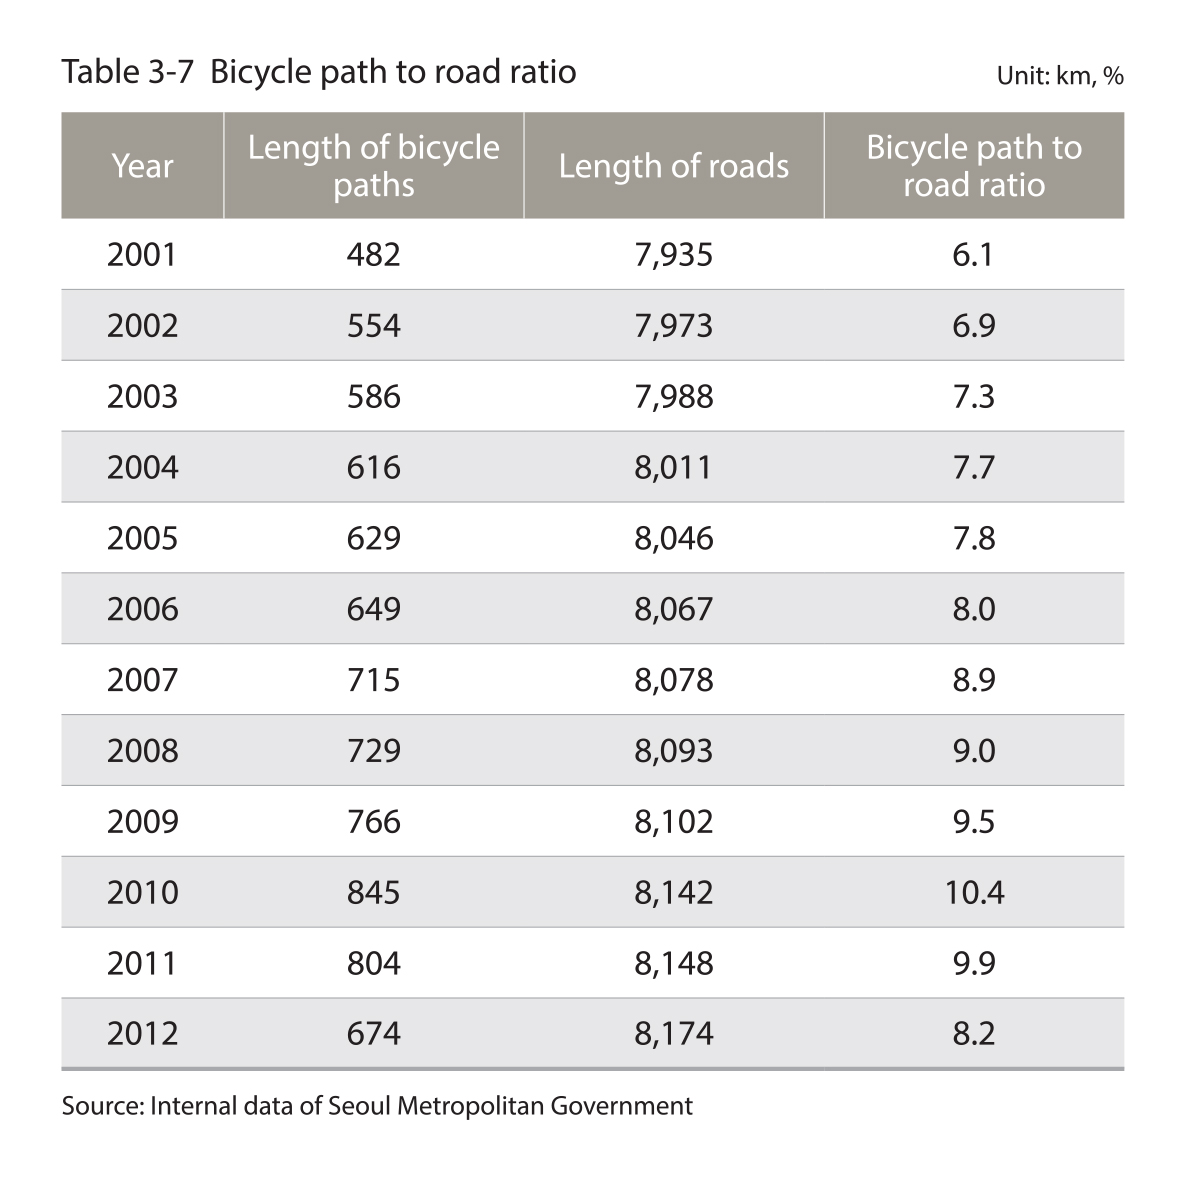
The bicycle path to road ratio for Seoul is 8.2% (as of 2012)
The bicycle path to road ratio refers to the ratio of the total length of bicycle paths to the total length of roads in a given city. Bicycle paths provide convenience for bicycle users and contribute to the creation of an eco-friendly urban environment. The bicycle path to road ratio for Seoul as of 2012 is 8.2%.
Source : Internal data of Seoul Metropolitan Government
Source : Internal data of Seoul Metropolitan Government
Source : Internal data of Seoul Metropolitan Government
Source : Internal data of Seoul Metropolitan Government
