
-
Transportation
Public Transportation
-
1. Subway
1.1. Overview
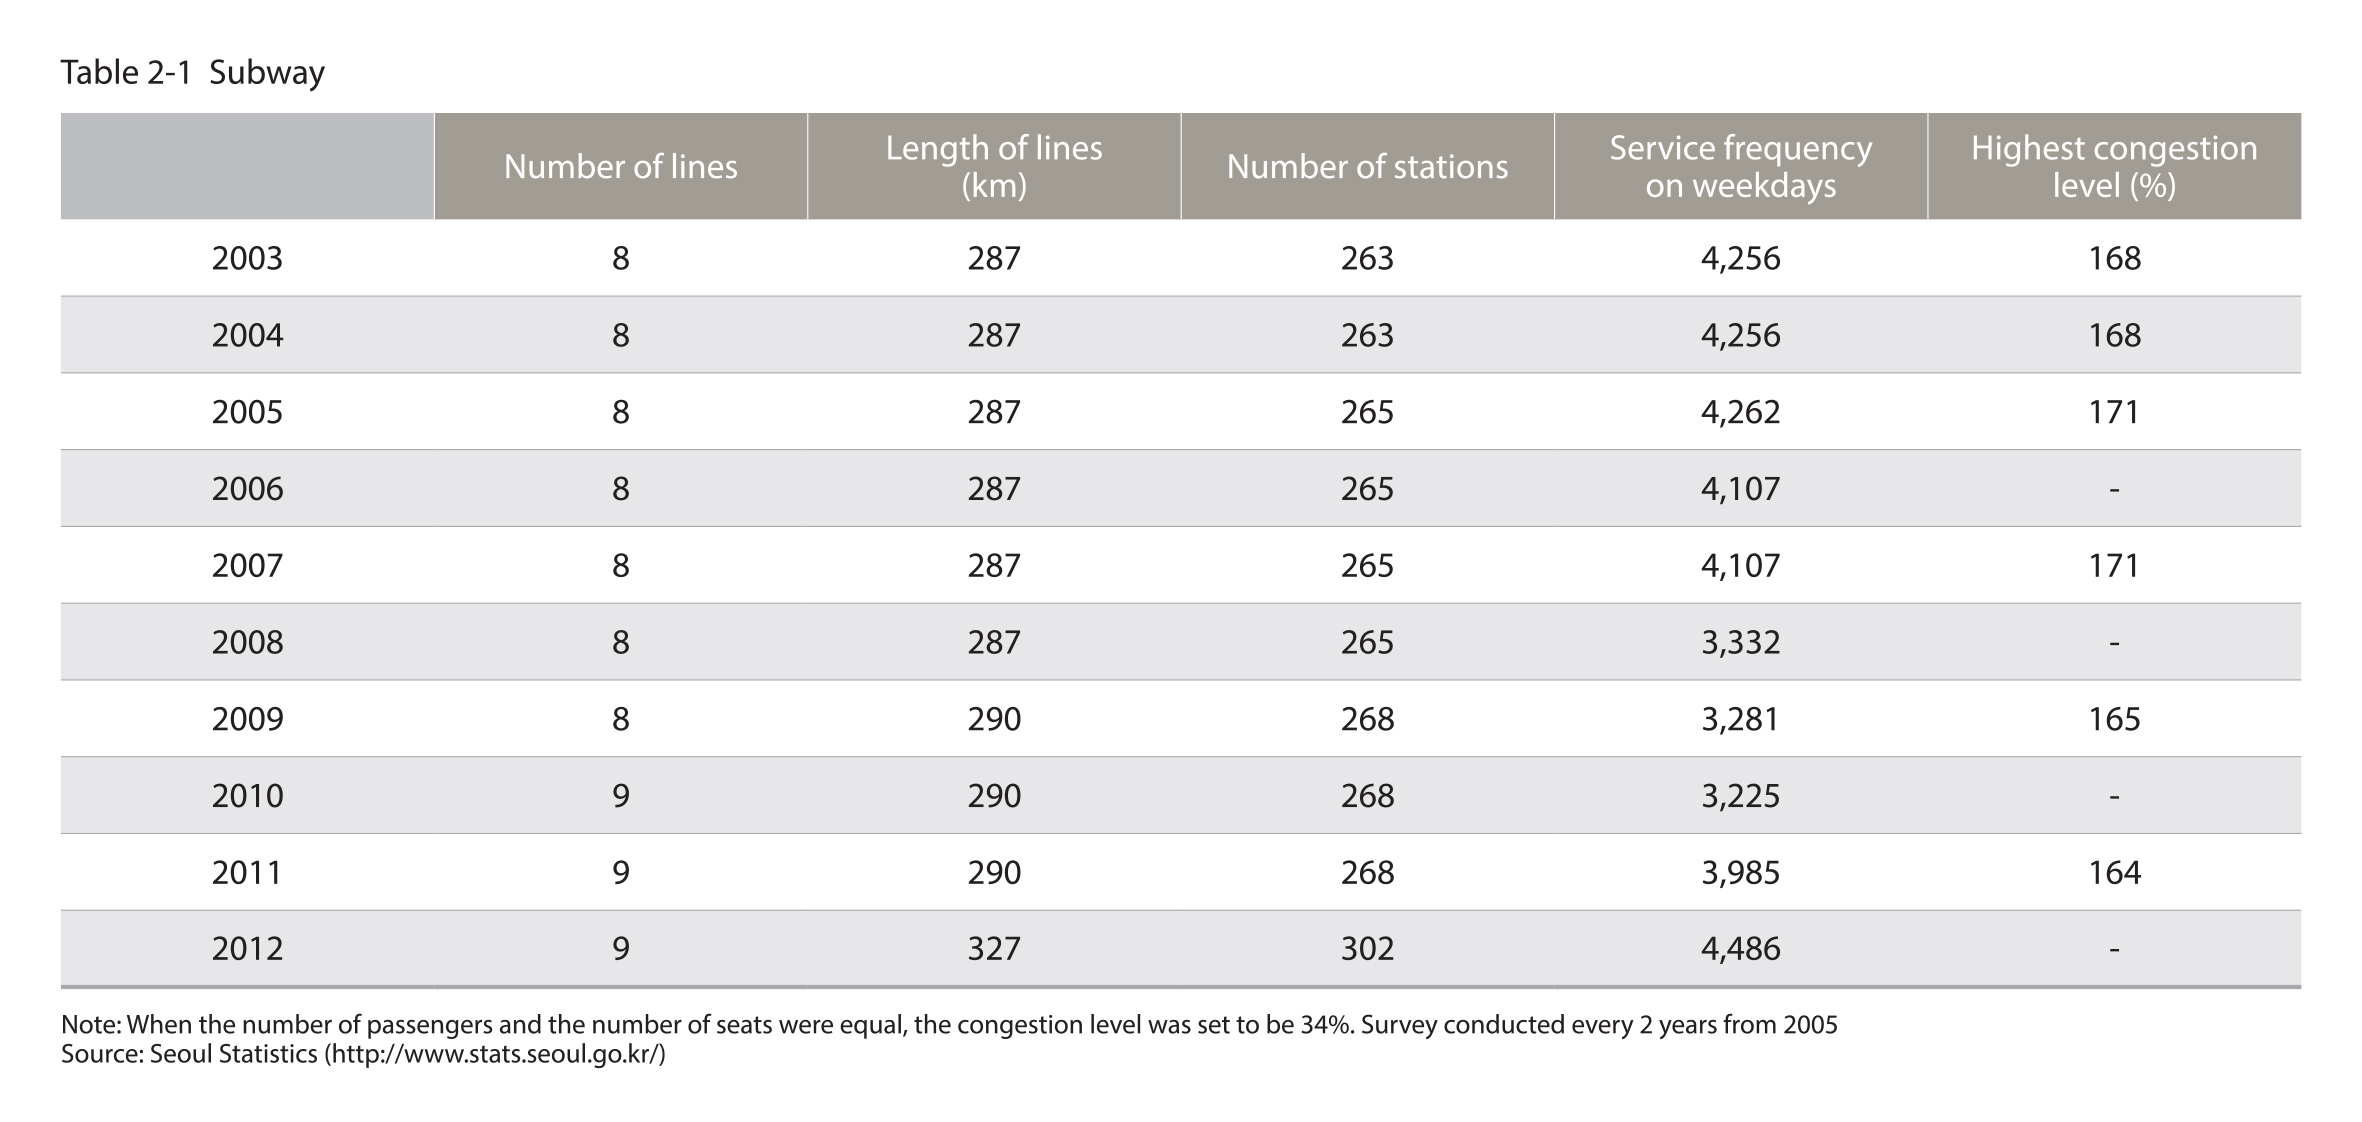
Daily subway service frequency on weekdays was 4,486 times(2012), and it increased dramatically with the opening of the Shinbundang Line
The daily service frequency of the subway on weekdays gradually decreased from 2003 until 2010 before increasing dramatically starting in 2011. The reason for the fall in the service frequency in 2008 was that Seoul Metro had increased the service intervals due to a drop in the transportation demand resulting from school breaks and as a means to save energy. With the opening of the Shinbundang Line on October 29, 2011, the absolute subway service frequency increased again.
Source : Seoul Statistics (http://stat.seoul.go.kr/)
1.2. Passengers
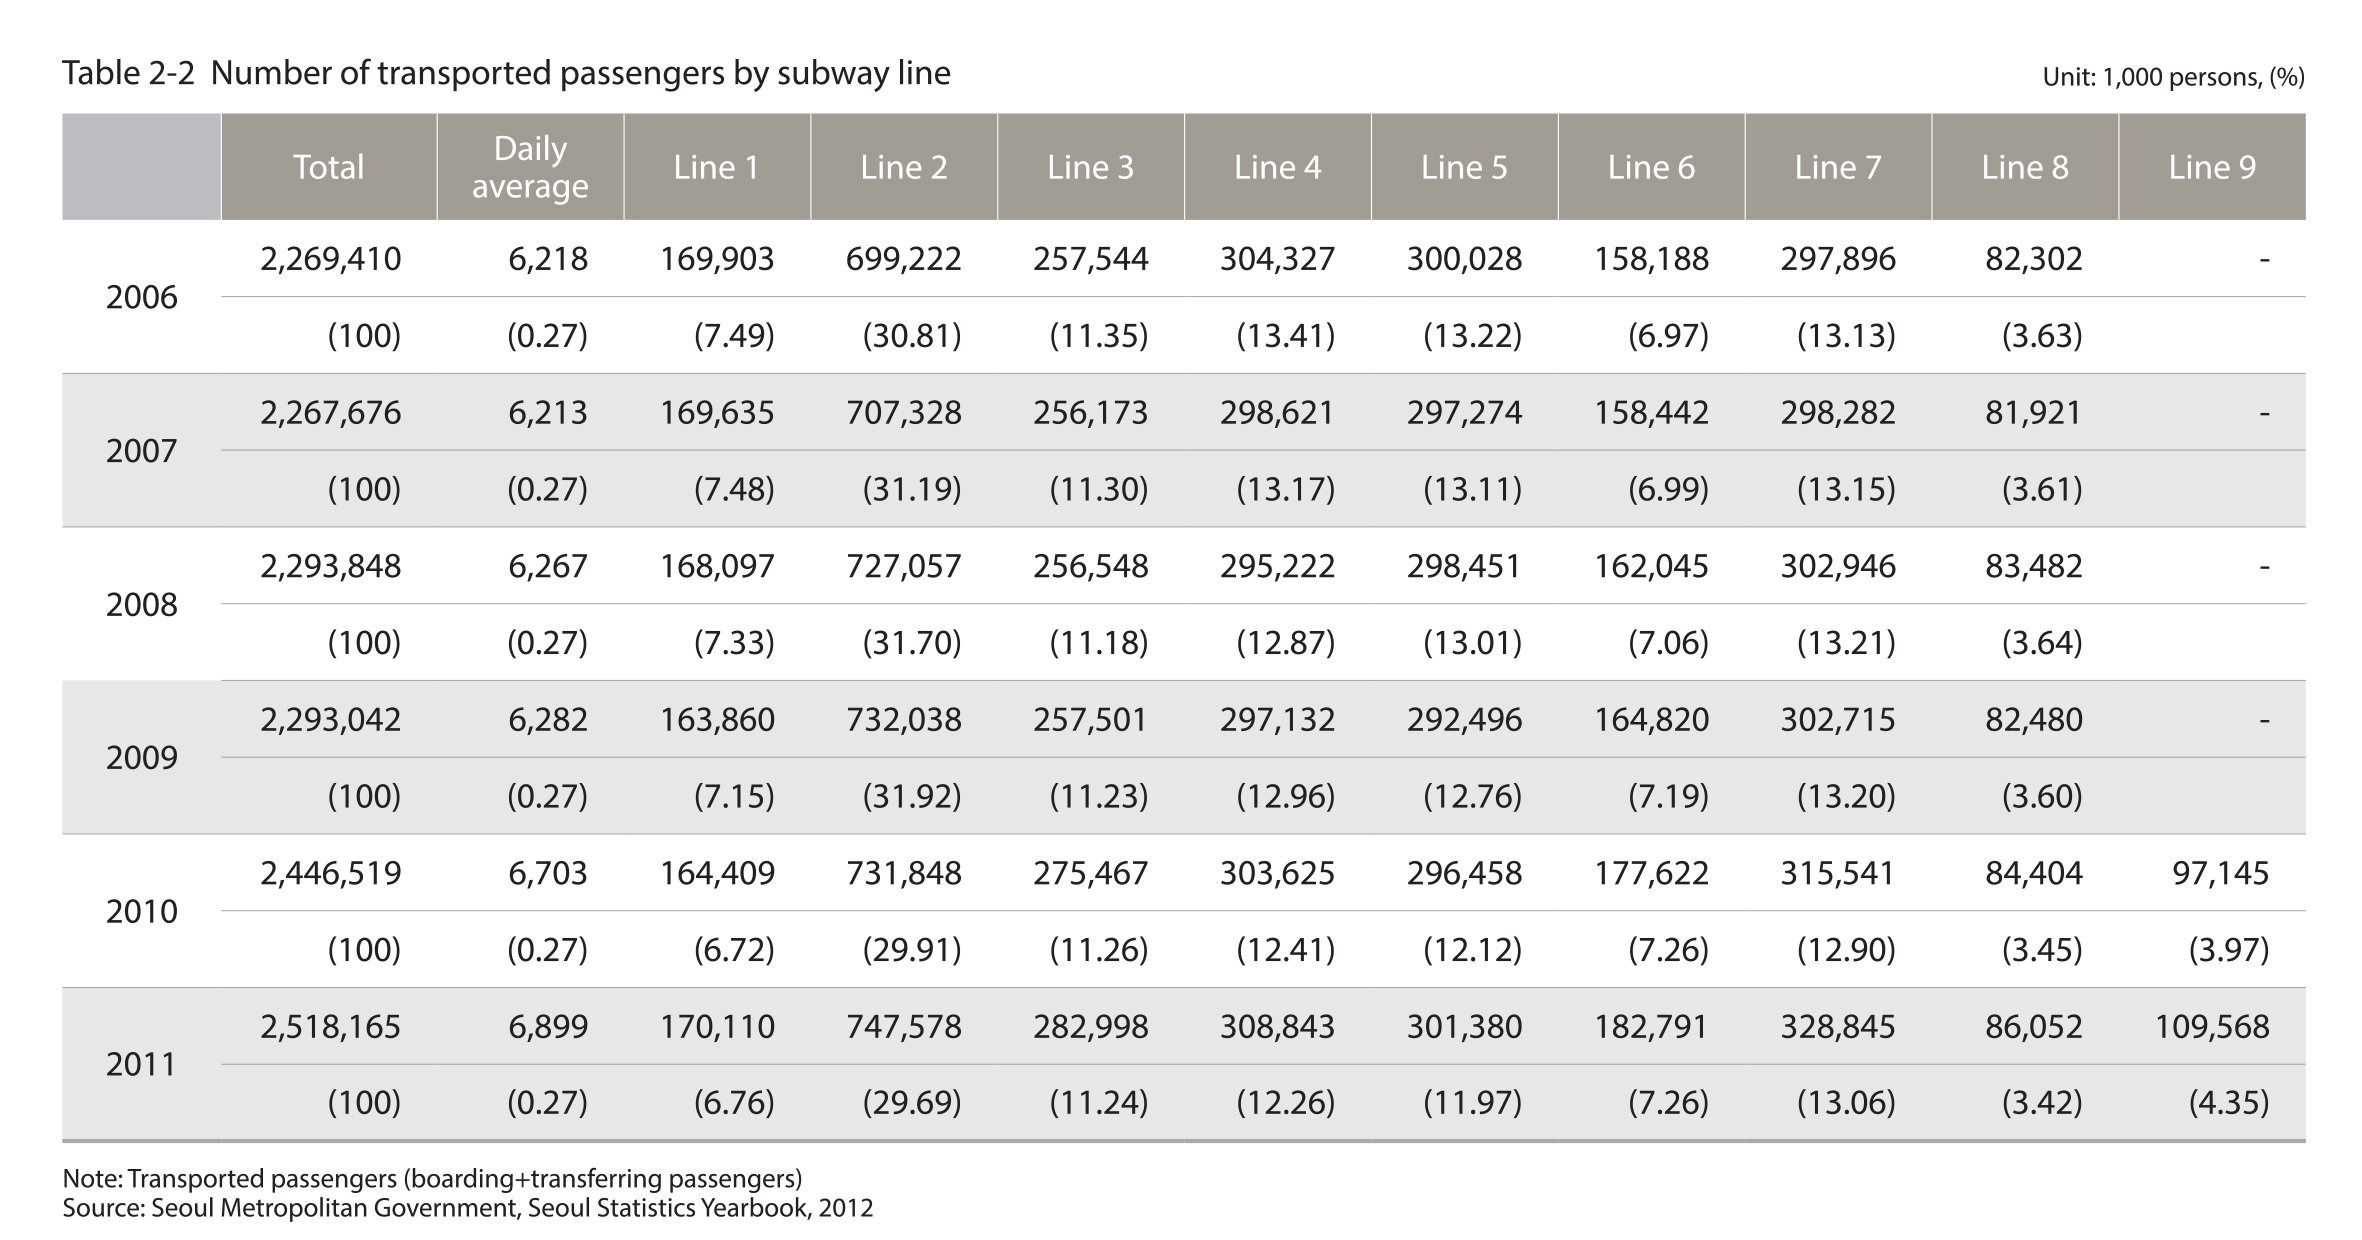
The number of transported subway passengers (boarding and transferring passengers) in Seoul was 2,518,165,000, which increased at an average annual rate of 2.1 % since 2006
The total and daily average number of transported subway passengers in Seoul has been increasing annually. The total number of transported passengers increased by 248,755,000 from 2,269,410,000 in 2006 to 2,518,165,000 in 2011, while the number of daily average passengers was recorded to be 6,899,000.
The number of passengers transported on Line 2 in 2011 was 747,578,000, accounting for the highest proportion (29.7%) among the 9 lines
A review of the number of transported passengers for each subway line in Seoul showed that Line No. 2 transported the largest number of passengers, accounting for nearly 30% of the total passengers, followed by lines 3, 4, 5 and 7 (approx. 11 to 14%), lines 1 and 6 (approx. 6 to 7%) and lines 8 and 9 (approx. 3 to 4%).
Source : Seoul Metropolitan Government, Seoul Statistics Yearbook, 2012
1.3. Congestion Level
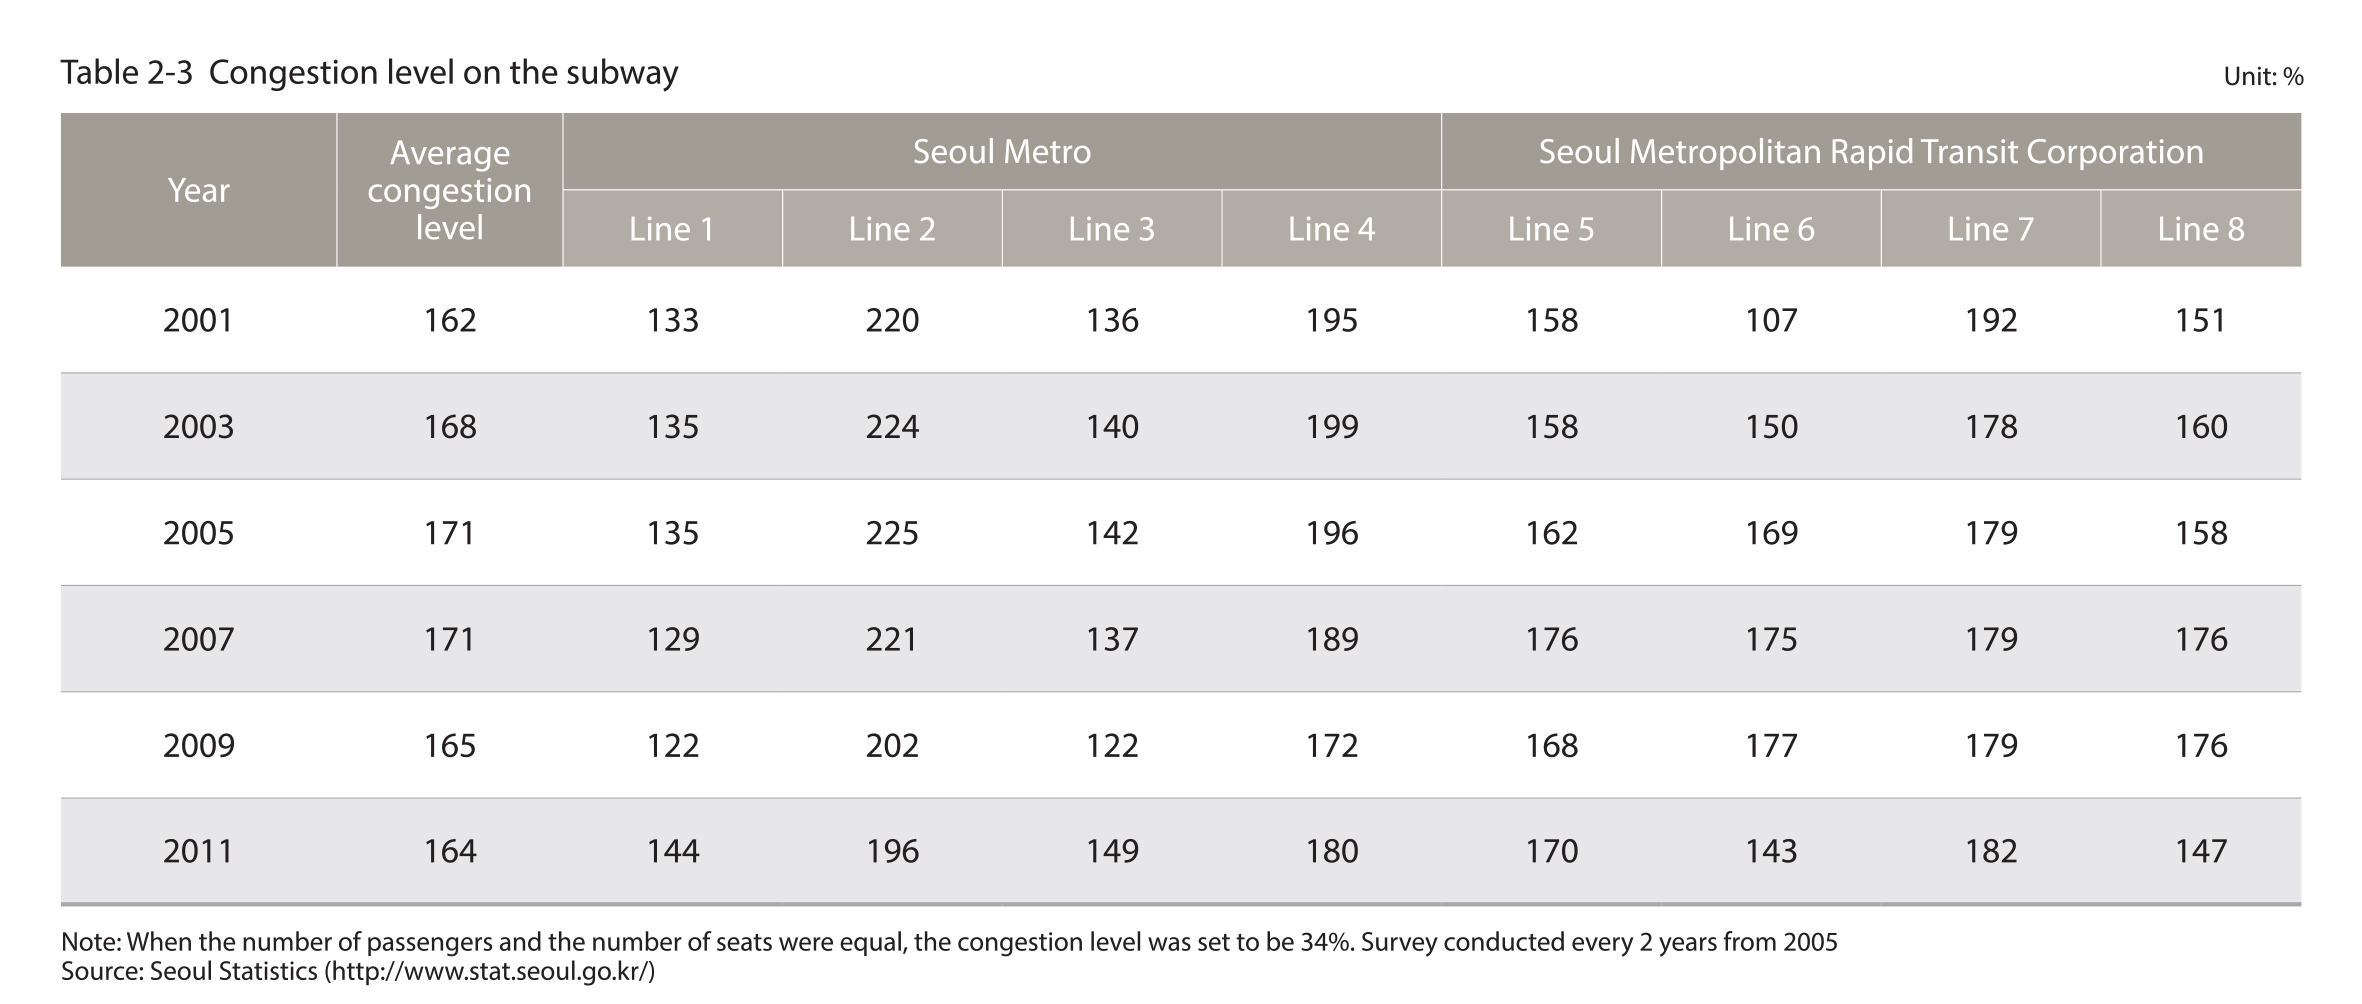
The subway congestion level in Seoul in 2011 was 164%, with the highest congestion level observed on Line 2
As for the congestion level of the subway system in Seoul, it was set to be 34% when the number of passengers and the number of seats were equal, and determined every 2 years. In 2011, the average congestion level of the subway system in Seoul was calculated to be 164%. It began increasing in 2001 before dropping again in 2007. As of 2011, the lines found to be the most congested were Line 2, operated by Seoul Metro, which had a congestion level of 196% , and Line 7, operated by Seoul Metropolitan Rapid Transit Corporation, which had a congestion level of 182%.
Source : Seoul Statistics (http://stat.seoul.go.kr/)
1.4. Fare System
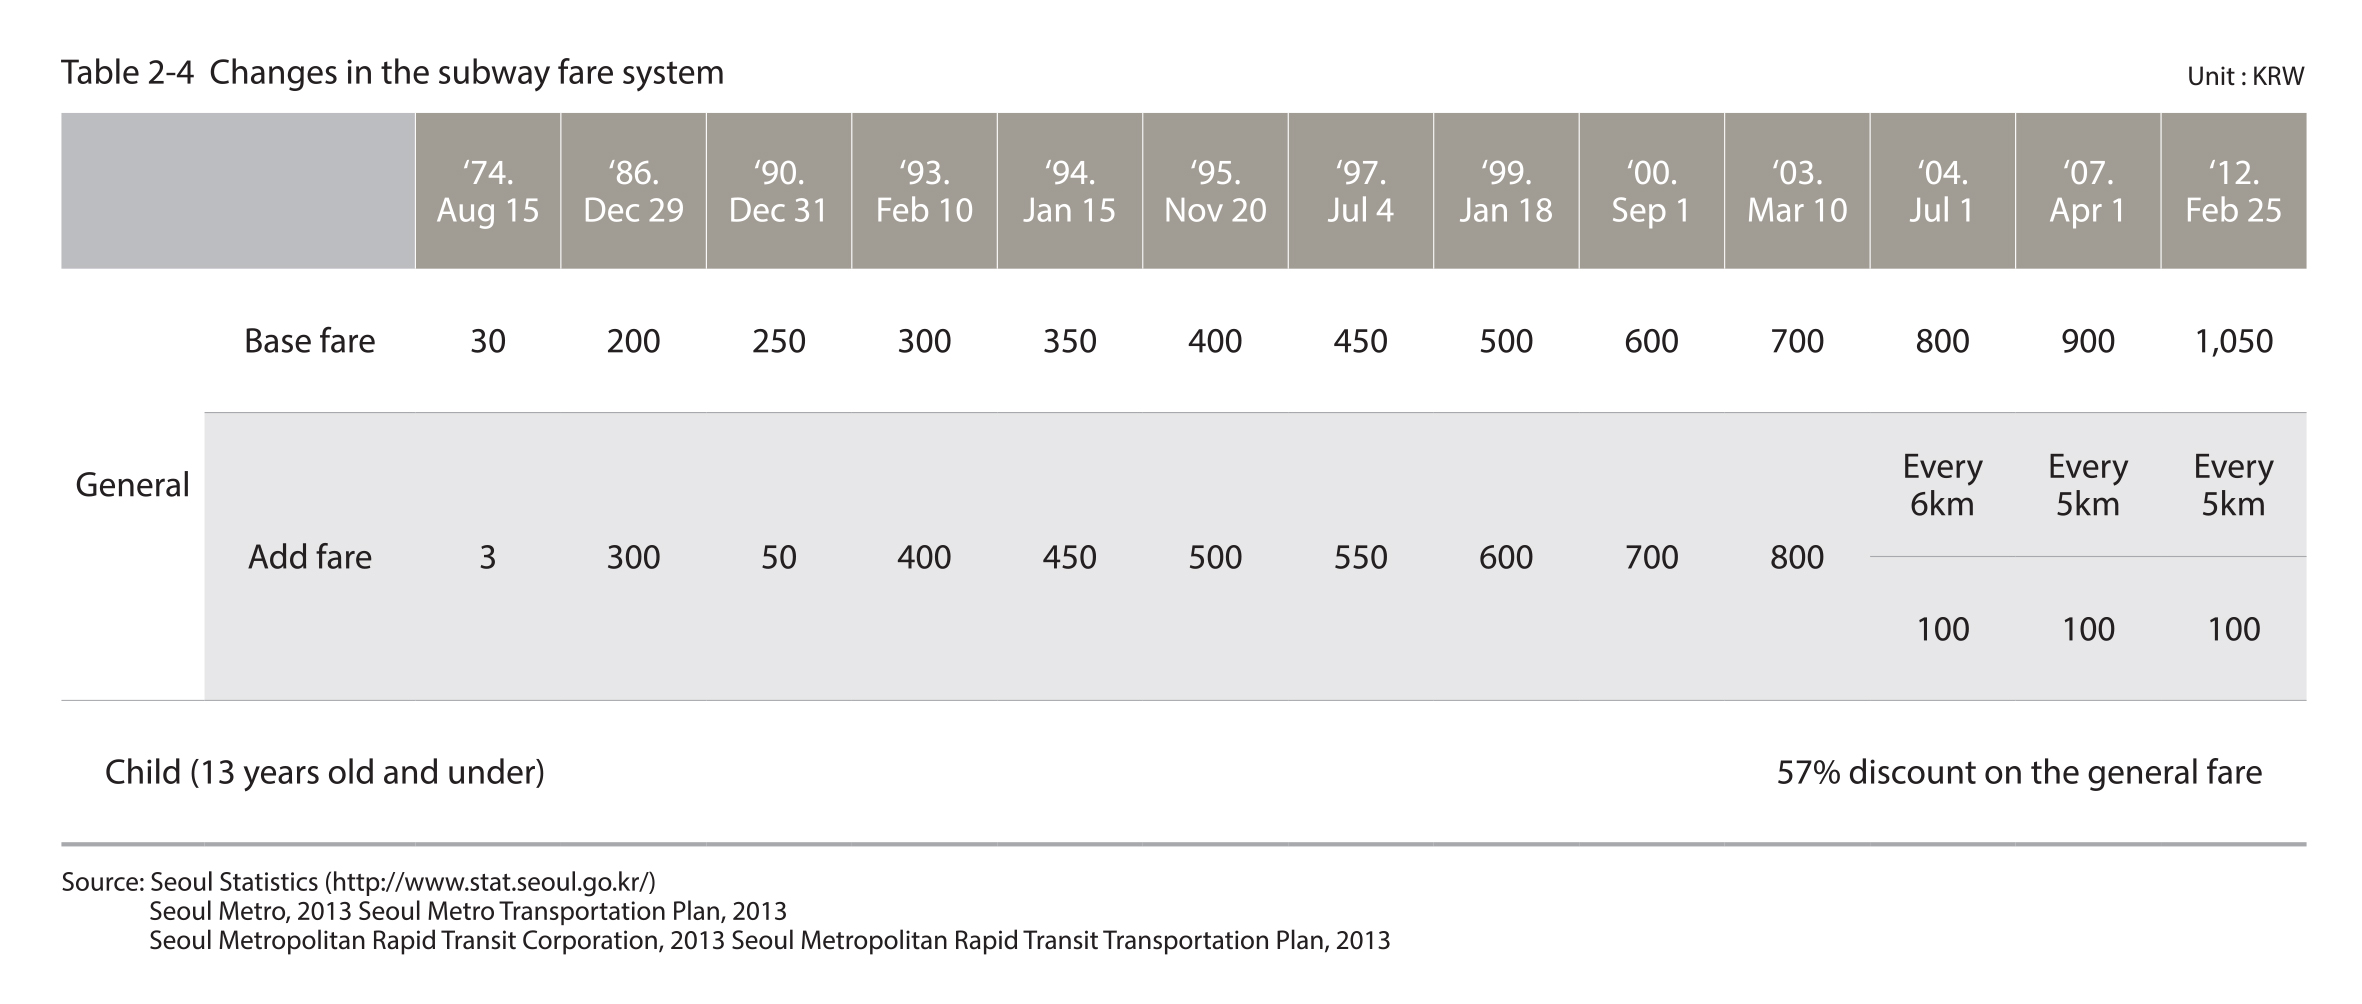
Seoul subway fare system : base fare of 1,050 KRW and distance-based rate system
The base subway fare had initially been 30 KRW in 1974 at the start of the subway operation. The base subway fare as of 2012 is 1,050 KRW, indicating a 35-fold increase over the course of 40 years. A review of the changes in the subway fare system in Seoul showed that the fare was adjusted arbitrarily and there were no specific standards in relation to the fare increases. At present, the subway fare system applied in Seoul is a distance-based rate system, where all sections of the railway system are considered unitary, and the integrated distance-based rate system is applied in the case of bus transfers.
Source : Seoul Statistics (http://stat.seoul.go.kr/)
Seoul Metro, 2013 Seoul Metro Transportation Plan, 2013
Seoul Metropolitan Rapid Transit Corporation, 2013 Seoul Metropolitan Rapid Transit Transportation Plan, 2013
2. Bus
2.1. Number of Routes and Vehicles
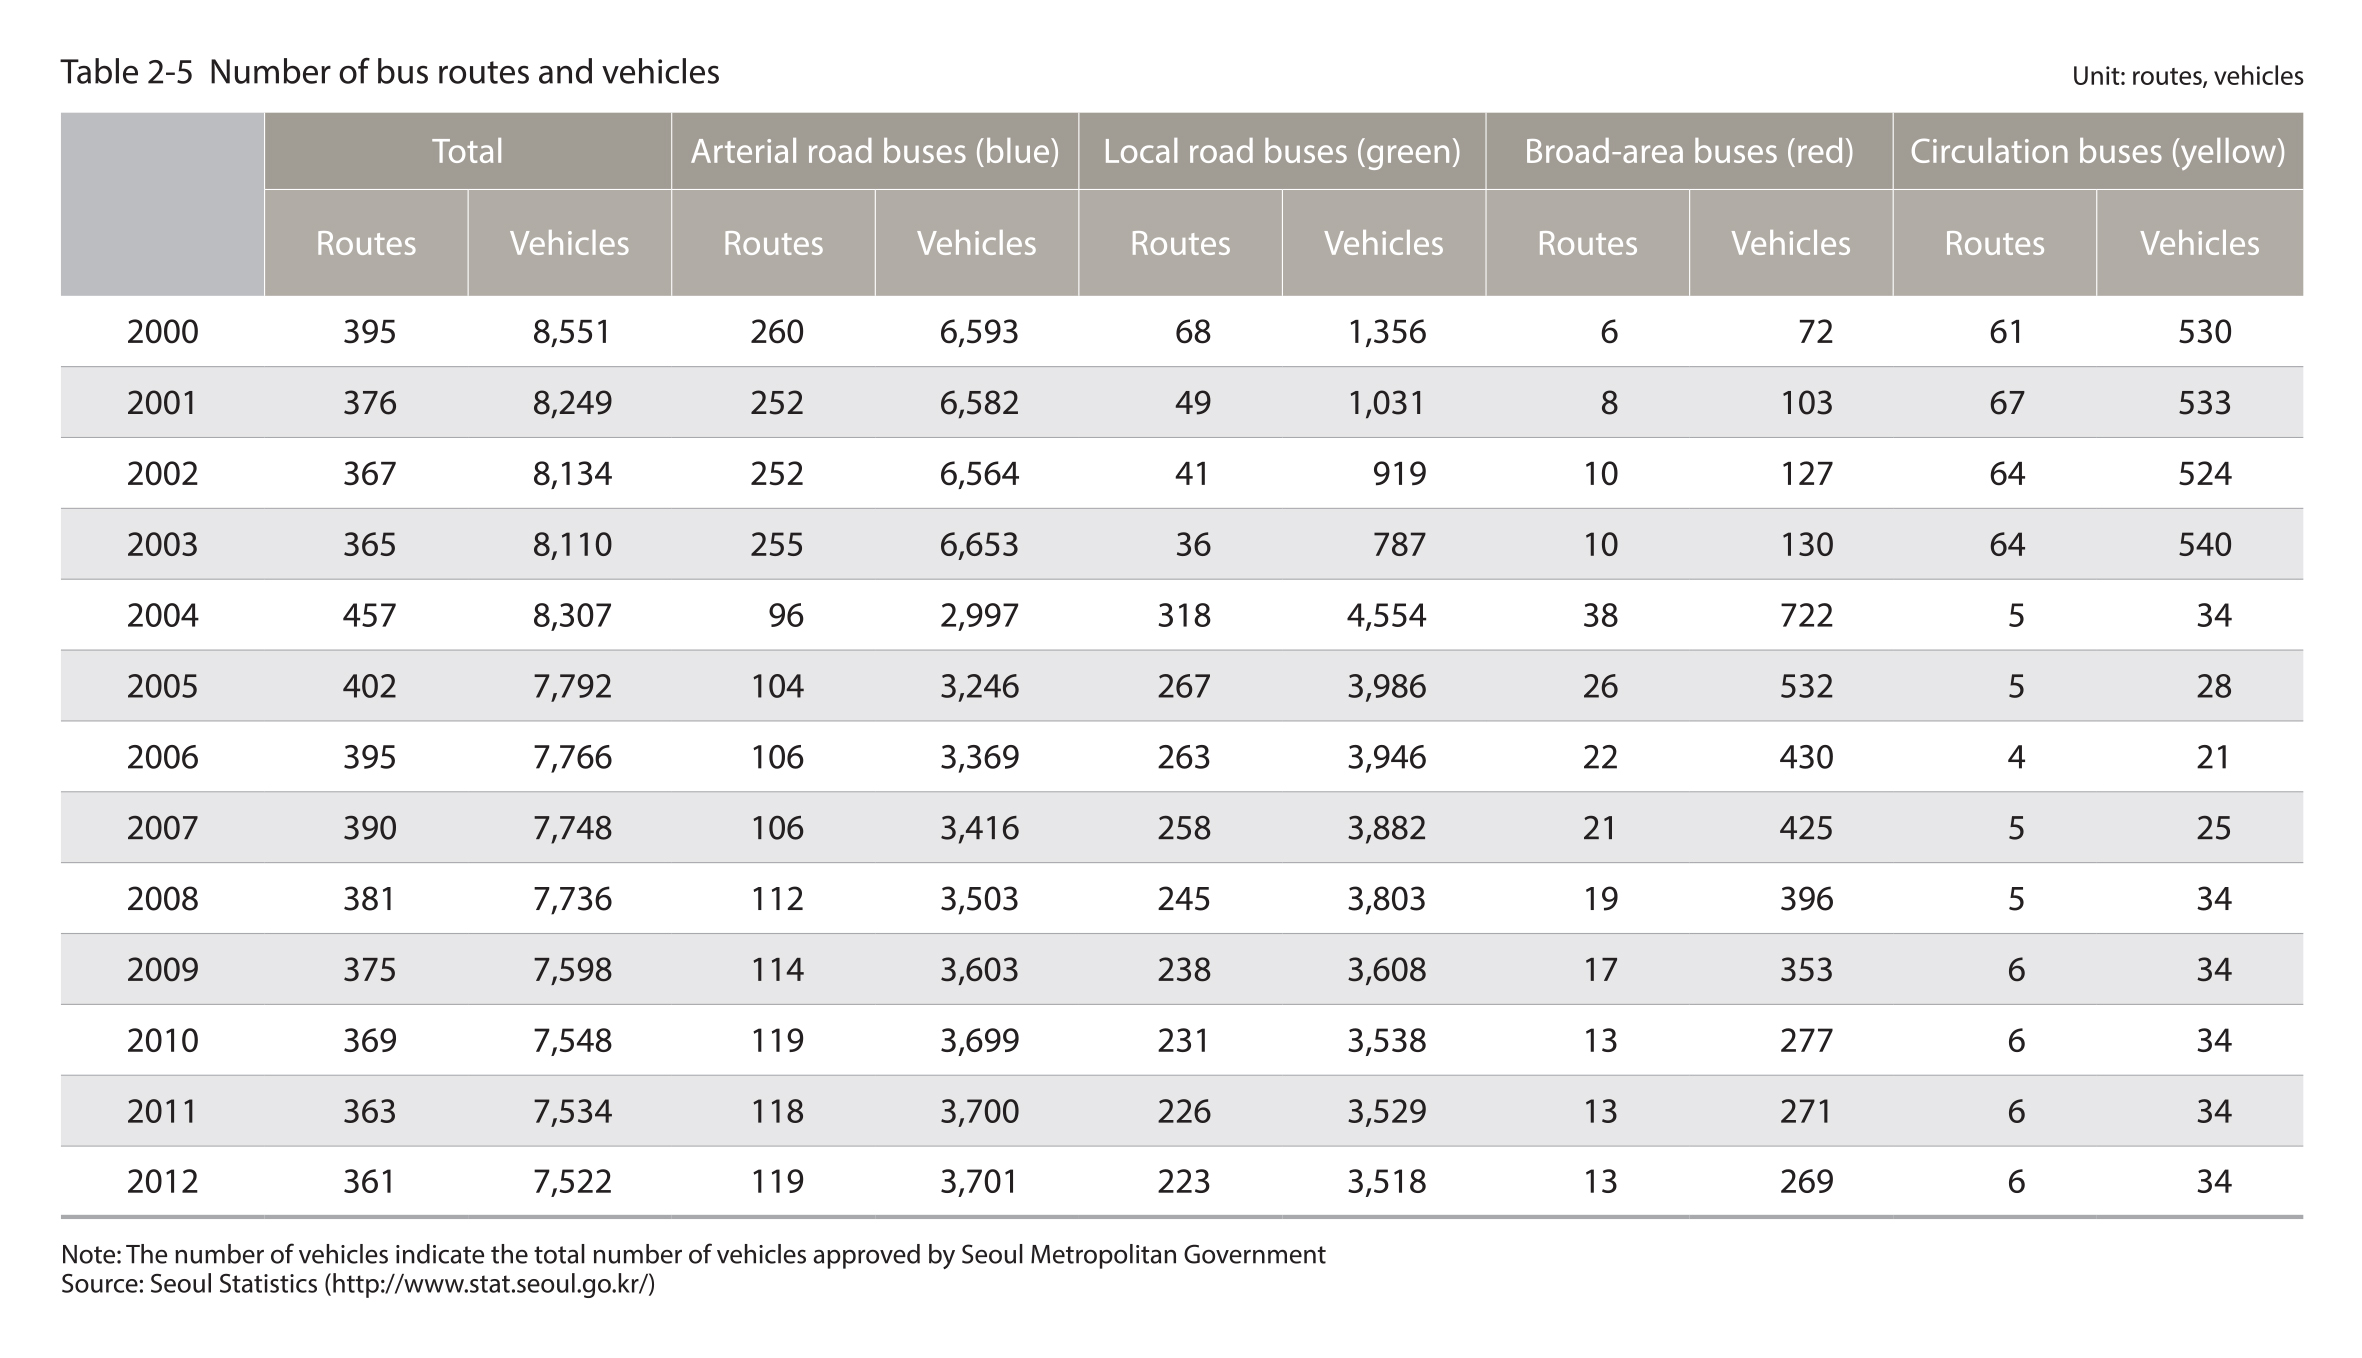
Seoul operated 361 bus routes and 7,522 buses in 2012
Following the reorganization of the bus operation system in July 2004. the number of routes and vehicles for each bus type changed drastically. For instance, the number of routes and vehicles for the arterial road bus (blue bus) lines decreased, while the number of routes and vehicles for the local road (green bus) lines increased. Compared to the year 2000, 34 fewer bus routes and 1,029 fewer buses are in operation in Seoul (361 bus routes and 7,522 buses in operation).
Source : Seoul Statistics (http://stat.seoul.go.kr/)
2.2. Passengers
The number of transported bus passengers in Seoul in 2011 was 1,684,312,000, which was an increase from 2005
The number of passengers transported by the intra-city buses of Seoul decreased from 1,772,859,000 in 1996 to 1,772,859,000 in 2004 before soaring to 1,631,004,000 in 2005. The reorganization of the bus system in Seoul in 2004 is speculated to have had an impact on this trend. The number of passengers transported by the intra-city buses of Seoul in 2011 was 1,684,313,000, which accounted for 30.4% of the total number of transported bus passengers in the nation.
2.3. Busway Alignment
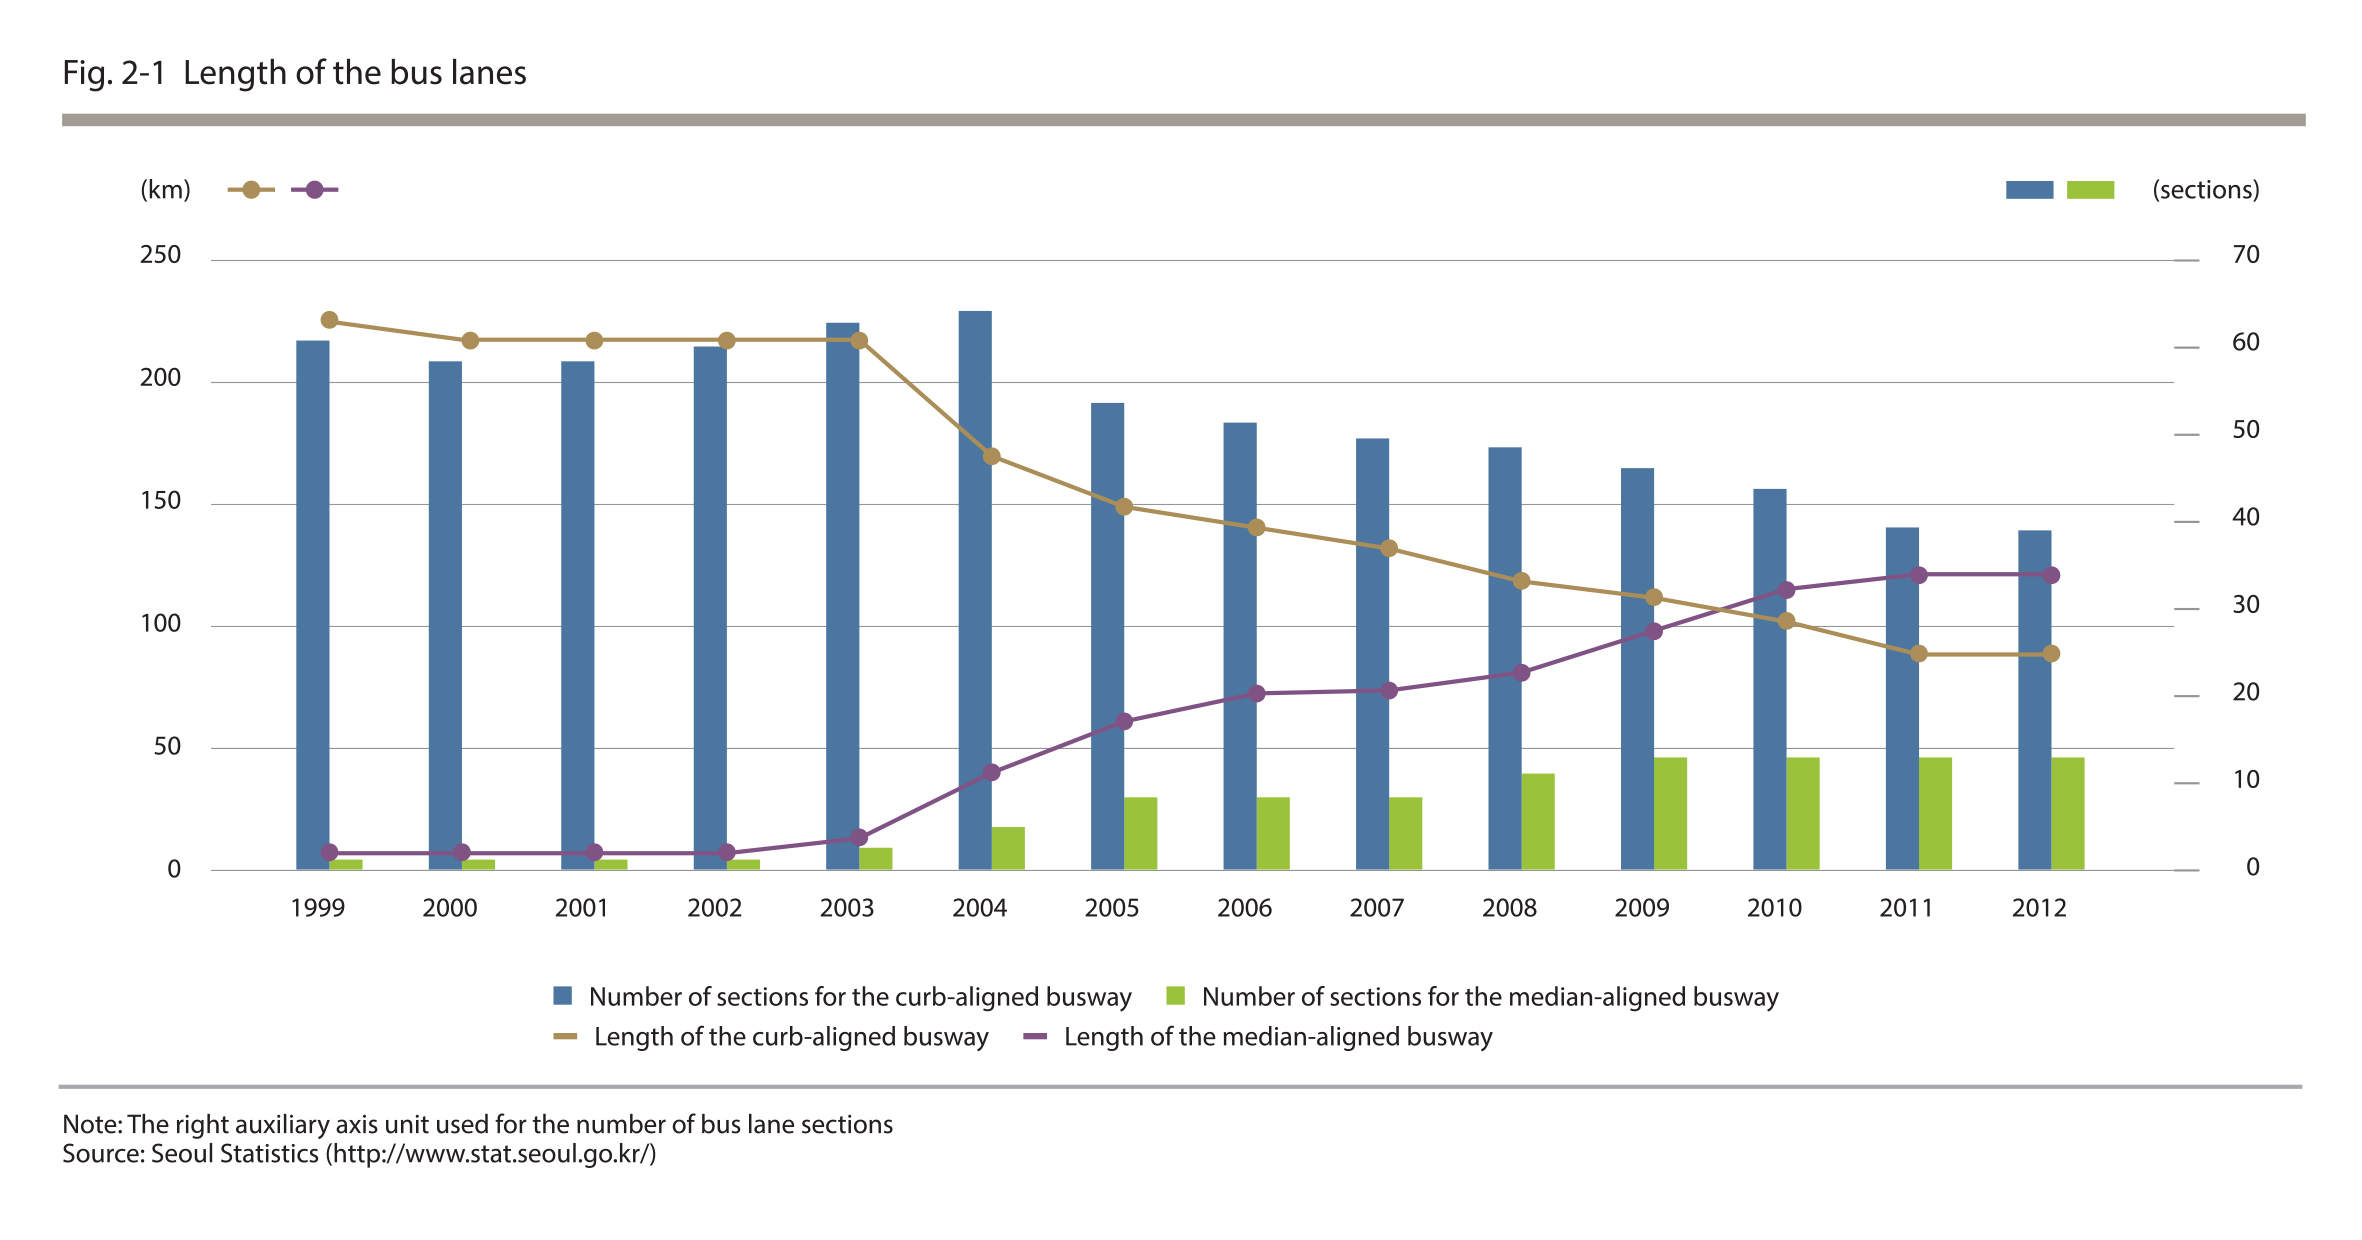
Increased number of median-aligned busway dedicated to improve system quality in seoul (13 sections with a distance of 122.1km in 2012)
Since the designation of the median-aligned busway on Cheonho-daero, there have been a total of 13 sections designated as median-aligned busway (as of 2012). With the simultaneous launch of the three bus routes along the median-aligned busway in 2004, the nember of sections and extensions of the curb-aligned busway declined. In 2012 in Seoul, there were 40 sections of curb-aligned busway near the roadsides that extended 88.3km in distance and 13 sections of median-aligned busway that extended 122.1km.
Source : Seoul Statistics (http://stat.seoul.go.kr/)
2.4. Low-floor Buses
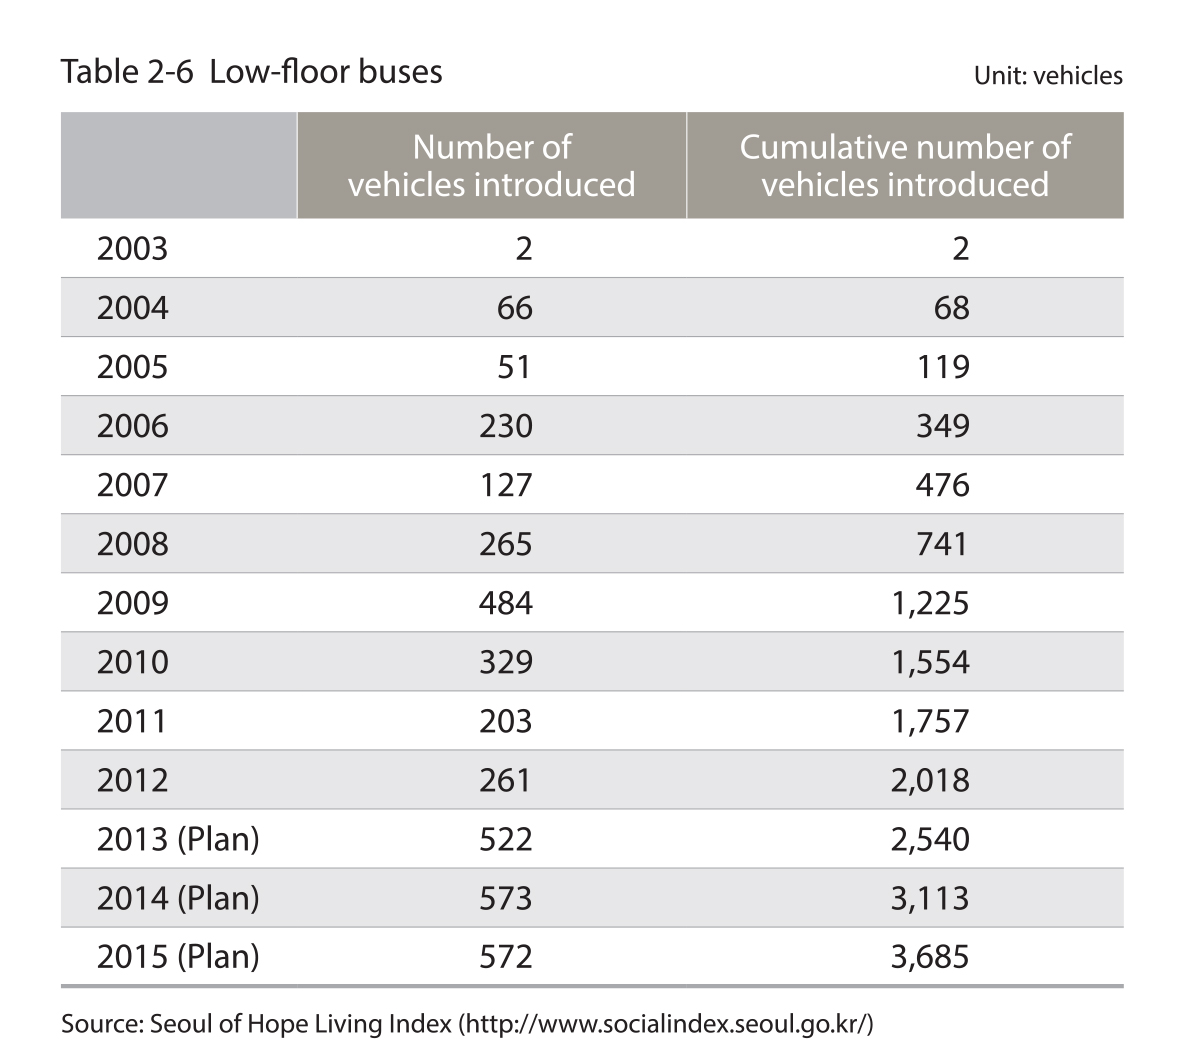
As of 2012, there are 2,018 low-floor buses in Seoul, with a goal to increase it to 3,685 by 2015
The "vulnerable transportation users" refer to those who face challenges in using the various modes of transportation and they include the disabled and the elderly. As part of an effort to ensure their mobility right, low-floor buses were officially introduced in 2004 following a pilot operation in 2003. The low-floor bus services contributed to the improved convenience in movement for not only the vulnerable transportation users but also the general public. In 2012, there were 2,018 low-floor buses in operation. There are plans to introduce an additional 1,667 low-floor buses by 2015 with a goal to increase its proportion up to 50% of the total buses in operation, and to provide more low-fl1oor bus service information via the websites of welfare facilities and organizations assisting the disabled and the elderly population.
Source : Seoul of Hope Living Index(http://socialindex.seoul.go.kr/)
2.5. CNG Buses
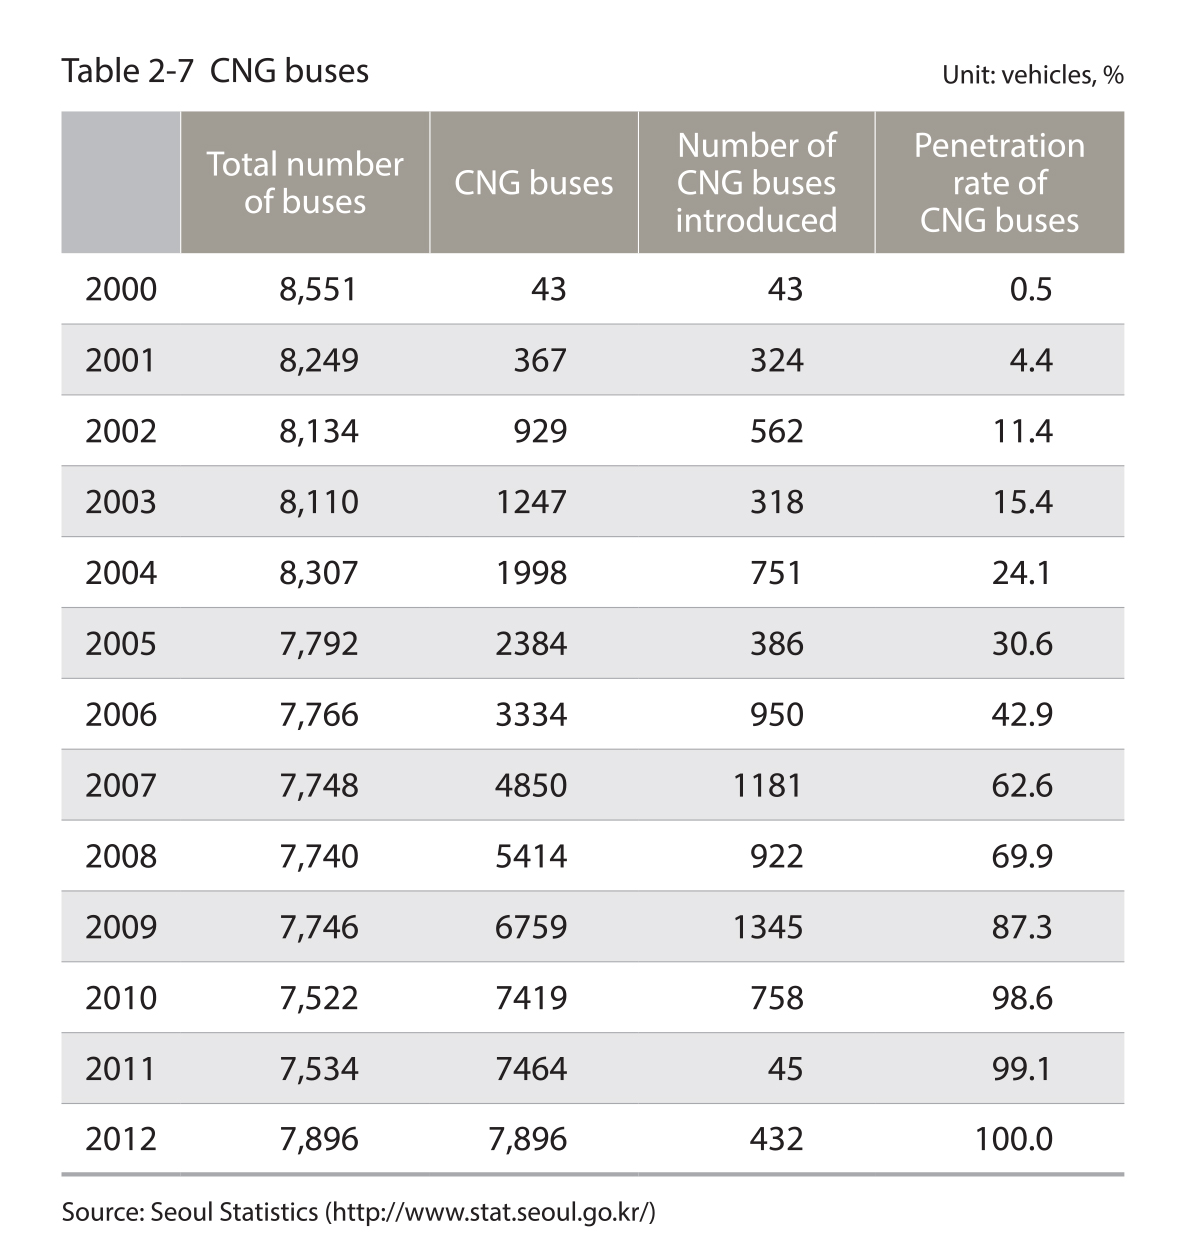
The natural gas bus penetration rate in Seoul is 100% (7,896 vehicles)
As part of the low-pollution project involving intra-city buses, with high service frequency in metropolitan cities, the Ministry of Environment took the initiatives to distribute buses running on compressed natural gas (CNG) starting in September 1999. The penetration rate of CNG buses increased every year starting from 0.5% in 2000, and reached 100% by 2012 with all 7,896 buses replaced with CNG buses.
Source : Seoul Statistics (http://www.stat.seoul.go.kr/)