
-
Economy
Industries in Seoul
-
1. The Industrial Structure
1.1. Number of Businesses and Workers
1.1.1. Number and Size of Businesses
88.9% of the businesses in Seoul in 2011 were of the service industry
The total number of businesses in Seoul in 2011 were 752,285, of which 675,943 businesses (89.9%) were in the service industry, 56,026 (7.4%) in manufacturing, 20,156 (2.7%) in construction, 114 (0.02%) in electricity, gas and waterworks, and 46 (0.01%) in agriculture, forestry and mining. With respect to the added value levels, the number of businesses was slightly lower in the service industry and higher in the manufacturing industry.
Expansion of the service and construction industries in the past 11 years
Among the industries, the size of the service industry increased by 2.3%p from 87.6% in 2000 to 89.9% in 2011, while the construction industry increased by 0.5%p from 22% to 2.7% in the same time period. On the other hand, the size of the manufacturing, electricity, gas and waterworks, and agriculture, forestry and mining industries decreased by -2.7%p, -0.01%p and -0.01%p, respectively, from 2000 to 2011. The number of businesses between 2000 and 2011 only increased in the service and construction industries by 0.6% and 2.0%, respectively, annually on average.
.jpg)
Source : Statistics Korea, Census on Establishments, KOSIS, corresponding year
1.1.2. Number of Workers
85.6% of workers in Seoul were in the service industry in 2011
There were a total of 4,498,312 workers working in the industries of Seoul in 2011. More Specifically, 3,851,243 (85.6%) were in the service industry, 359,900 (8.0%) in construction, 274,809 (6.1%) in manufacturing, 11.473 (0.3%) in electricity,gas and waterworks, and 887 (0.02%) in agriculture, forestry and mining. Based on the number of workers, the composition ratio of the construction industry was higher than that of the manufacturing industry, which contrasted with the composition ratios determined based on the number of businesses.
Based on the number of workers, the service and construction industries have grown in size in the past 11 years
The changes in the industrial structure of Seoul over the past 11 years examined based on the number of employees were similar to the changes examined based on the number of businesses. However, the extent of the changes in the service and construction industries was shown to be more significant when the changes were examined based on the number of workers. The composition ratios of the service and construction industries increased by 8.5%p and 1.4%p, respectively from 2000 to 2011. on the other hand, the composition ratios of the manufacturing, electricity, gas and waterworks, and agriculture, forestry and mining industries, based on the number of workers, decreased by -9.8%p, -0.1%p, and -0.03%p, respectively. The average annual rate of increase in the number of workers in each industry of Seoul from 2000 to 2011 was 3.1% for the service industry, 3.9% for construction, -6.4% for manufacturing, 0.3% for electricity, gas and waterworks, and -6.9% for agriculture, forestry and mining.
.jpg)
Source : Statistics Korea, Census on Establishments, KOSIS, corresponding year
1.2. Manufacturing Industry
Top 5 manufacturing areas accounted for 65.9% of the manufacturing industry, based on the number of businesses
The top 5 manufacturing areas in Seoul in 2011, determined based on the number of businesses, were found to be the manufacturing of sewn clothing and fur products (23.8%), publishing, printing and recorded media reproduction (12.6%), manufacturing of assembly metal products (10.2%), manufacturing of food and beverage (9.7%) and manufacturing of furniture and other products (9.6%). The number of businesses in these areas were shown to account for 65.9% of the total number of businesses in the entire manufacturing industry.
.jpg)
Source : Statistics Korea, Census on Establishments, KOSIS, corresponding year
Top 5 manufacturing areas accounted for 68.2% of the manufacturing industry, based on the number of workers
The top 5 manufacturing areas in Seoul in 2011, determined based on the number of workers, were found to be the manufacturing of sewn clothing and fur products (33.4%), manufacturing of electronic parts/components, computers, imaging, audio, communications and electric equipment (12.3%), publishing, printing and recorded media reproduction (9.9%), manufacturing of furniture and other products (6.6%), manufacturing of textiles (6.0%). The number of workers in these areas were shown to account for 68.2% of the total number of workers in the entire manufacturing industry.
.jpg)
Source : Statistics Korea, Census on Establishments, KOSIS, corresponding year
1.3. Service Industry
Expansion of services and weakening of the manufacturing function in Seoul
Based on the number of businesses, the service level of the industries of Seoul increased by 2.2%p from 87.6% in 2000 to 89.9% in 2011. On the other hand, the percentage of the manufacturing businesses decreased by 2.7%p. As a result, the number of service businesses is 12.1-times the number of manufacturing businesses in Seoul as of 2011.
Greater expansion of the service industry based on the number of workers
The proportion of workers in the service industry in Seoul increased by 8.5%p from 77.1% in 2000 to 85.6% in 2011. On the other hand, the ratio of the manufacturing workers decreased by 9.8%p in this time period. The gap between the ratio of the service workers in Seoul and the nation increased from 0.8%p (8.8%p) in 2000~2005 to 2.4%p (12.2%p) in 2006~2011. This indicates that the progress in service expansion and deteriorating manufacturing function of Seoul exceeded that of the nation, especially at an accelerated rate since the mid-2000s.
.jpg)
Source : Statistics Korea, Census on Establishments, KOSIS, corresponding year
.jpg)
Source : Statistics Korea, Census on Establishments, KOSIS, corresponding year
About 50% of the service businesses in Seoul are wholesale and retail, accommodations and F&B businesses
The top 5 service business areas in Seoul in 2011, determined based on the number of businesses, were wholesale and retail (32.0%), accommodations and food & beverage (17.7%), transportation (13.6%), other services (10.3%) and business services (6.0%). The top 5 service business areas have remained similar to those in the previous years except for the fact that the real estate and rental business, which had ranked No. 5 in 2000, dropped out of the top 5 rankings, whereas business services, which had ranked No. 6, was included in the top 5.
Number of service businesses, increasing in most business areas since 2000
The number of service businesses in Seoul has increased in the past 11 years, except for in the arts, sports and leisure-related services, public administration, national defense and social security administration, and wholesale and retail businesses. Particularly, it has increased an average annual rate of 221.% in the information and communications industry. The composition ratio of businesses increased in the information and communications, business service and education service sectors from 2000 to 2011. In contrast, the number of businesses in the No. 1 and 2 areas (wholesale and retail and accommodations and F&B) have decreased.
.jpg)
Source : Statistics Korea, Census on Establishments, KOSIS, corresponding year
The number of workers has increased in nearly all the service areas since 2000
The number of workers in the service industry, except in the arts, sports and leisure service area, has increased in Seoul over the past 11 years. Of particular note. the increase in the information and communications industry occurred at an average annual rate of 20.6% over the past 11 years. As for the cbanges in the composition ratio of the workers in 2011 compared to 2000. there was a significant increase in the business service and information and communications areas. In contrast, the proportion of the workers in the wholesale and retail businesses decreased considerably.
.jpg)
Source : Statistics Korea, Census on Establishments, KOSIS, corresponding year
1.4. Knowledge-based Industry
Gradual expansion of the knowledge-based industry in Seoul since 2000
The number of businesses in the knowledge-based industry increased by 1.3-fold from 75,866 in 2000 to 101,784 in 2011. Accordingly, the ratio of knowledge-based businesses to the total number of businesses industrywide in Seoul increased by 3.0%p from 10.5% in 2000 to 13.5% in 2011. The number of workers in the knowledge-based industry increased by 3.5% annually on average from 558,669 in 2000 to 817,550 in 2011 for a 1.5-fold increase. As a result, the ratio of the workers in the knowledge-based industry to the total number of workers industrywide in Seoul increased by 2.6%p from 15.6% in 2000 to 18.2% in 2011.
Expansion of the knowledge-based service industry and reduction in the knowledge-based manufacturing industry
The major industry contributing to the expansion of the knowledge-based industry was the service industry, not the manufacturing industry. The ratio of the knowledge-based service businesses (workers) to the total businesses increased steadily to 9.9% (12.7%) by 2000, 11.7% (14.8%) by 2005 and 13.1% (17-4%) by 2011. On the other hand, the ratio of the knowledge-based manufacturing businesses (workers) to the total businesses decreased to 0.6% (2.9%) by 2000, 0.5% (1.8%) by 2005 and 0.4% (0.8%) by 2011.
The knowledge-based industry of Seoul at No. 1 among 16 cities and provinces.
The knowledge-based industry was found to be concentrated mainly in the seoul Metropolitan Area with Seoul accounting for 13.5%, Gyeonggi Province 13.1% and Incheon 12.5% of the entire knowledge-based industries of 16 cities and provinces in 2011.
.jpg)
Source : Statistics Korea, Census on Establishments, KOSIS, corresponding year
Over 95% of the knowledge-based industry in Seoul is knowledge-based service industry
96.7% of the knowledge-based industry businesses and 95.8% of the knowledge-based industry workers were in the service industry in 2011. On the other hand, the knowledge-based manufacturing businesses and workers only accounted for 3.3% and 4.2%, respectively. In Seoul, over 60% of the knowledge-based service industry consisted of logistics and corporate support service industries, while over 50% of the knowledge-based manufacturing industry consisted of electronics and information devices and mechatronics.
.jpg)
Source : Statistics Korea, Census on Establishments. KOSIS, 2011
.jpg)
Source : Statlstlcs Korea, Census on Establishments. KOSIS, 2011
2. Characteristics of the 6 Key Strategic Industries
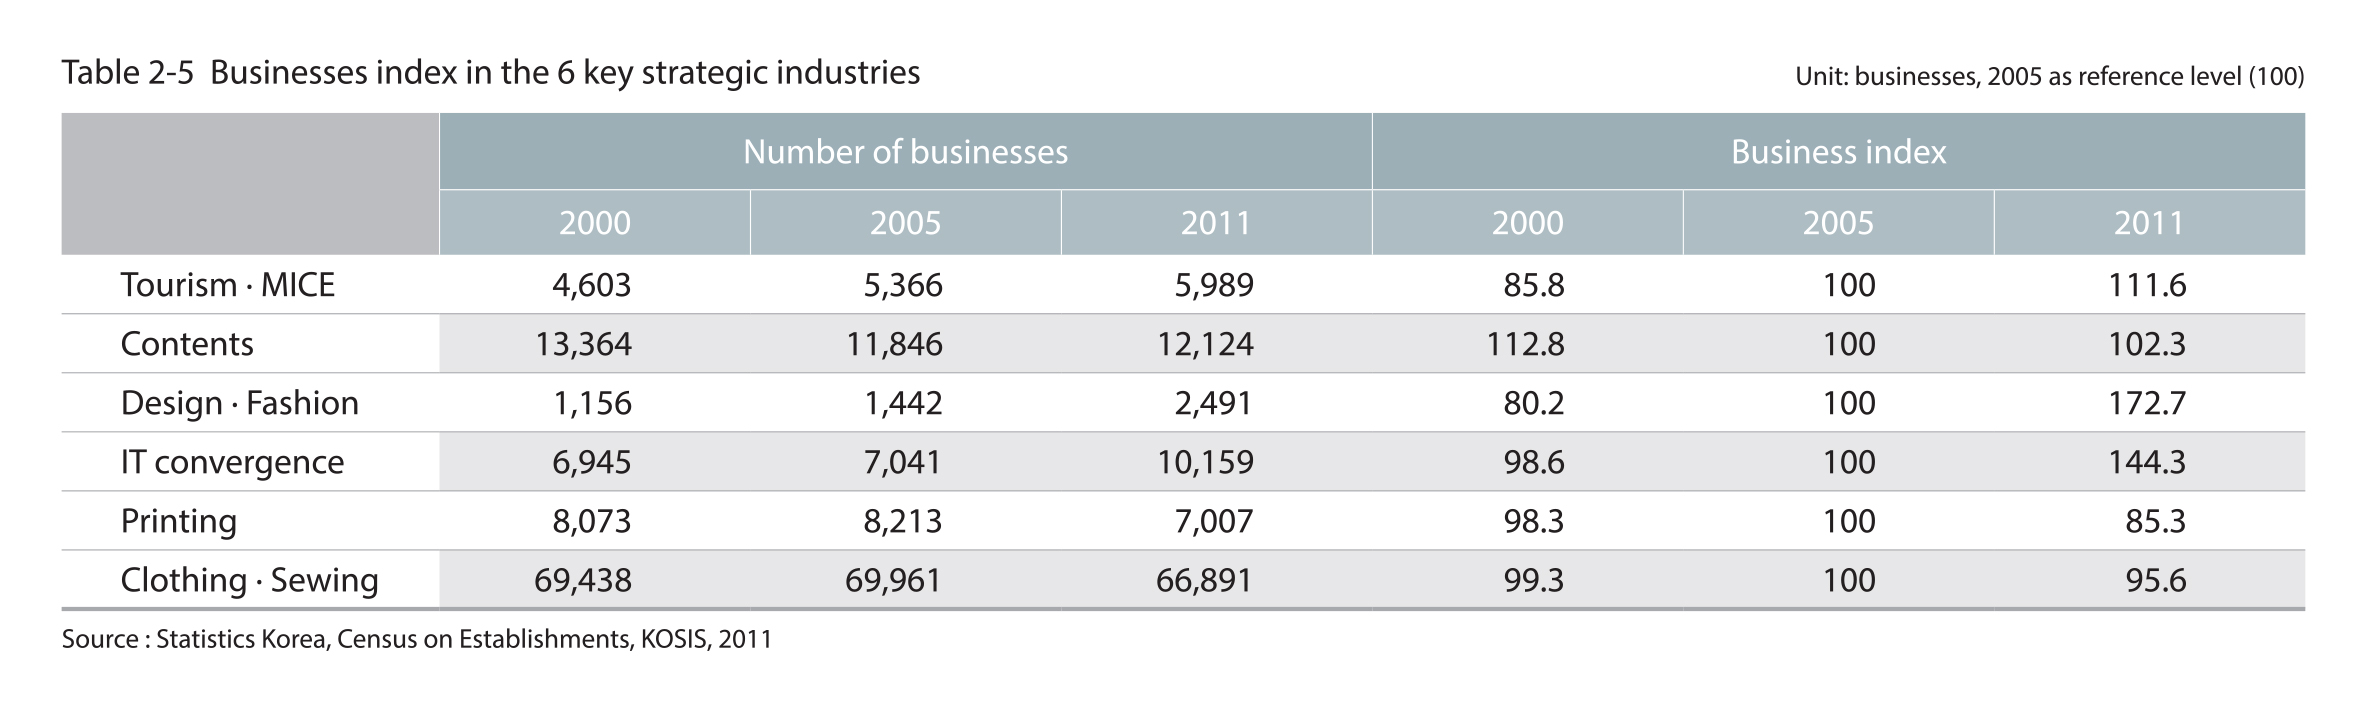
The 6 key strategic industries are tourism-MICE, contents, design-fashion, IT convergence, printing, and clothing-sewing
From the top 8 new growth engine industries presented in Seoul’s Economic Vision 2020 and the 4 major urban manufacturing industries, 6 key strategic industries (tourism-MICE, contents, design-fashion, IT convergence, printing, and clothing-sewing) were chosen, taking into account the policy direction of Seoul, future growth potential and association with the creative economy.
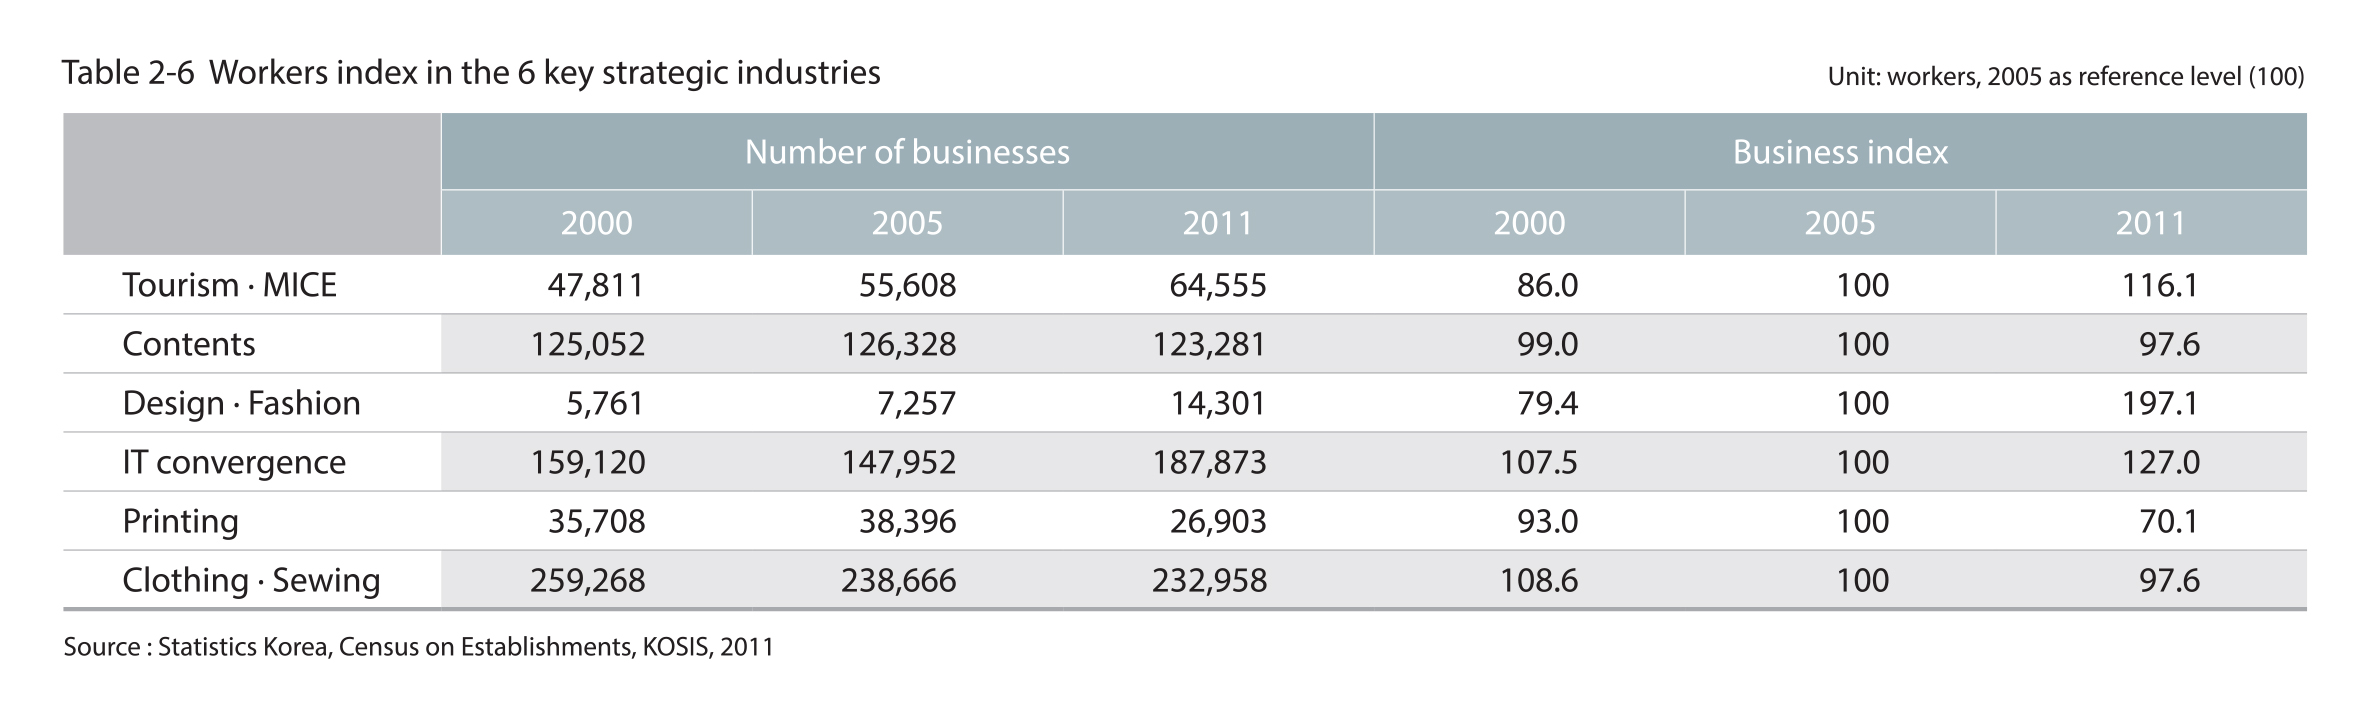
Rapid growth of the design-fashion industry among the 6 key strategic industries
Over the past 10 years, the number of businesses and workers grew in the tourism-MICE, contents, design-fashion and IT convergence industries, whereas the urban manufacturing industries such as printing and clothing-sewing suffered a decline. Of particular note, the number of businesses and workers in the design-fashion industry grew by 100%p.
Source : Statistics Korea, Census on Establishments. KOSIS, 2011
Source : Statistics Korea, Census on Establishments. KOSIS, 2011