
-
Economy
The Economy of Seoul
-
1. The Economy Based on Indices
1.1. Gross Regional Domestic Product (GRDP)
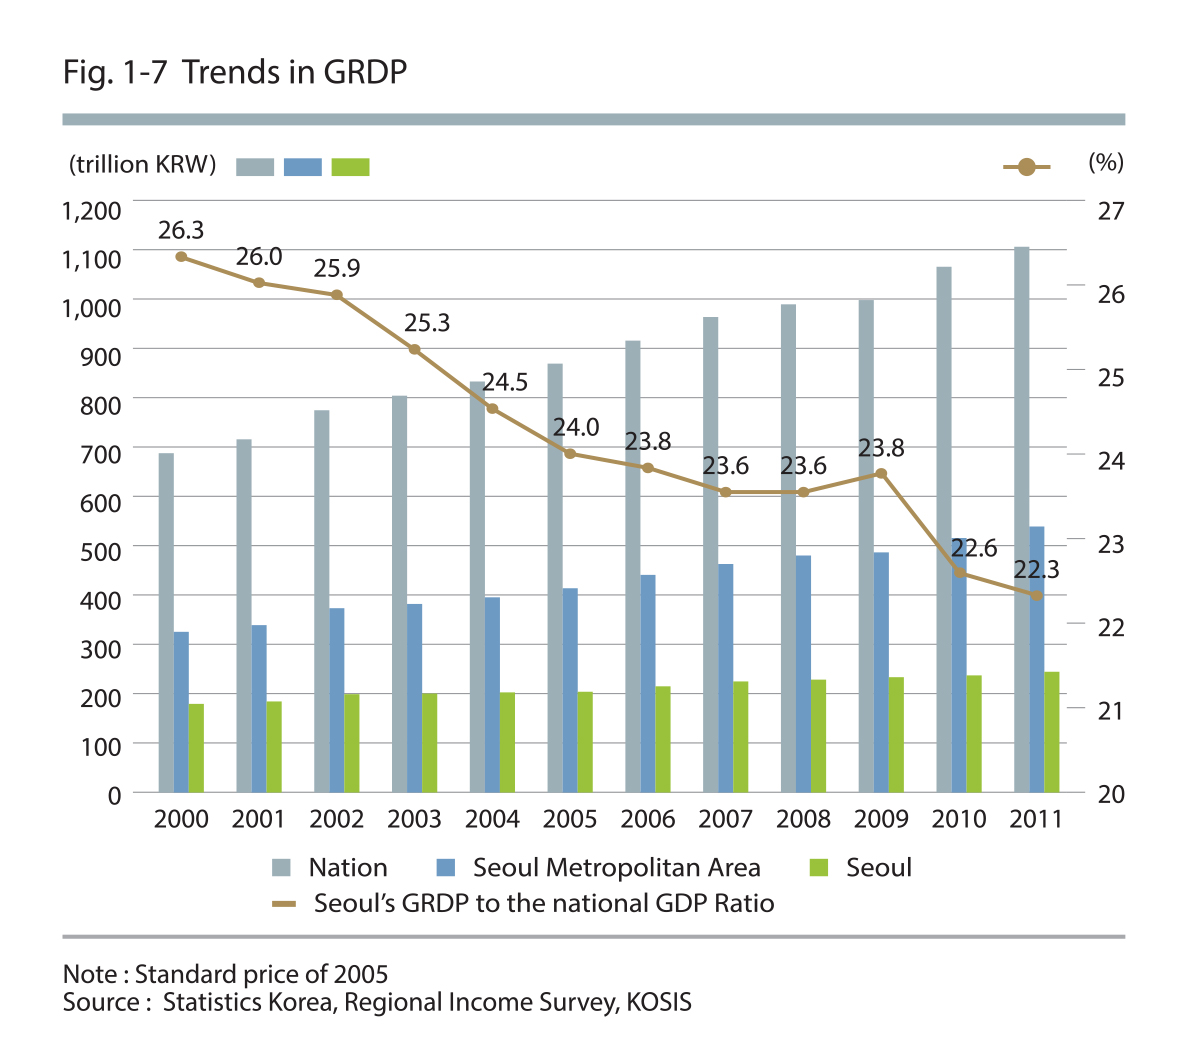
GRDP of Seoul increased at an average annual rate of 2.0% for 3 years and was recorded at 247 trillion KRW in 2011
The gross regional domestic product (GRDP) of Seoul (based on the standard price of 2005) increased at an average annual growth rate of 2.8% from 182.2 trillion KRW in 2000 to 247.0 trillion KRW in 2011. This is 1.6%p lower than the national GDP’s average annual growth rate of 4.4% and 1.8%p lower than 4.6%, the average annual growth rate of the GRDP of the Seoul Metropolitan Area. Accordingly, the proportion of GDP accounted for by Seoul decreased from 26.3% in 2000 to 22.3% in 2011. Of particular note, there has been a prolonged period of low growth, evidenced by the fact the average annual growth rate of GRDP of Seoul in the last 3 years stayed at 2.0%, due to the decline in domestic consumption and global economic recession.

Source : Statistics Korea, Regional Income Survey, KOSIS (2000, 2011)
1.2. Final Consumption Expenditure
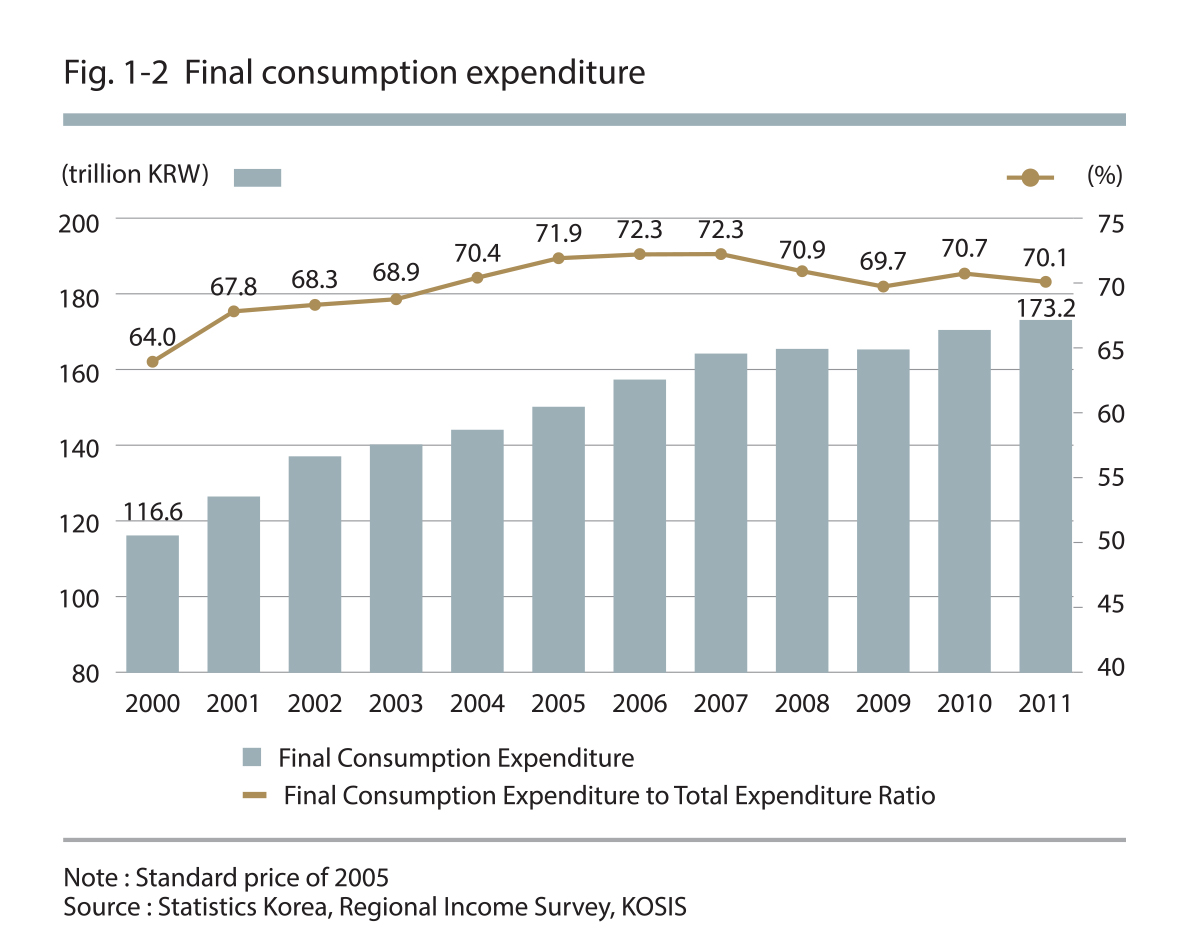
The final consumption expenditure in Seoul was 173.2 trillion KRW, accounting for 70.1% of the total expenditure, as of 2011
The final consumption expenditure, accounting for the most significant part of the total expenditure in Seoul, increased by 3.7% on average annually from 116.6 trillion KRW in 2000 to 173.2 trillion KRW in 2011. This is 1.9%p higher than 2.8%, the growth rate of the GRDP of Seoul within the same period, and this shows that the increase in consumption was higher than the increase in production.
Source : Statistics Korea, Regional Income Survey, KOSIS
1.3. Net Shipping-out of Goods and Services
The net shipping-out from Seoul is 25.0 trillion, accounting for 10.1% of the total expenditure, as of 2011
The net shipping-out of goods and services from Seoul was 25.0 trillion as of 2011. This means that the volume of goods and services being shipped out of the region was higher than that being shipped into the region. In other words, one-tenth of the total expenditure was shipped out of the region, and a significant amount of consumption in Seoul was dependent not only on the local demand but also the demand outside the region.
Positive net shipping-out from Seoul and continued shipping-out
The net shipping-out in Seoul has been a positive value since 2000. The net shipping-out value, which slightly declined with the economic recovery in 2000, increased substantially during the 2009 financial crisis, and it accounts for about 10% of the total expenditure in Seoul at present.

Source : Statistics Korea, Regional Income Survey, KOSIS
1.4. Added Value by Industry
The added value generated in Seoul was 220.9 trillion KRW as of 2011 and the tertiary industry accounts for 91.3%
In 2011, the added value generated in Seoul (standard price of 2005) was 220.9 trillion KRW, of which 0.2% arose from the primary industry, 8.6% from the secondary industry and 91.3% from the tertiary industry. The added value generated in the tertiary industry of Seoul increased by 3.1% annually on average from 143.4 trillion KRW in 2000 and 201.6 trillion KRW in 2011. This was 0.3%p higher than the total GRDP growth rate of Seoul(2.8%), and this shows that the growth rate of the tertiary industry was higher than that of other industries.
The average annual rate of increase in the added value of the tertiary industry of Seoul was 3.1 %, which was O.8%p lower compared to that of the nation
The average annual rate of increase (from 2000 to 2010) in the added value of the tertiary industry of Seoul was 3.1%, which was 0.8%p and 1.0%p lower compared to that of the nation (3.9%) and the Seoul Metropolitan Area (4.1%). However, as described earlier, considering that the GRDP growth rate in other regions was substantially higher than Seoul, the growth rate of the tertiary industry of Seoul was far ahead of other regions.

Source : Statistics Korea, Regional Income Survey, KOSIS
2. The 5 Main Characteristics of the Economy
The economic situation in Seoul is characterized by three "lows" (low growth, low investment and low prices) and two "highs" (high unemployment rate and high debt). These phenomena are expected to continue for an indefinite amount of time due to the global economic recession and the low growth of the national economy as a result of the growing economic uncertainties.
2.1. Low Growth
2.1.1. Continued Trend of Low Growth
Poor resilient growth due to the domestic economic slowdown
Economic growth means a steady rise in the production of goods and services resulting from increased productivity and market expansion, etc. The global economic recession resulting from the 2008 U.S. financial crisis and the 2009 European financial crisis has played a factor in the general unrest and anxiety in relation to the economic outlook. Accordingly, exports and domestic consumption have declined simultaneously and the low growth of the domestic economy has been continuing on. Of particular note, Seoul, which is heavily dependent on the service industry, has shown considerably low growth compared to other regions of Korea, with poor resilient growth.
Source : Statistics Korea, Regional Income Survey, KOSIS
2.1.2. GRDP
The average annual increasing rate in the GRDP of Seoul was low at 2.8%
The average annual increasing rate in the GRDP of Seoul (from 2000 to 2011) was 2.8%, which was 1.6%p and 1.8%p lower than that of the nation (4.4%) and the Seoul Metropolitan Area (4.6%). The rate of increase in the GRDP of Seoul has been lower than that of the nation and the Seoul Metropolitan Area for the most of the time period since 2000. Of particular note, the gap was over 3.0%p in 2004 and 2010, indicating sluggish economic growth.
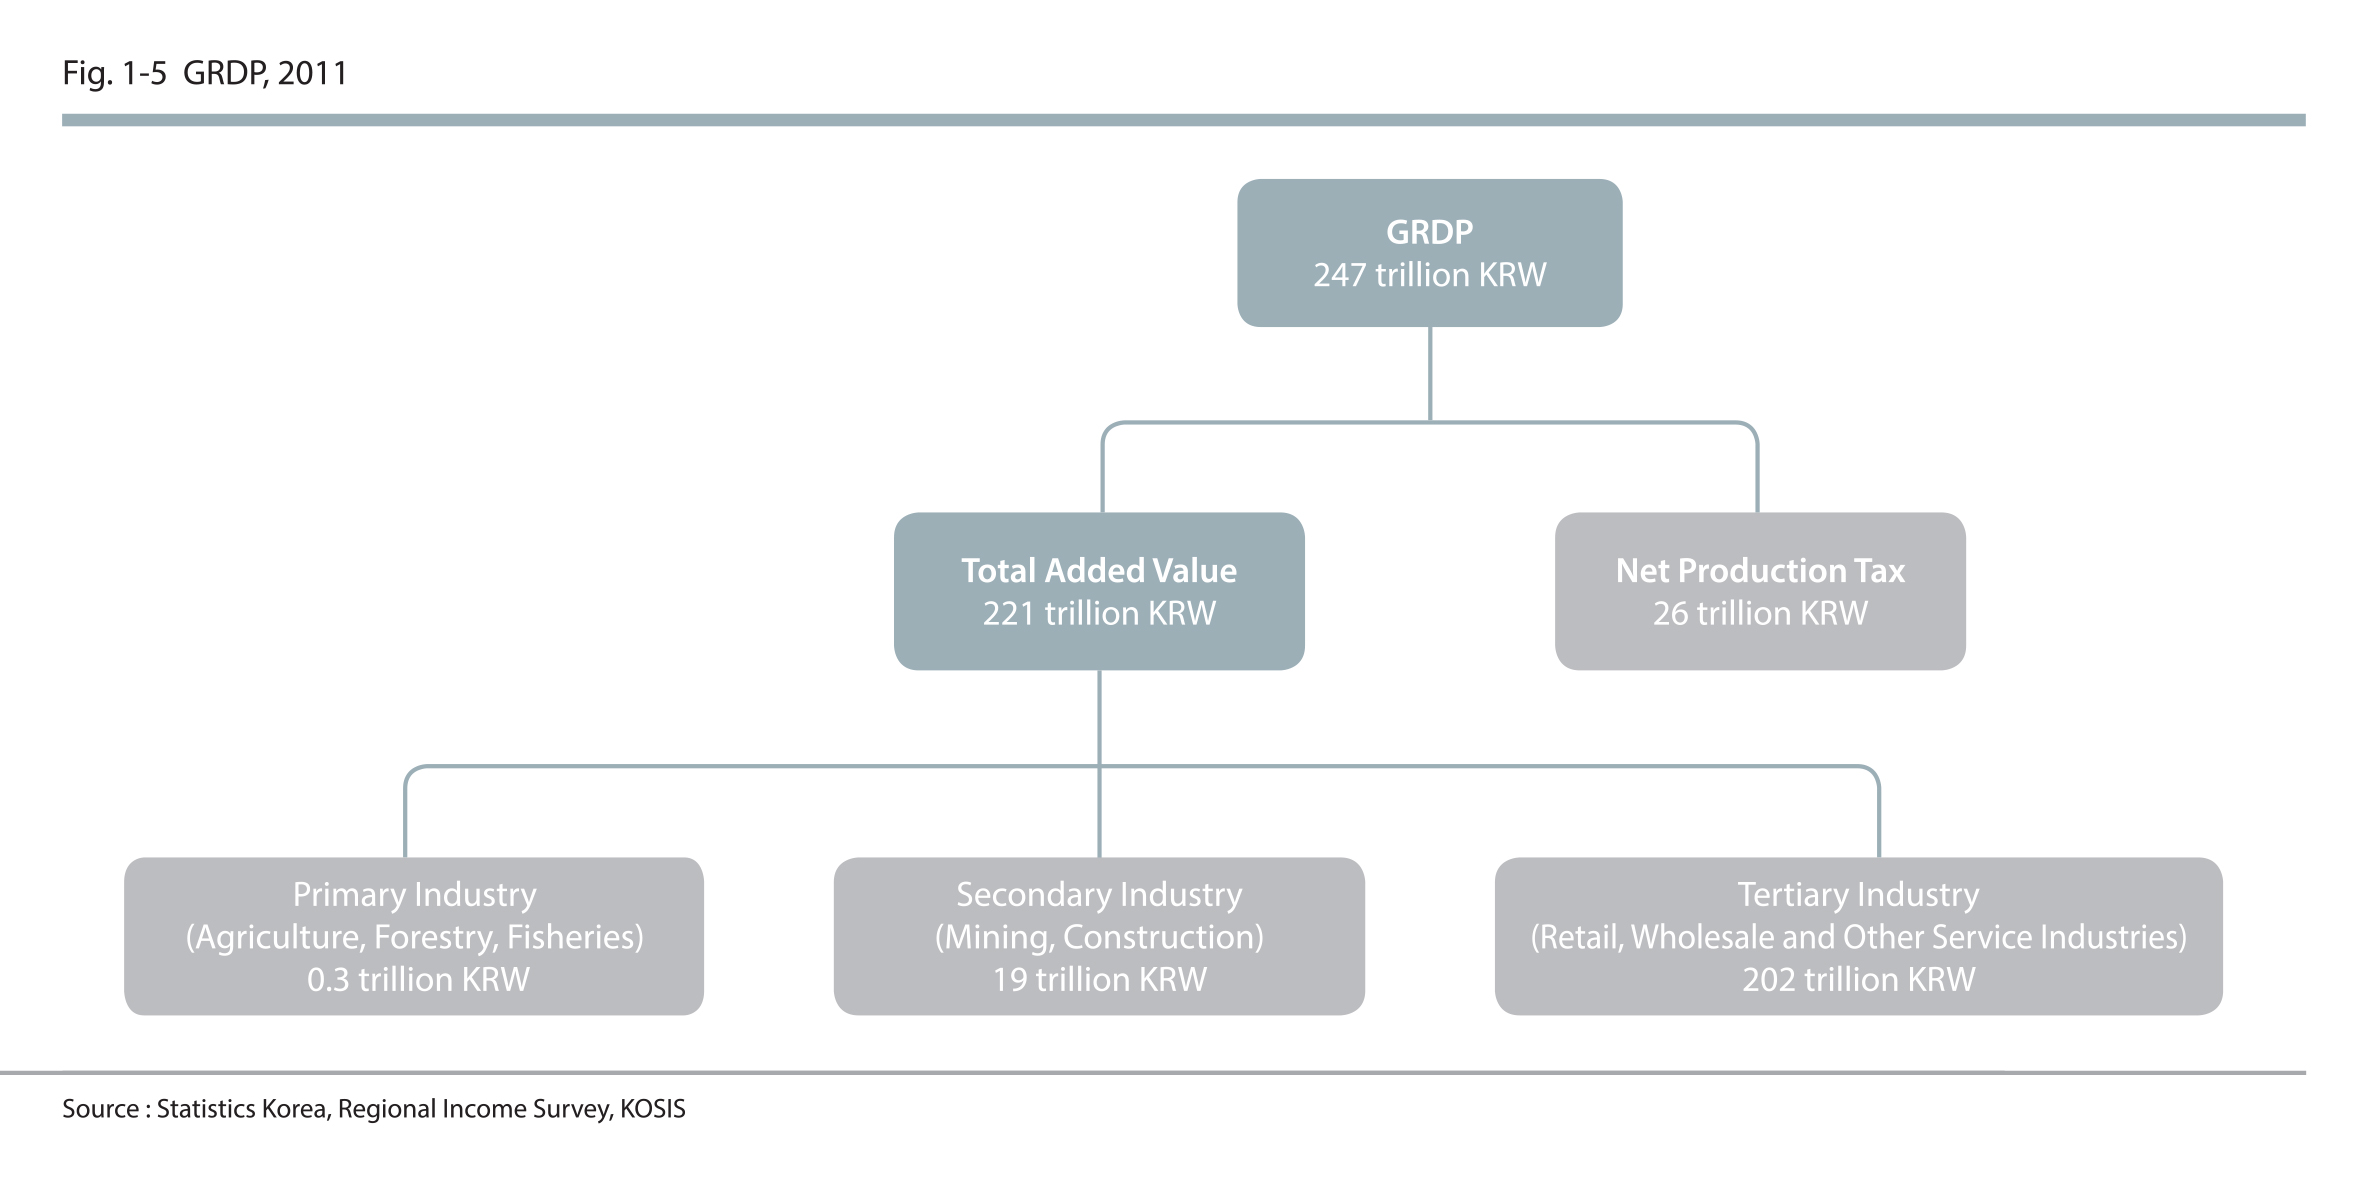
The GRDP of Seoul was 247.0 trillion KRW in 2011, with the wholesale and retail industries accounting for 16.7%
In 2011, the GRDP of Seoul was 247.0 trillion KRW (standard price of 2005), comprised of 220.9 trillion KRW in total added value and 26.1 trillion KRW in net production taxes. The industry accounting for the biggest portion of the total added value generated in Seoul was the wholesale and retail industry (36.8 trillion KRW), which generated 16.7% of the total added value. It was followed by financial and insurance (16.6%), information and communications (11.4%), and business service (11.3%) industries.
The amount of GDP contributed by Seoul has been dropping since 2000
Although the GRDP of Seoul has continually been on the rise, its impact has been decreasing as its rate of increase is lower than that of other regions in the nation. The GRDP of Seoul increased at an annual rate of 2.8% on average from 182.2 trillion KRW in 2000 to 247.0 trillion KRW in 2011. on the other hand, the GDP of Korea increased at an average annual rate of 4.4% from 691.5 trillion KRW in 2000 to 1,105.9 trillion KRW in 2011. Accordingly, the amount of the national GDP contributed by Seoul decreased by 4.0%p from 26.3% in 2000 to 22.3% in 2011. Of particular note, there was a drop from 23.8% in 2009 to 22.3% in 2011 due to the recent economic downturn.

Source : Statistics Korea, Regional Income Survey, KOSIS
Source : Statistics Korea, Regional Income Survey, KOSIS
2.2. Low Investment
2.2.1. Stagnant Investment Incl. R&D Expenditures, etc.
Seoul’s investment into the knowledge-based industries is relatively stagnant
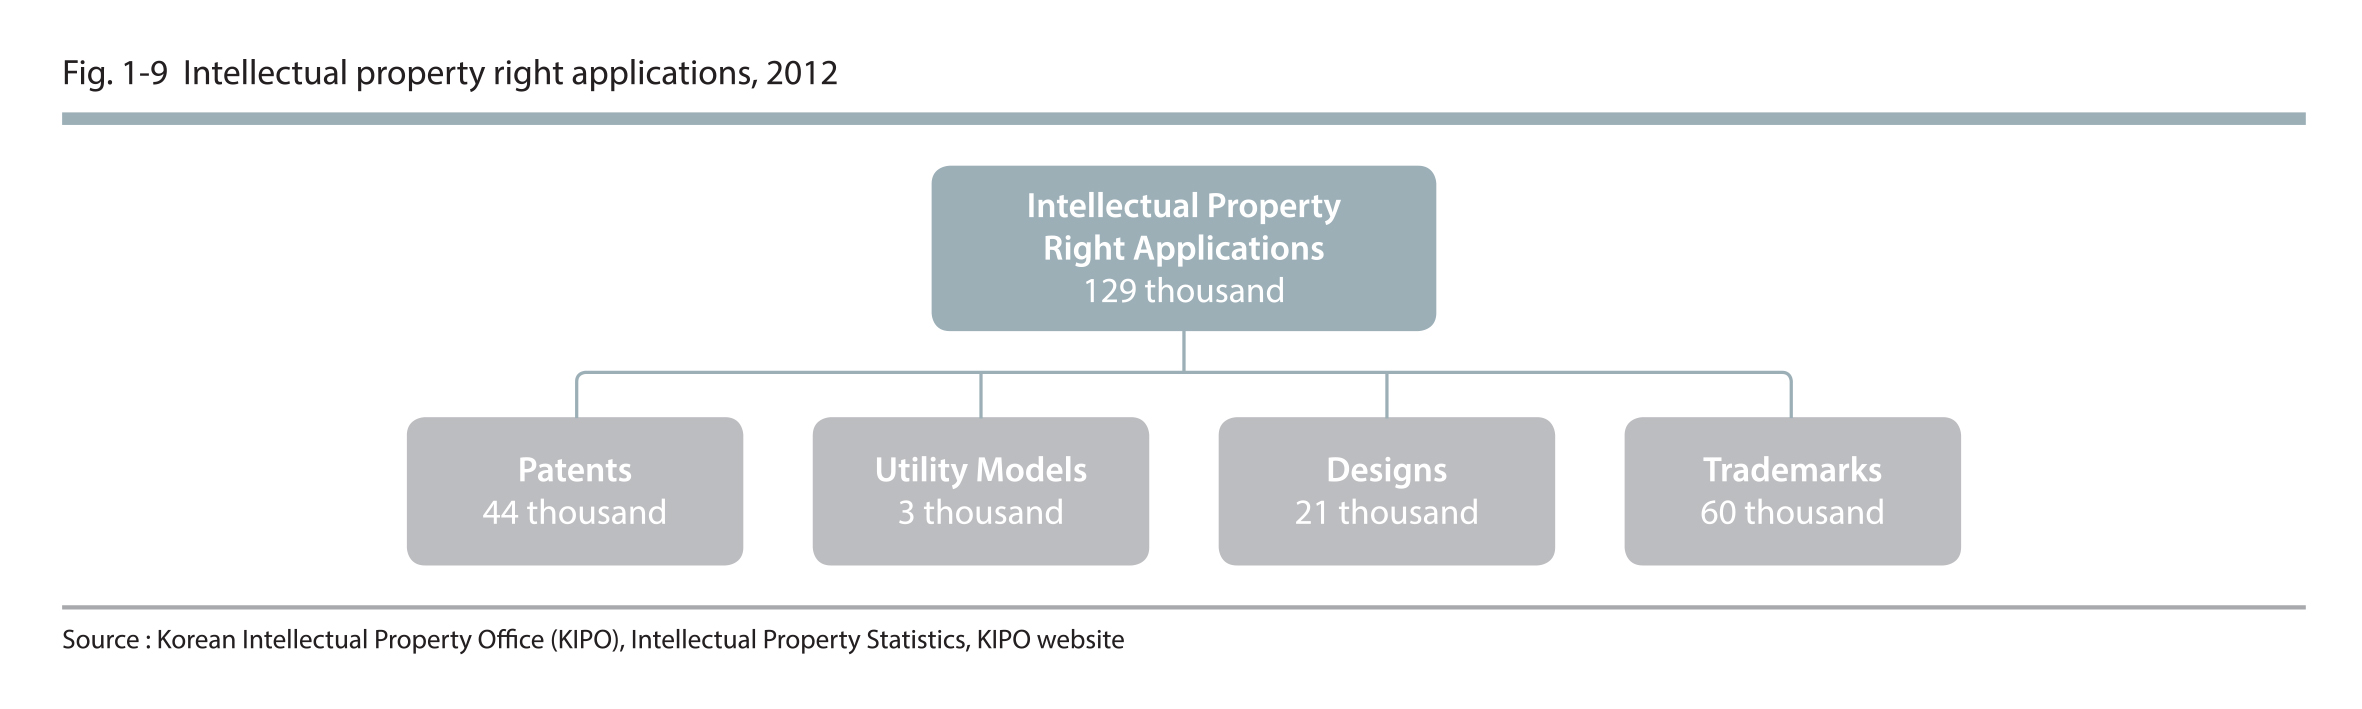
The R&D expenditure (9.2 trillion KRW) in Seoul in 2011 accounted for 18.5% of the national R&D expenditures. The number of patent applications (44,000) filed from Seoul in 2012 accounted for 30.0% of the total patent applications in the nation.In comparison, the R&D expenditure of Seoul increased at an average annual rate of merely 6.7% (2000 to 2011), which was 5.7%p lower than the nation (12.4%). Additionally, the number of patent applications filed from Seoul increased at an average annual rate of 6.9% (2000 to 2012), and this was also lower than the nation (8.4%) by 1.5%p.

Source : Ministry of Science, ICT and Future Planning, R&D Activity Survey, KOSIS
Source : Korean Intellectual Property Office (KIPO), lntellectual Property Statistics, KIPO website
2.2.2. R&D Expenditure
The R&D expenditure in Seoul in 2011 was 9.2 trillion, accounting for 18.5% of the national R&D expenditure
The R&D expenditure in Seoul in 2011 was 9.2 trillion, accounting for 18.5% of the national R&D expenditure, which stood at 49.9 trillion KRW. The R&D expenditure in Seoul increased rapidly at an average annual rate of 6.7% from 4.5 trillion KRW in 2000 to 9.2 trillion KRW in 2011, but this was 5.7% and 6.2%p lower than that of the nation (12.4%) and the Seoul Metropolitan Area (12.9%), respectively.
The ratio of Seoul's R&D expenditure to the national R&D expenditure fell from 32.7% in 2000 to 18.5% in 2011
Although the absolute R&D expenditure in Seoul increased, its ratio to the national R&D expenditure has been decreasing as the R&D expenditures in other regions have been increasing at a faster rate. Accordingly, the ratio of Seoul's R&D expenditure to the national R&D expenditure fell from 32.7% in 2000 to 18.5% in 2011. On the other hand, the ratio of the R&D expenditure in the Seoul Metropolitan Area to the national R&D expenditure was fairly high at 63% due to the high rate of increase in the R&D expenditure in Gyeonggi Province (average annual rate of increase of 17.9%).

Source : Ministry of Science, ICT and Future Planning, R&D Activity survey, KOSIS
2.2.3. Number of Patent Applications
44,000 patent applications filed in Seoul in 2012, accounting for 30.0% of that of the nation
In 2012, 44,000 patent applications were filed from Seoul, and this accounted for 30.0% of all the patent applications filed nationwide (148,000). The number of patent applications in Seoul increased at an average annual rate of 6.9% (2000 to 2012), which was 1.5%p lower than that of the nation (8.4%) and similar to that of the Seoul Metropolitan Area (6.9%). While the number of patent applications in Seoul had increased in 2000 and onward, it dropped slightly to 51,000 in 2005 and has remained steady at around 43,000.
The ratio of patent applications in Seoul to that of the nation decreased from 45.1% in 2000 to 30.0% in 2012
While the number of patent applications in Seoul has remained stagnant since 2005, the number of patent applications in the nation has been increasing annually. Accordingly, the ratio of patent applications in Seoul to that of the nation has dropped from 45.1% in 2000 to 30.0% in 2012. The composition ratio of patent applications in the Seoul Metropolitan Area has also been falling, reaching 79.3% by 2005 and 63.9% by 2012. This slump is deemed to have resulted from the increased number of patent applications filed from other regions of the country such as Daejeon (KAIST) and Gyeongsangbuk-do Province (POSTECH).

Source : Korean Intellectual Property Office, Intellectual Property Statistics. KIPO website
2.3. Low Prices
2.3.1. Price Stabilization Resulting from Economic Slowdown
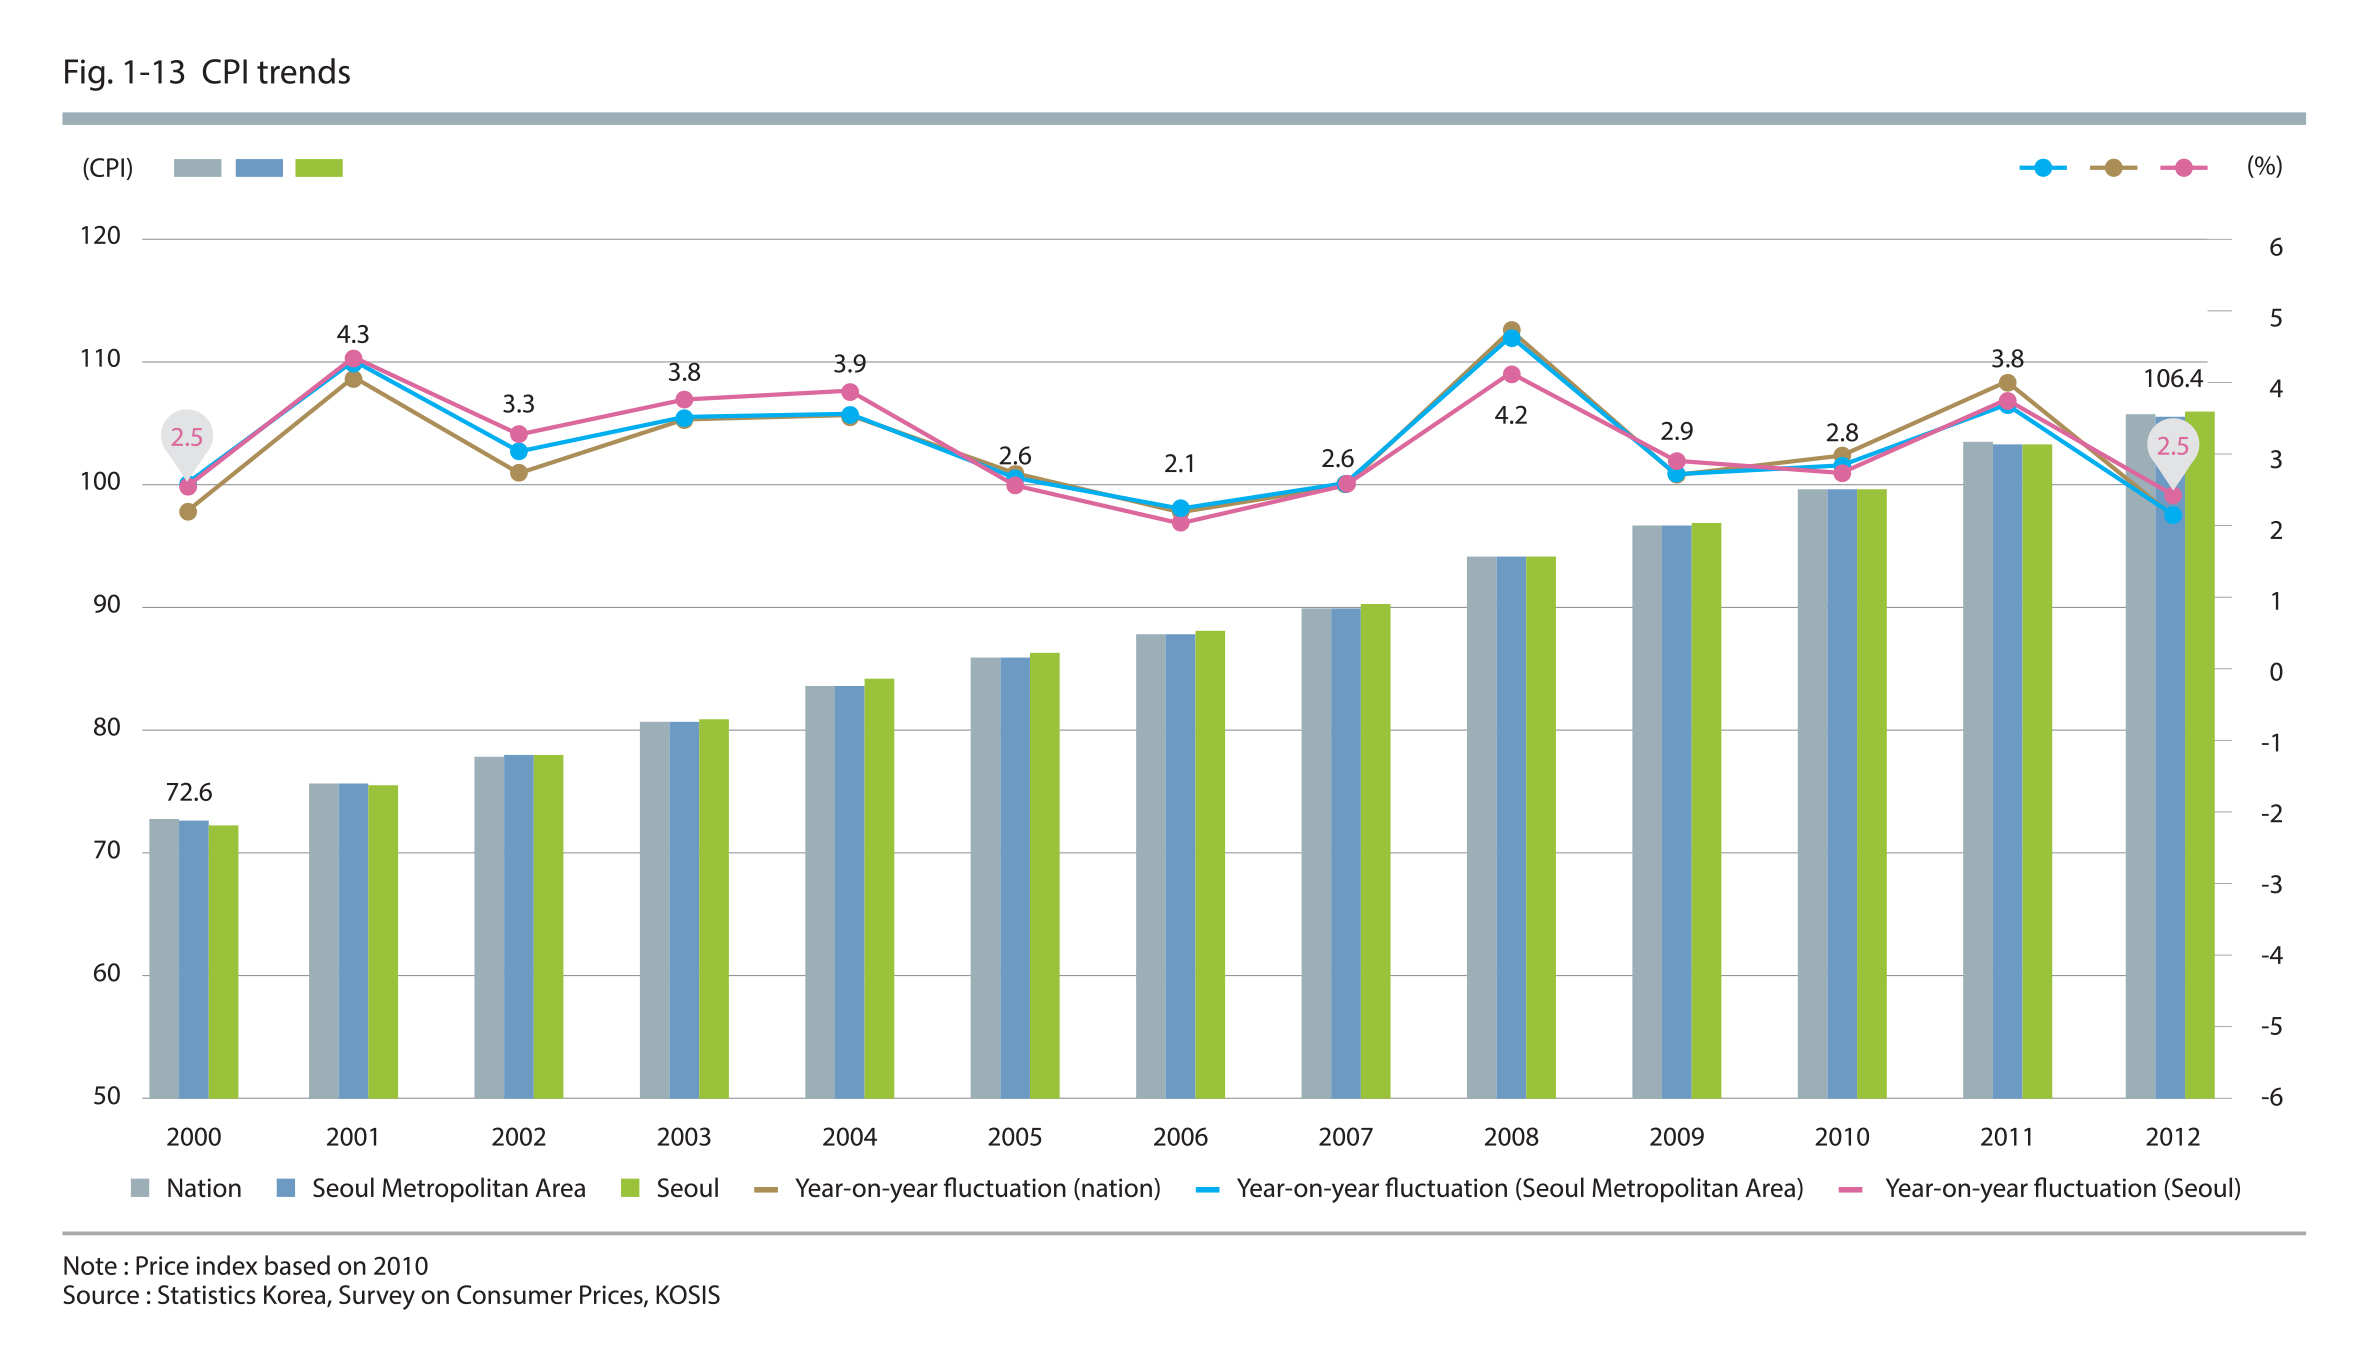
The consumer price index in Seoul was 106.4 in 2012, with the prices of goods exceeding the prices of services
The consumer price index (based on 2010) in Seoul was 106.4 in 2012, with the goods price index and the service price index measured to be 108.7 and 104.8, respectively. Of the goods, agricultural and livestock goods and electricity, water and gas price indices exceeded 111.0, while rent price index among services was found to be high at 108.7%. The Consumer Price Index (CPI) in Seoul was 0.5p higher than the CPI for living expenses (105.9) in 2012 and 5.8p lower than the producer price index (112.2).
, 2012.jpg)
Source : Statistics Korea, Survey on Consumer Prices, KOSIS
2.3.2. Consumer Price Index (CPI)
CPI of Seoul in 2012 was 106.4, which was 0.1p higher than that of the nation
The consumer price index(CPI) of Seoul was 106.4, which was 2.5% higher compared to the previous year. This was 0.lp and 0.4p higher than the CPI of the nation (106.3) and the Seoul Metropolitan Area (106.0), respectively. The average CPI in the period of analysis (2000 to 2012) was 89.2, which surpassed the average CPI of the national (89.1) and the Seoul Metropolitan Area (89.0) in the same period.
CPI of Seoul increased by 3.2% on average annually since 2000
The consumer price index (CPI) of Seoul increased steadily from 72.6 in 2000 to 106.4 in 2012, with an average annual fluctuation rate of 3.24 (2000 to 2012). This falls within the stable price range (2.5 to 3.5%) set forth by the Bank of Korea. The CPI of Seoul surged at a rate of 4% in 2001 and 2008, but the average fluctuation rate for the past 3 years (2010 to 2012) has been stable at 3.15.
Source : Statistics Korea, Survey on Consumer Prices, KOSIS
2.3.3. CPI for Living Expenses
CPI for living expenses was 105.9 in 2012, which was O.39p lower than the CPI
The CPI for living expenses, which consists of 142 items that are frequently bought, make Up a large portion of expenditure, and is sensitive to price change. The CPI for living expenses increased by 3.63% annually on average for 69.0 in 2000 to 105.9 in 2012, and this was 0.39%p lower than the CPI f1uctuation rate of 3.24%. However, the CPI for living expenses (based on 2010) in 2012 was 105.9. which was 0.5p lower than the CPI of 106.4 and was shown to have become stabilized.
CPI for living expenses, becoming stabilized compared to the previous year
The fluctuation rate of the CPI for living expenses in Seoul compared to the previous year exceeded the fluctuation rate of the general CPI and it fluctuated in a similar pattern. From 2000 to 2008, except one year, the fluctuation rate of the CPI for living expenses exceeded that of the CPI between 2000 and 2008, except in one year. The rate of increase in the average CPI for living expenses in the recent 3 years (2010 to 2012) was 2.4%p lower than the rate of increase in the CPI (3.15%) within the same period and it was shown to have become stable.

Source : Statistics Korea, Survey on Consumer Prices, KOSIS
2.4. High Unemployment Rate
2.4.1. Intensification of the Unemployment Problem
The economically active population in Seoul in 2012 was 5.26 million (95.8% employed, 4.2% unemployed)
Although more than half of the employed population in Seoul are male workers (56.3%), the composition ratio of the female workers has been on the rise. The majority of the people in the economically active population are aged between 30 and 59 (71.9%). On the other hand, the number of people aged between 15 and 29 in the economically active population has been decreasing.

Source : Statistics Korea, Survey on Economically Active Population, KOSIS
2.4.2. Economic Activity Rate
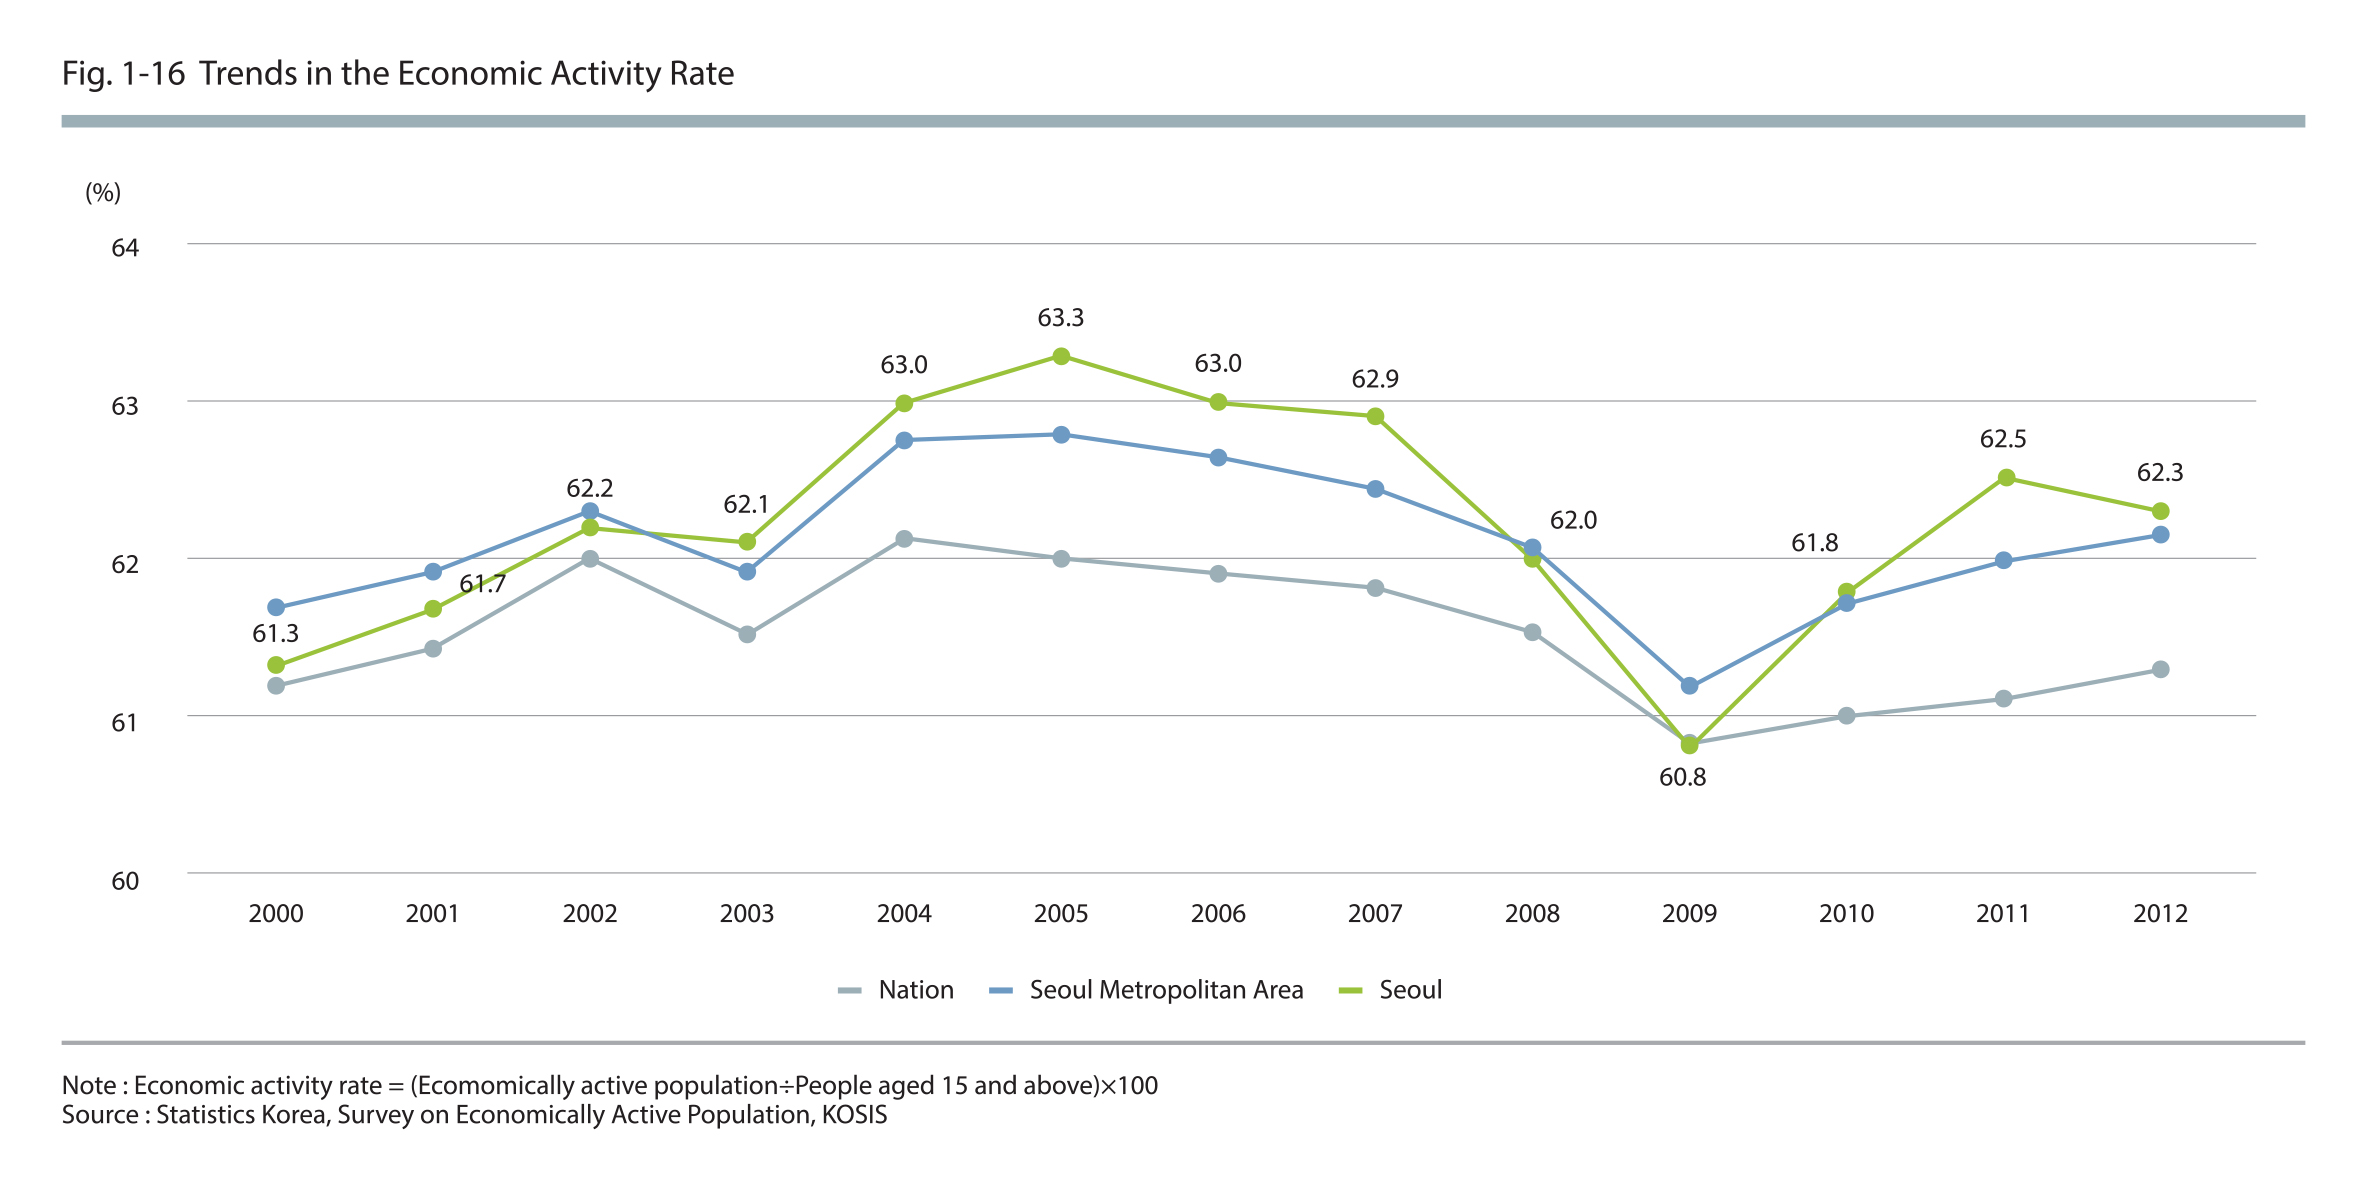
The economic activity rate in Seoul in 2012 was 62.3%
The economic activity rate in Seoul in 2012 was 62.3%, which means that every two out of three people aged 15 and above are employed or seeking jobs. This is 1.0%p and 0.2%p higher than the economic activity rate of the nation (61.3%) and the Seoul Metropolitan Area (62.1%) in 2012, and it implies that the demand for the work force is higher in Seoul compared to other regions. In the time period under analysis (2000 and 2012), the average economic activity rate in Seoul was found to be 62.2%, which also exceeded that of the nation (61.5%) and the Seoul Metroplitan Area (62.1%) by 0.6%p and 0.1%p, respectively.
The economic activity rate in Seoul fluctuated more than other regions
The economic activity rate in Seoul rose until 2005 before steadily declining until the 2009 financial crisis when it dropped to 60.8%. The difference between the economic activity rates at its peak (2005, 63.3%) and its lowest point (2009, 60.8%) was 2.S%p, which was comparatively more significant compared to that of the nation (1.3%p) and the Seoul Metropolitan Area (1.5%P).
Source : Statistics Korea, Survey on Economically Active Population, KOSIS
2.4.3. Employment Rate and Unemployment Rate
The employment rate in Seoul was 59.7%, O.3%p higher than that of the nation
The employment rate in Seoul in 2012 was 59.7%, which was 0.3%p higher than that of the nation (59.4%). This means that a larger percentage of Seoul's population was employed compared to the nation, and that the employment capacity of Seoul was fairly good in comparison. The employment rate in Seoul has been fluctuating according to the economic fluctuations, in a similar pattern as the labor force participation rate. The employment rate in Seoul, which has generally increased until 2007, exceeded the employment rate of the nation, but it fell in 2008. After recording its lowest point at 58.1% in 2009, it has been recovering since.

Source : Statistics Korea, Survey on Economically Active Population, KOSIS
The unemployment rate in Seoul was 4.2%, O.3%p higher than that of the nation
The unemployment rate in Seoul in 2012 was 4.2%, and it also exceeded that of the nation (3.6%) by 0.6%p. The reason the employment and unemployment rates in Seoul are exceeded those of the nation was the labor force participation rate. Due to the high demand in employment, surpassing that of the nation, a high unemployment rate was observed and an imbalance in the employment mark results. The unemployment rate in Seoul fluctuated around 4.5% during the analysis period, and it was shown to exceed the unemployment rates of the nation and the Seoul Metropolitan Area, regardless of the economic circumstances.

Source : Statistics Korea, Survey on Economically Active Population, KOSIS
2.5. High Debt
2.5.1 Increased Household Debts Due to Housing Loans
The national household debt in 2012 amounted to 964 trillion KRW, which is about 80% of the GDP
90% of the national household debt were household loans (906 trillion KRW), of which loans (660 trillion KRW) from depository financial institutions accounted for 60%. On the other hand, 60% of the household loans from the depository financial institutions were mortgage loans for housing (404 trillion KRW)

Source : Bank of Korea, Currency Finance Statistics, KOSIS
2.5.2. Household Loans
Household loans in Seoul amount to 203.3 trillion KRW, about 80% of the GRDP
The household loans provided by the depository financial institutions of Seoul amounted to 203.3 trillion KRW in Seoul and this was about 80% of the GRDP of Seoul, standing at 247.0 trillion KRW (standard price of 2005). The average annual fluctuation rate of household loans in Seoul (2007 to 2012) was 4.3%, which was 2.2%p higher than the average annual fluctuation rate of GRDP (2007 to 2011), standing at 2.1%. However, this was 2.5%p and 2.1%p lower than the average annual fluctuation rate of household loans in the nation (6.8%) and the Seoul Metropolitan Area, respectively.
The household loan fluctuation rate in Seoul has decreased since 2000
The household loan fluctuation rate has continually declined after reaching 7.7% in 2008, and for the first time in 2012, it showed a minus growth of -0.5%. This is deemed to have resulted from a reduction in the housing loans due to the sluggish real estate market.

Source : Bank of Korea, Currency Finance Statistics, KOSIS
2.5.3. Housing Loans and Deposit Bank Loans
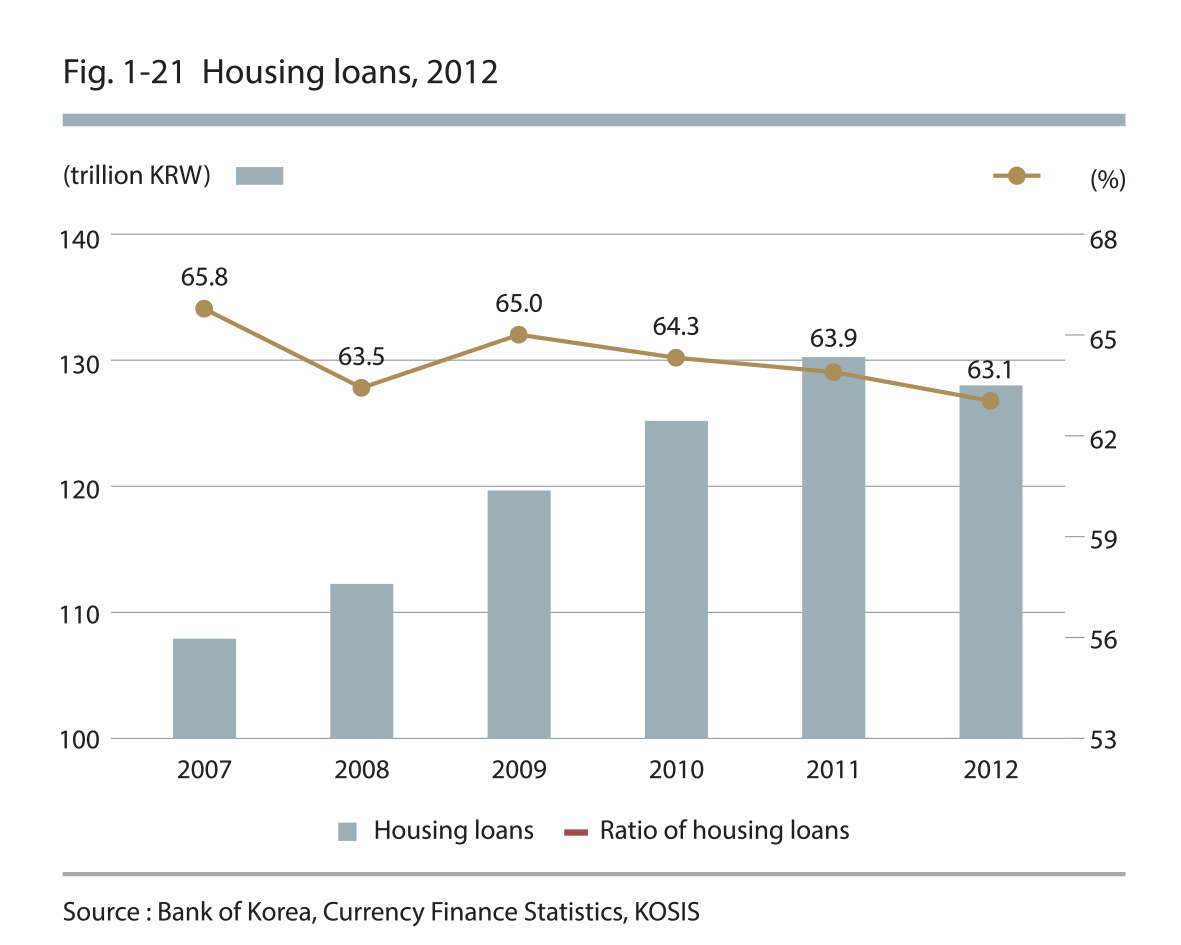
Housing loans account for 63.1% of the total household loans as of 2012
Housing loans, comprising the majority of the household loans in Seoul, were observed to account for 64.0% of the household loans on average during the analysis period (2006 to 2012). However, due to the prolonged recession in the real estate market causing a financial burden on those with housing mortgage loans, the total amount of housing mortgage loans, which had stood at 130.4 trillion in 2011, decreased to 128.2 trillion KRW in 2012. Moreover, the ratio of housing loans to the total household loans has been declining continually for 4 years from 65.0% in 2009 to 63.1% in 2012.
Source : Bank of Korea, Currency Finance Statistics, KOSIS
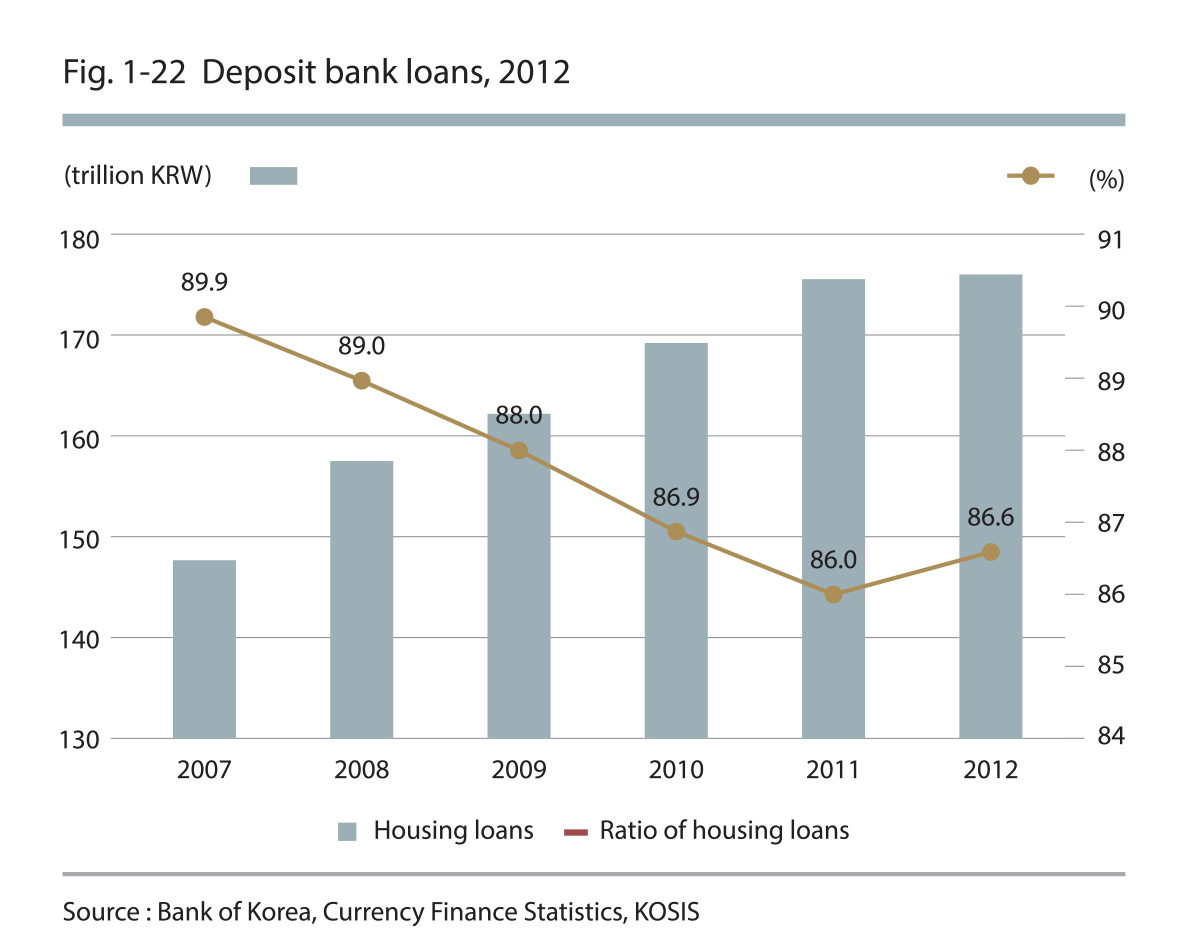
Deposit bank loans account for 86.6% of the total household loans as of 2012
A majority of the household loans in Seoul were provided by deposit banks, and the deposit bank loans in the analysis period (2007 to 2012) accounted or 87.3% of the total household loans on average. However, loans from non-banking deposit institutions have been gradually increasing, and thus, the deposit bank loans, which had been 89.9% in 2000, decreased to 86.0% in 2011. On the other hand, loans from non-banking deposit institutions increased slightly from 10.1% in 2007 to 13.4% in 2012.
Source : Bank of Korea, Currency Finance Statistics, KOSIS