-
Population
Household Structure
-
1. Changes in the Household Structure
1.1. Changes in the Number of Households
The number of households in Seoul has nearly doubled from 1.8 million in 1980 to 3.5 million in 2010
The number of households in Seoul has increased continually from 1.8 million in 1980 to 3.5 million in 2010, which accounted for 20% of the total households in the nation. The number of households in the Seoul Metropolitan Area was 8 million in 2010, which accounted for 48% of the total households in the nation. From 1980 to 2010, the number of households in Seoul, the Seoul Metropolitan Area, and the entire nation increased 1.9 fold, 2.8 fold and 2.2 fold, respectively.
Source : Korean Statistical Information Service (kosis.kr)
1.2. Changes in the Household Type
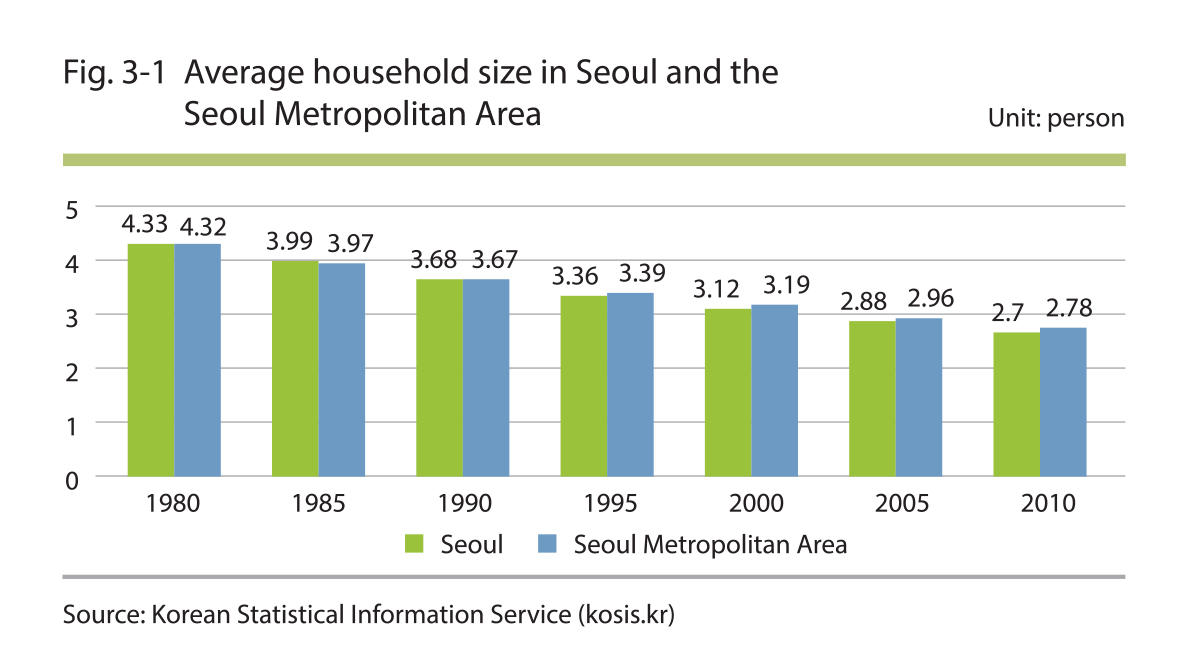
The average household size was 2.7 people in Seoul and 2.8 in the Seoul Metropolitan Area in 2010
The average household size in Seoul in 2010 was 2.7 people, which was a considerable decrease from 4.33 in 1980. The average household size decreased at a similar rate in the Seoul Metropolitan Area and the nation as well. Over the last 30 years, the average household size decreased from 4.32 to 2.78 people in the Seoul Metropolitan Area and from 4.45 to 2.69 people in the nation.
Source : Korean Statistical Information Service (kosis.kr)
2. Household Income
2.1. Average Household Income
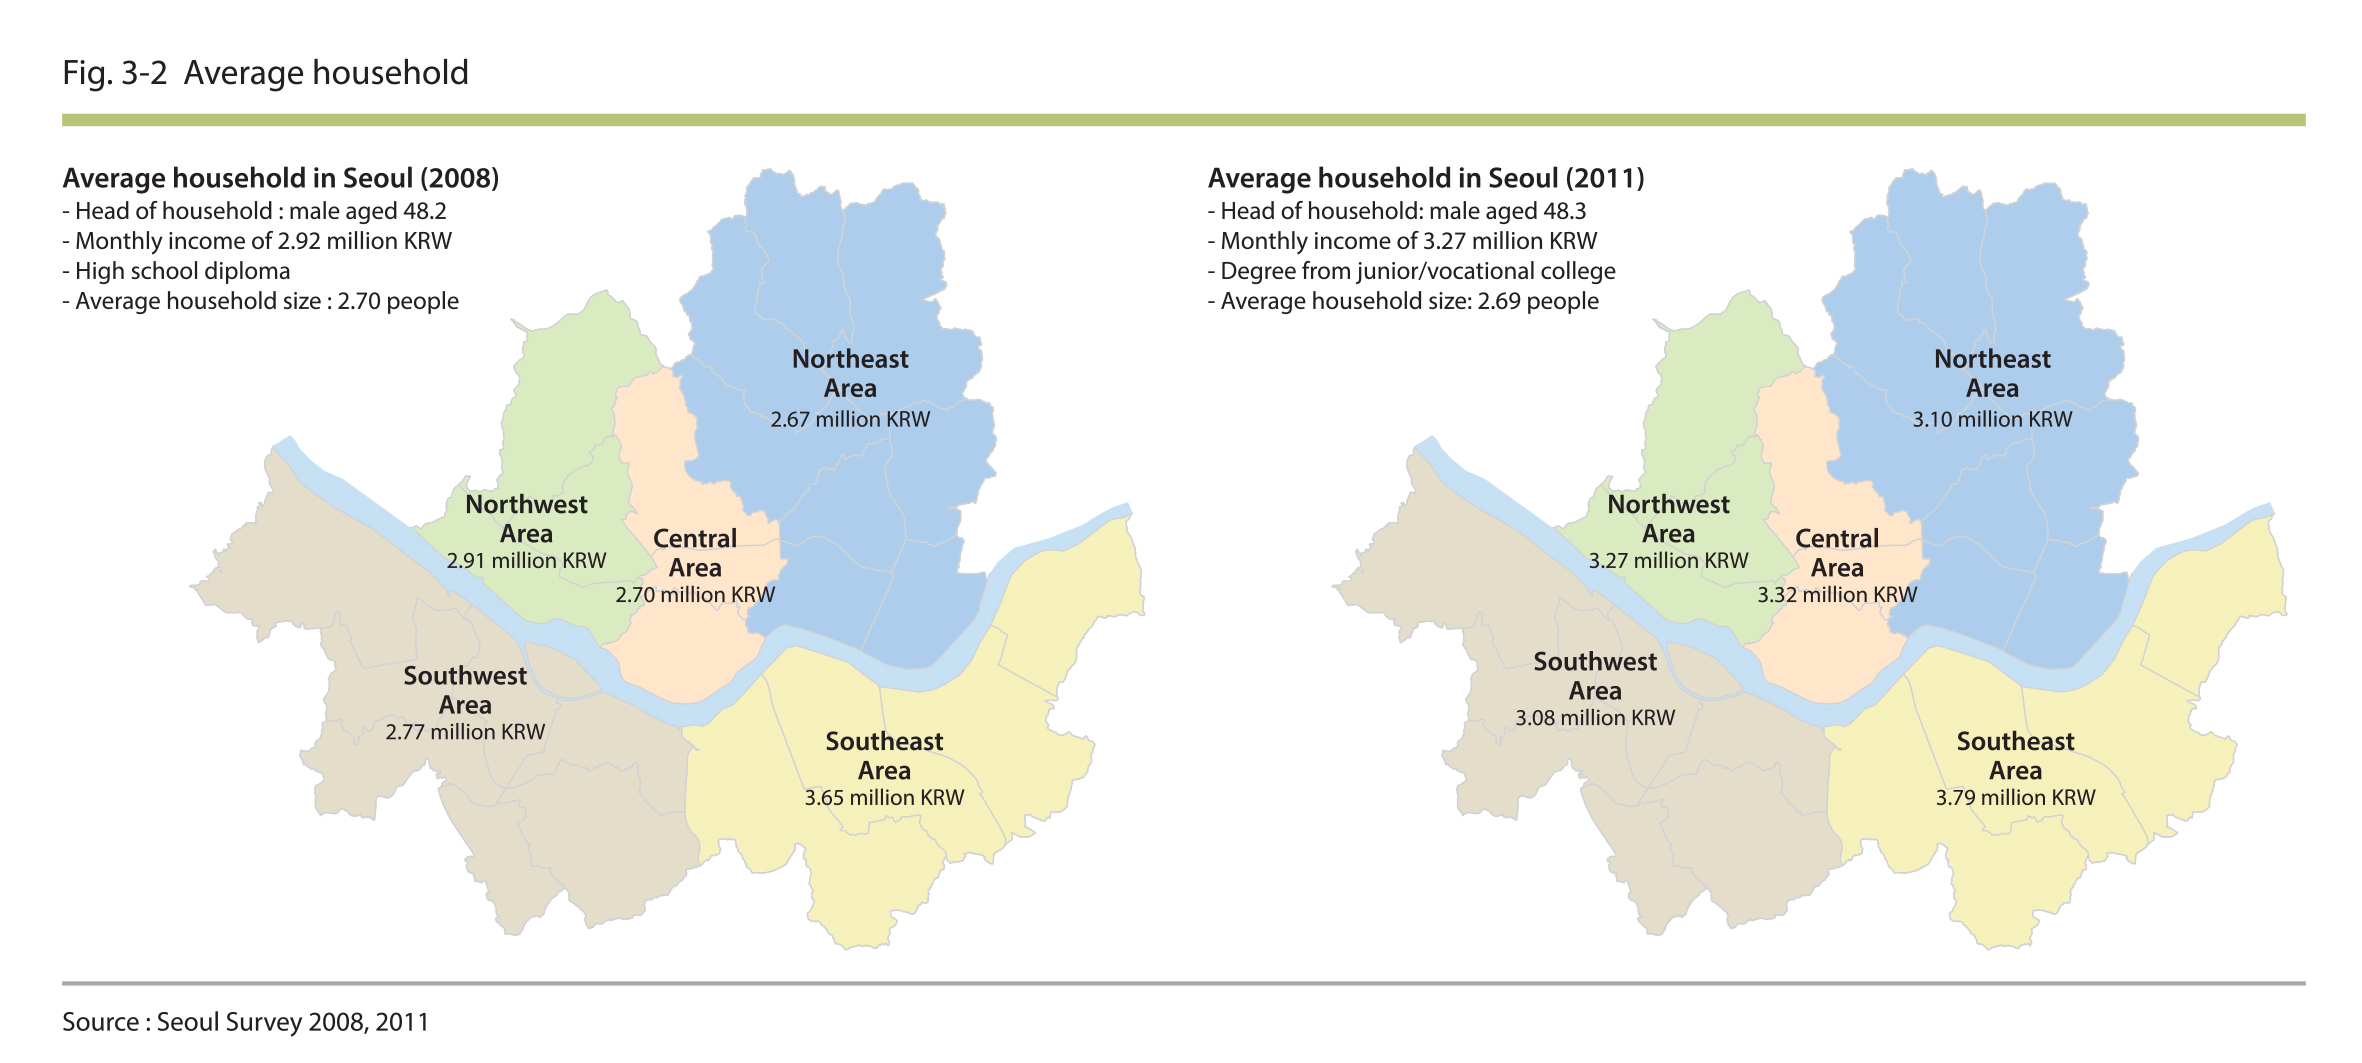
The average monthly household income in Seoul is 3.27 million KRW
According to the 2011 Seoul survey data, the head of the average household was a male aged 48.3 with a degree from a junior college (vocational college) and earned a monthly income of 3.27 million KRW. In 2008, the head of the average household was a male aged 48.2 with a high school diploma and earned monthly income of 2.92 million KRW.
Source : Seoul Survey 2008, 2011
Source : Seoul Survey 2008, 2011
2.2. Middle-Class Income
More than six out of every ten households in Seoul belong to the middle class
In 2011, the middle-class households (50-150% of the median income) in Seoul earned an average monthly household income of 1.50 to 4.50 million KRW and they accounted for 65.2% of the total households in the city. Although the percentage of middle-class households in Seoul in 2011 was the same as that of 2008, there were changes in its composition. In 2011, for instance, nearly four out of every ten households (38%) were considered to be in the marginal middle class, who are at a high risk of falling into the low-income class. This was a 5% point increase from 2008. The percentage of the typical middle-class households, therefore, has decreased while the percentage of the marginal middle-class households has increased since 2008.
3. Single-member Households
3.1. Single-member Households in Seoul and the Seoul Metropolitan Area
850,000 single-member households accounting for 23.9% of the population in Seoul in 2010
In 2010, there were a total of 854,606 single-member households in Seoul, accounting for 23.9% of the population. In 1980, the number of single-member households was merely 82,000, which later increased to 156,000 by 1985, 257,000 by 1990, and 382,000 by 1995, respectively. This particular population continued to grow at a rapid rate, registering 502,000 in 2000, 675,000 in 2005, and finally 850,000 in 2010. Compared to 1980, the number of single-member households in Seoul increased 10-fold in 30 years.
Similar single-member households trend observed in the Seoul Metropolitan Area and the nation
The number of single-member households in the Seoul Metropolitan Area was 380,000 in 1980. This figure increased to 260,000 by 1985 and 427,000 by 1990. It rose dramatically to 680,000 by 1995, 940,000 by 2000, 1.38 million by 2005, and 1.82 mi1lion by 2010. The number of single-member households in the Seoul Metropolitan Area increased 13-fold between 1980 and 2010.
Source : Korean Statistical Information Service (kosis.kr)
3.2. Age Characteristic of Single-member Households
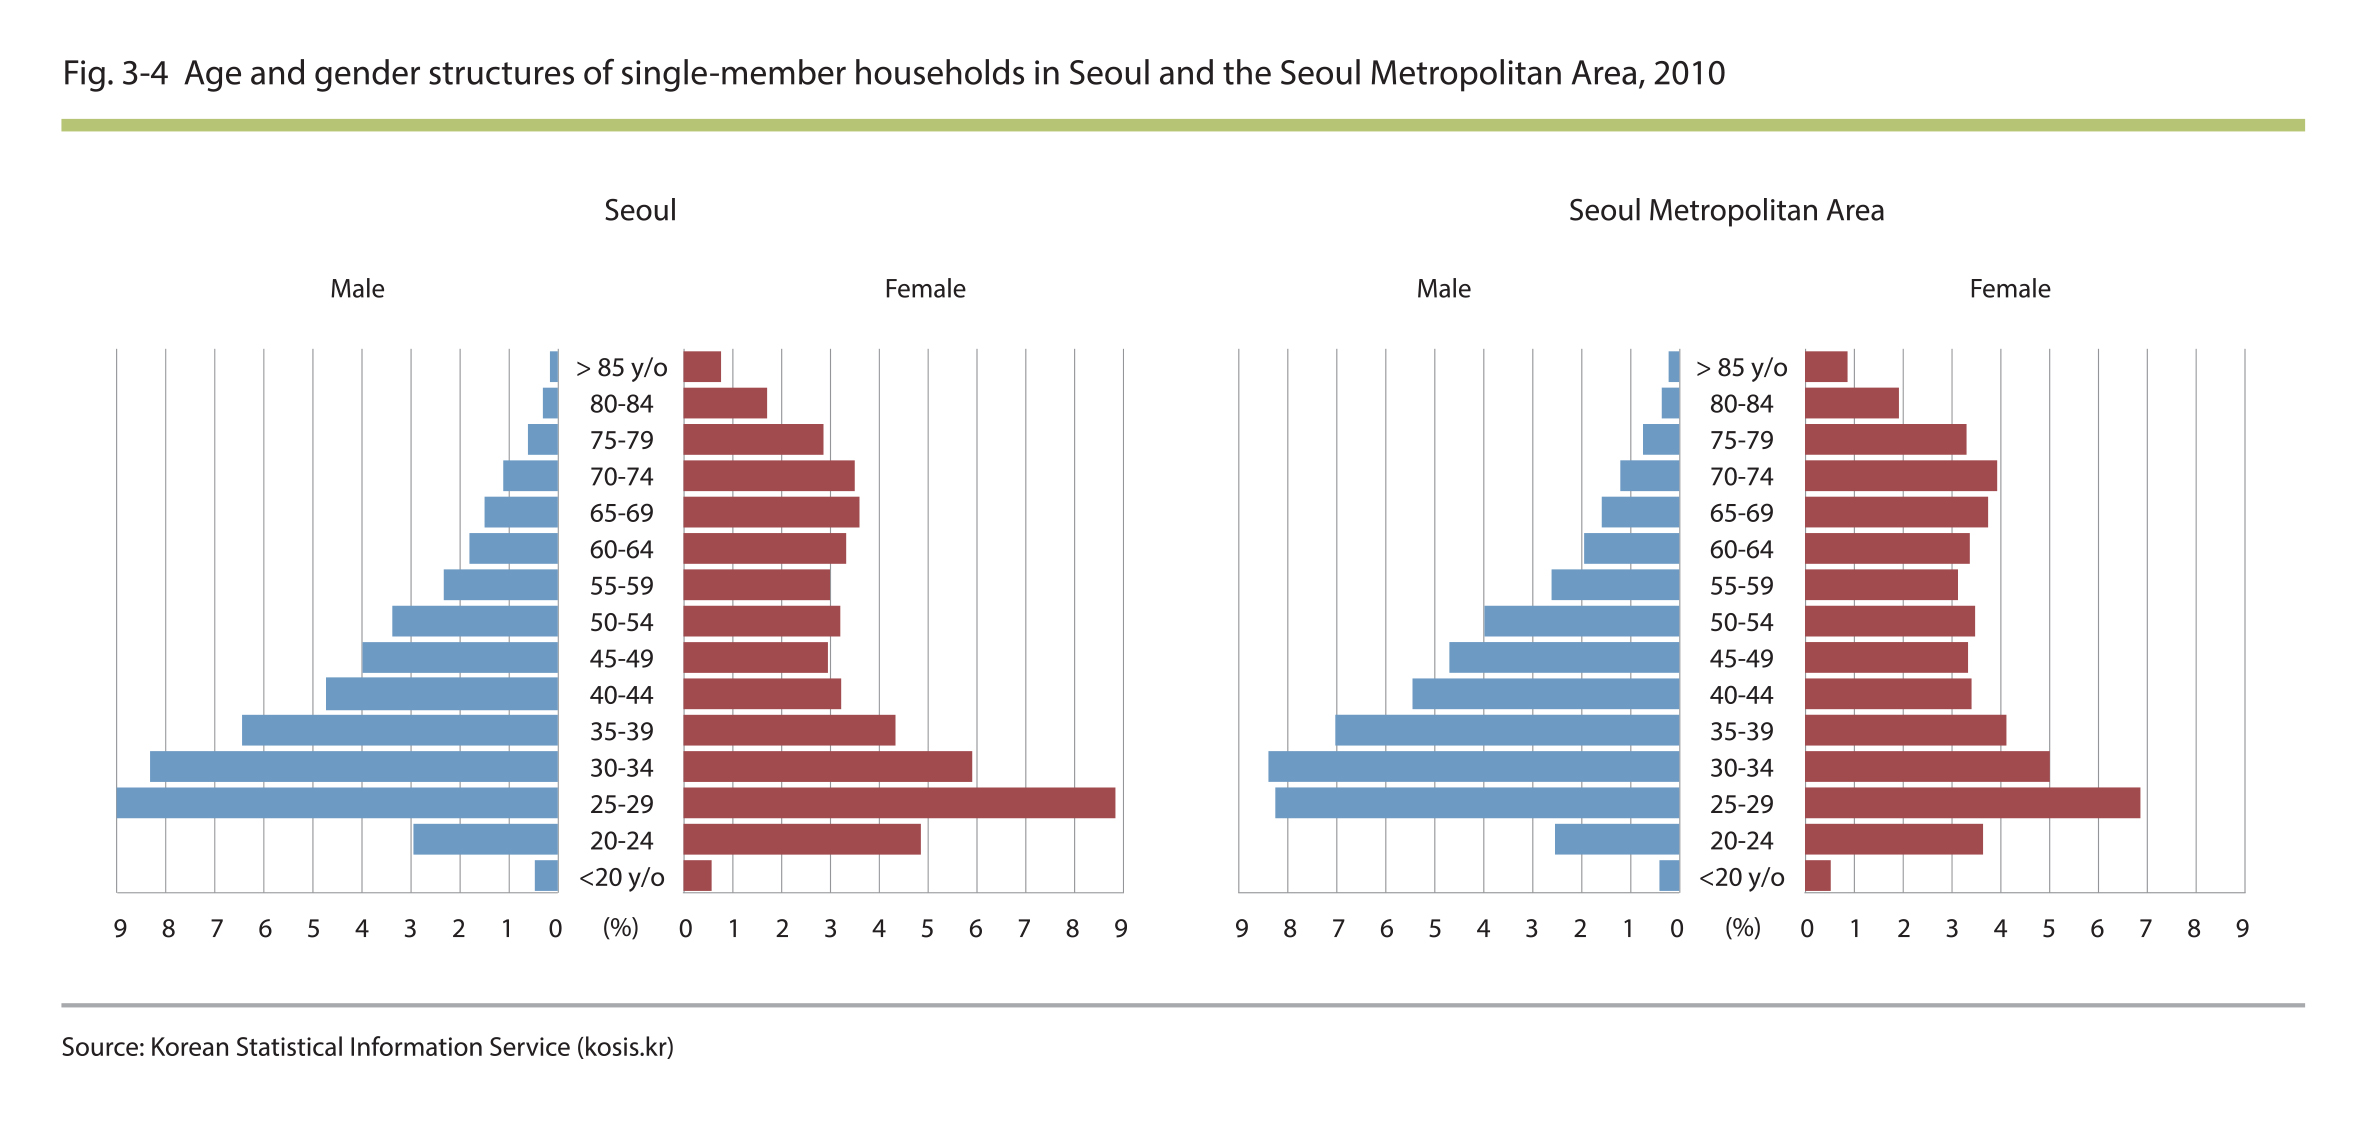
Members of single-member households in Seoul are primarily between the ages of 25 and 34
The number of single-male households in Seoul was the highest between the ages of 25 and 29, but it decreased with age. The number of single-female households in Seoul was the highest between the ages of 25 and 29, but it decreased with age, as was the case for males. The number of single-member households increased among those beyond the middle age and there was a high number of such households among the elderly population.
Single-male households in the Capital Area are primarily between the ages of 30 and 40
The number of single-female households in the Seoul Metropolitan Area was the highest between the ages of 25 and 29; but it was still lower than Seoul. The number of single-female households decreased with age before increasing again among the elderly population. On the other hand, the number of single-male households was more concentrated in the age group of 30-34 than that of 25-29, and decreased with age.
Source : Korean Statistical Information Service (kosis.kr)
3.3. The Economic Activities of Single-Member Households in Seoul
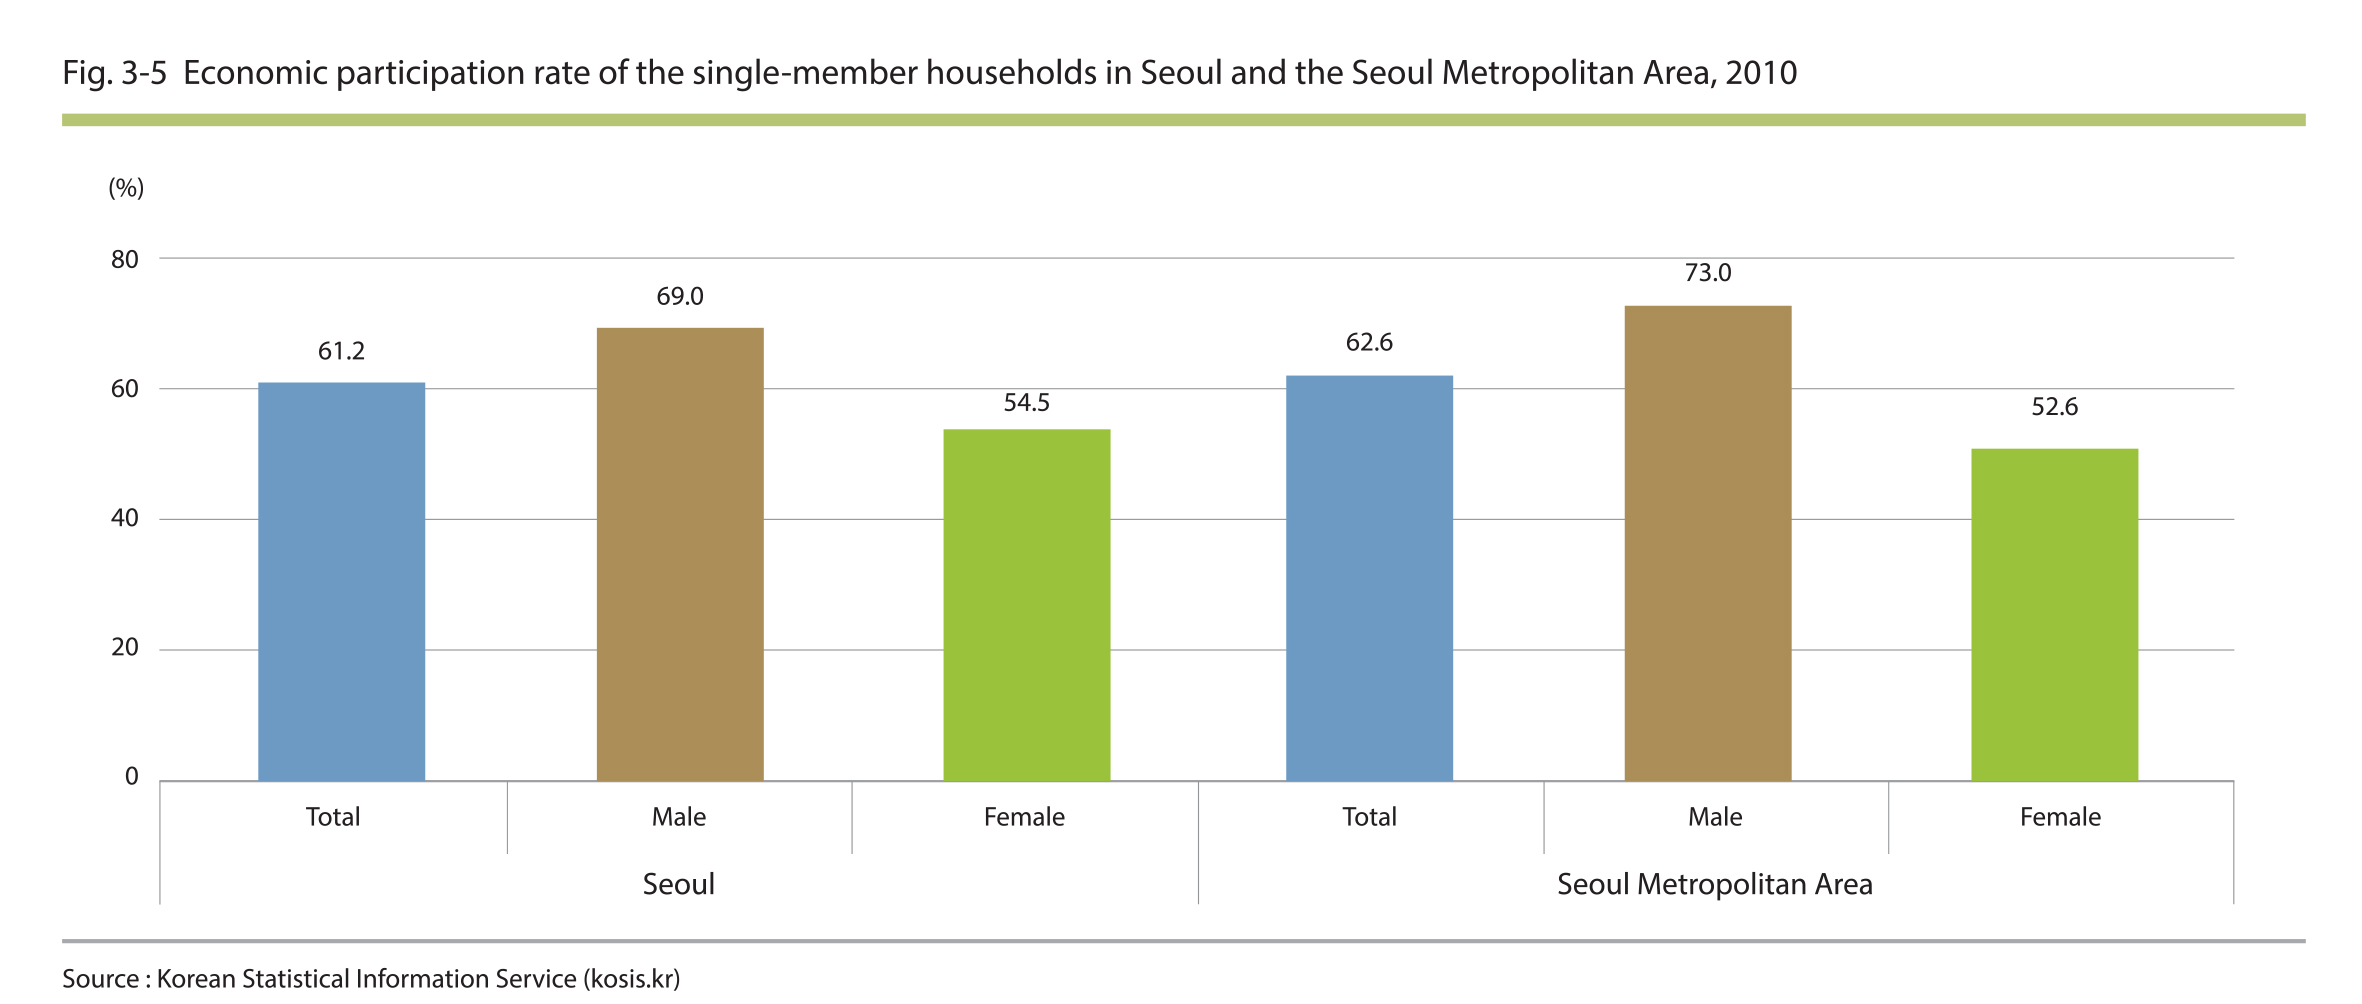
61% of the single-member households in Seoul are participating in economic acivities
As of 2010, 61.2% of the single-member households in Seoul were involved in economic activities, while 62.6% was involved in the Seoul Metropolitan Area. The economic participation rate among the single-member households across the entire nation is 56.2%. Gender-wise, while 69% of the single-male households were involved in economic activities, only 54.5% of the single-female households were involved. These percentages were found to be 73.0% and 52.6% in the Seoul Metropolitan Area, respectively. Given that the economic participation rate among single-female households barely exceeded the majority, it is speculated that more single-female households than their male counterparts would experience economic hardships.
Source : Korean Statistical Information Service (kosis.kr)
4. Elderly Households
4.1. Changes in the Elderly Households
20.2% of Seoulites are elderly households
An elderly household is a household with a member aged 65 or over. As of 2010, there were a total of 709,585 elderly households in Seoul, which accounted for 20.2% of the total population. In 2000 and 2005, they accounted for 14.2% and 16.9% of the total population, respectively. Seoul has observed an increase in the elderly households by more than 3 percentage point every 5 years. A similar pattern has been noted in the Seoul Metropolitan Area with a lower percentage of the elderly households than in Seoul. For instance, the percentage of elderly households in the Seoul Metropolitan Area was 14.8% in 2000, 17.1% in 2005 and 19.8% in 2010, respectively.
Source : Korean Statistical Information Service (kosis.kr)
One-generation and single-member elderly households account for 43.3% of the total elderly households in Seoul
In 2010, there were 168.455 one-generation elderly households, which was 23.7% of the total elderly households. Similarly, there were 138,825 single-member elderly households, which accounted for 19.6% of the total elderly households. The number of one-generation and single-member elderly households made up of senior members only was 307,280, which was about 43.3% of the total elderly households. In the case of the Seoul Metropolitan Area, both types of households accounted for 24%, while the two and three generation households accounted for 30.0% and 25.2%, respectively.
Over 85% of the single-member elderly households were made up of a female member, and the average age of the single-member households in Seoul was 73.
Source : Korean Statistical Information Service (kosis.kr)
5. Multi-cultural Households
5.1. Distribution of Multi-cultural Households
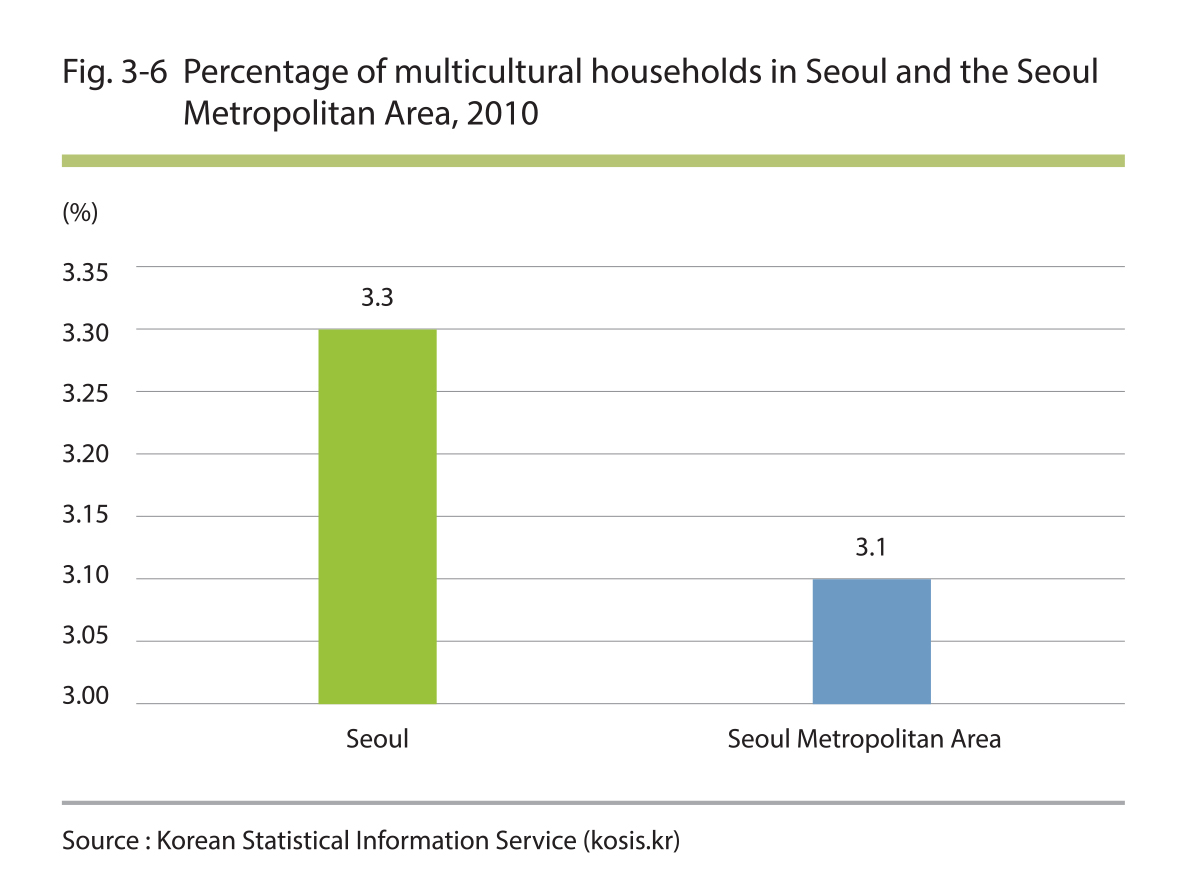
3.3% of the households in Seoul are multi-cultural
A multi-cultural household is a household with a member who is a foreigner or a naturalized Korean citizen. According to the 2010 Population and Housing Census, there were 115,043 multi-cultural households in Seoul, which accounted for 3.3% of the city’s total households. For the same year, the figure was 3.1% and 2.2% for the Seoul Metropolitan Area and the entire nation, respectively.
Source : Korean Statistical Information Service (kosis.kr)
5.2. Characteristics of Multi-cultural Households
33.8% are single-member households, 61.8% are kin households with two or more members, and 4.4% are non-kin households in Seoul
Of the multi-cultural households in Seoul, 33.8% were found to be single-member households, while 61.8% were kin households with two or more members and 4.4% were non-kin households. As for the Seoul Metropolitan Area, single-member households accounted for 32.7%, kin households with two or more members 59.3% and non-kin households 8.0%.
Source : Korean Statistical Information Service (kosis.kr)

.jpg)


.jpg)
.jpg)

