
-
Population
Demographics
-
1. Population Pyramid
The 1980 population pyramid demonstrates an atypical fertility rate
The fertility rate of Korea has declined sharply. To illustrate, the total birth rate decreased from 6.0 in 1960 to 2.0 in 1983. The fertility rate declined dramatically as a result of a family planning program introduced in the early 1960s to discourage fertility. As a result, a typical population pyramid with high birth and death rates was replaced by an atypical one with a smaller young population and a larger middle-aged and elderly population. In 1980, for instance, those aged from 0 to 4 were found to be smaller in size than those aged from 5 to 9.
The population structure in 1995 reflected the increased fertility
The national population policy underwent a change in the 1990s. Facing too low a fertility rate, the govemment could no longer carry on the previous family plan. However, they did not adopt an opposite policy to encourage fertility, either. They simply took a step back from the fertility suppression policy and cut back the assistance for the family planning program which encouraged the use of contraceptives among other practices. As a result, fertility rates increased temporarily in the 1990s. For instance, in 1995, the size of population aged between 0 and 4 was greater than that of popu1ation aged between 5 and 9. This change, however, did not last long.
.jpg)
Source : Korean Statistical Information Service (kosis.kr)
2. Gender Structure
2.1. Changes in the Gender Structure
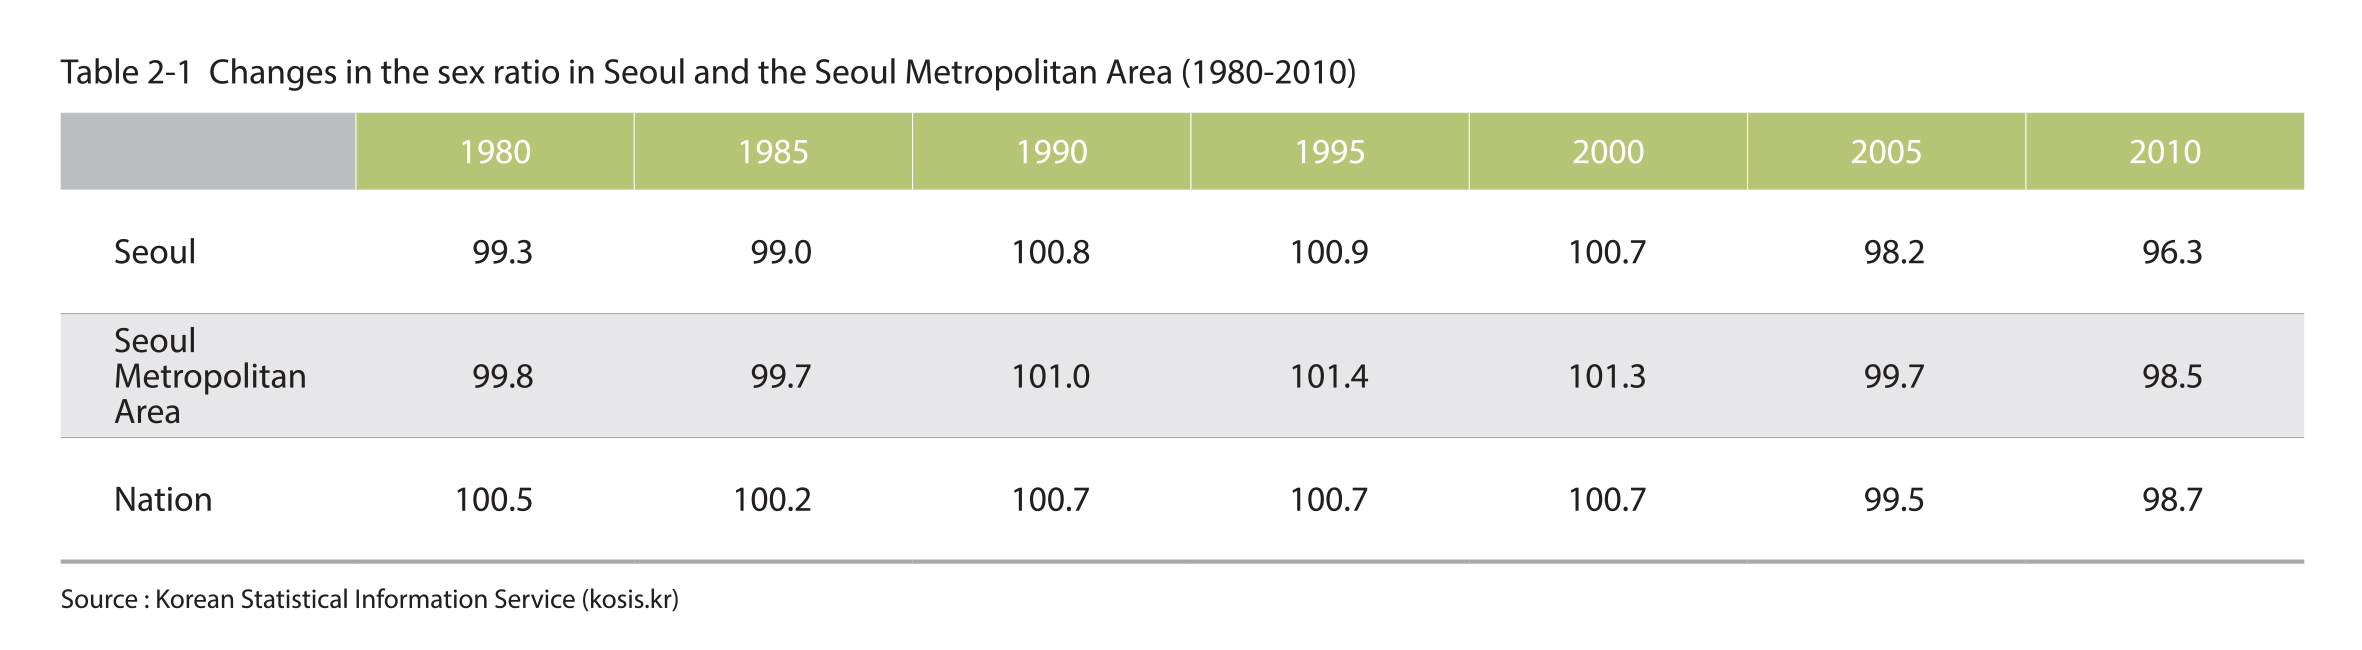
The sex ratio of Seoul in 2010 was 96.3
According to the Population and Housing Census records, the sex ratio of Seoul was under 100 in 1980 and 1985, and over 100 from 1990 to 2000 before dropping back to below 100 in 2005. For every 100 females, there were 98 and 96 males in 2005 and in 2010, respectively. Nationwide, too, the sex ratio decreased from 2005. However, the decline was much sharper in Seoul compared to other regions.
.jpg)
Source : Korean Statistical Information Service (kosis.kr)
2.2. Changes in the Sex Ratio at Birth
The sex ratio at birth in Seoul has continuously decreased to 106.9 by 2010
The "sex ratio at birth" is defined as the number of boys born for every 100 girls born. Under natural circumstances, the sex ratio at birth tends to range between 102 and 107. The sex ratio at birth in Korea, however, was quite skewed in the 1990s. For instance, in 1990, the ratio was 116.5 for the entire nation, 112.4 for the Seoul Metropolitan Area, and 113.3 for Seoul. It was not until 2005 that the ratio became normalized. In 2010, the ratio for Seoul registered 106.6, which is within the normal range.
Source : Korean Statistical Information Service (kosis.kr)
3. Age Structure
A steady increase in the elderly population and a steady decrease in the youth population
The young population aged 14 or under declined sharply over the last 30 years, from 31.3% in 1980 to 13.9% in 2010. On the other hand, the elderly population aged 65 or over increased noticeably from 2.5% in 1980 to 9.3% in 2010. During the same period, the young population of the Seoul Metropolitan Area and the nation decreased from 31.8% to 16.2% and from 34.0% to 16.1%, respectively, while the elderly population increased from 2.9% to 9.0% and from 3.8% to 11.0%, respectively. Compared to the nationwide elderly population size of 11.0%, the elderly population size of 9.3% for Seoul is relatively low. The working age group aged from 15 to 64 in Seoul is comparatively larger in size than the Seoul Metropolitan Area.
.jpg)
Source : Korean Statistical Information Service (kosis.kr)
4. Educational Level
The most substantial increase found in the size of university (4-year program) graduates
The educational level has generally improved over time. Education is one of the most important contributing factors in the formation of human resources. To the extent that the quality of population is determined by the education they receive, the quality of Seoulites is higher than that of other residents. In 1990, for instance, only 18% of the population in Seoul completed a 4-year college program or higher. By 2010, however, the size almost doubled, registering 34%. In the Seoul Metropolitan Area, 14.5% of the population completed a 4-year college program or higher in 1990, and 28% in 2010. As we can see, Seoul, compared to the nearby areas, retains more educated population.
.jpg)
Source : Korean Statistical Information Service (kosis.kr)
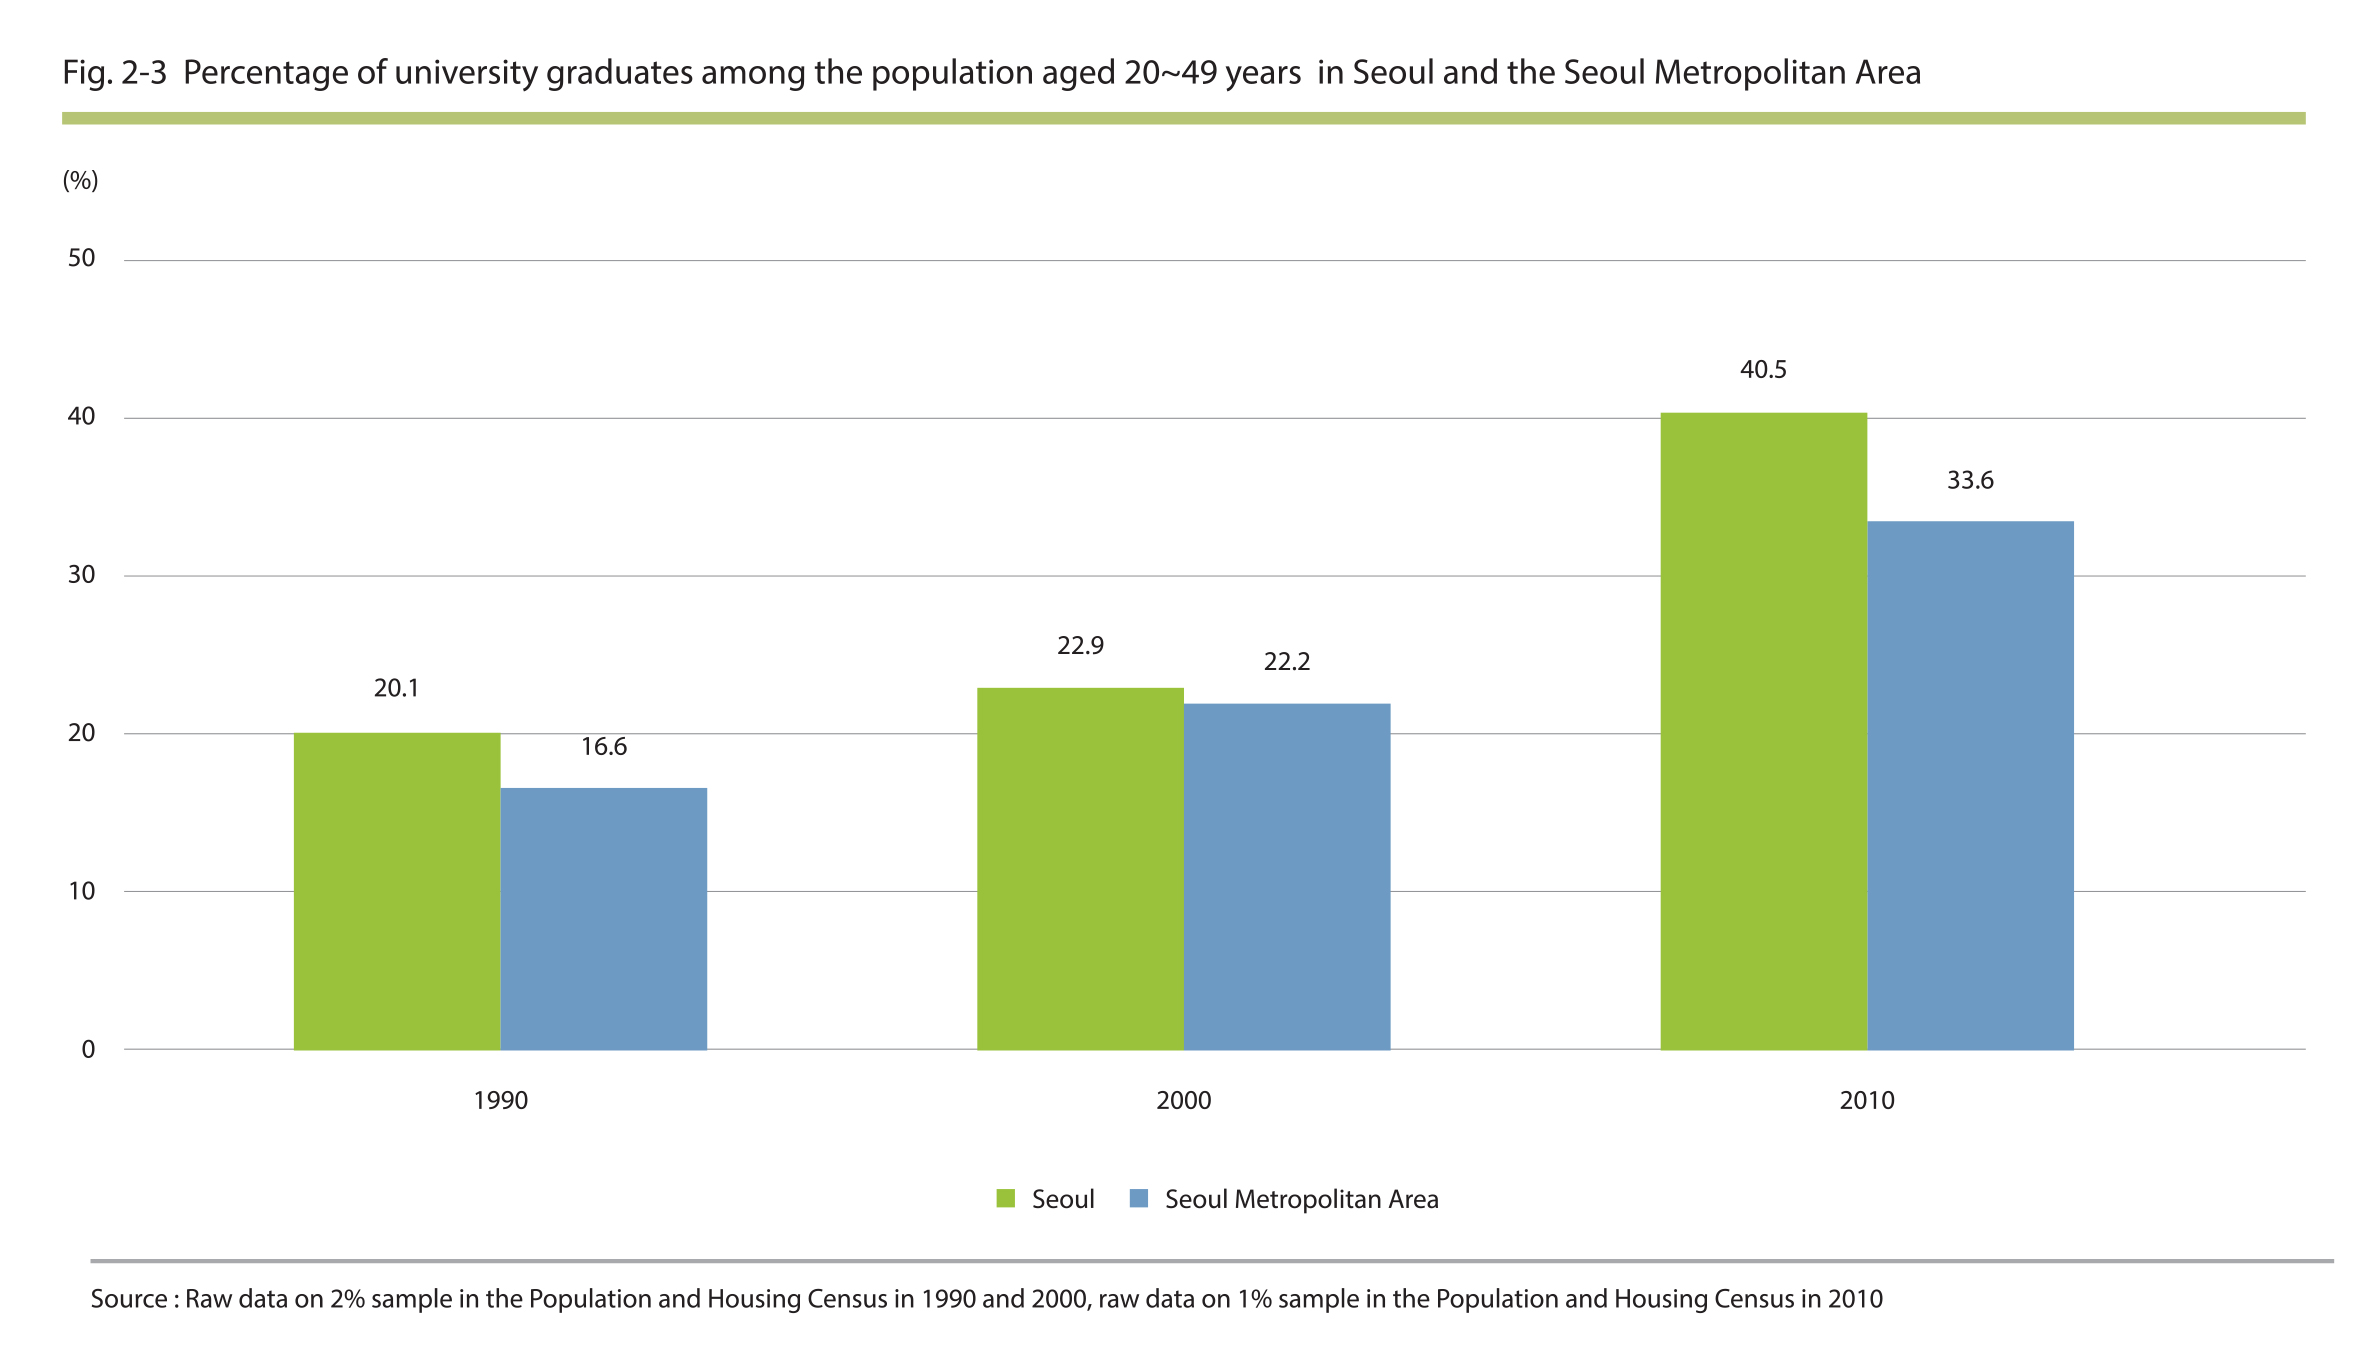
40.5% of the population aged 20-49 completed at least a 4-year college program
Of those aged between 20 and 49, who tend to be strongly associated with marriage, childbirth, and child education, 40% completed a 4-year college program or higher in Seoul. In 2005, only 22.9% of this age group were university graduates; but the figure rose to 40.5% in 2010. Compared to 33.6% for the Seoul Metropolitan Area and 29.6% for the entire nation, Seoul retains more educated population than other regions.
Source : Raw data on 2% sample in the Population and Housing Census in 1990 and 2000, raw data on 1% sample in the Population and Housing Census in 2010
5. Productive and Dependent Population
5.1. Productive and Dependent Population*, 1980-2010
The productive population of Seoul reached its peak in 2010
The productive population, or the working-age population aged 15-64, of Seoul in 1980 was 5.64 million, accounting for 66% of the city's total population. The same working-age group accounted for 65% and 62% of the population in the Seoul Metropolitan Area and the entire nation, respectively. In 2010, the working-age population in Seoul reached 7.70 million, accounting for 76.7% of the city’s population. For the same year, the figure reached 74.9% and 72.8% for the Seoul Metropolitan Area and the entire nation, respectively. As for the dependent population, the young population declined while the elderly population increased as a result of low birth rates and an aging population.
*Productive population is defined as the population aged between 15 and 64. Dependent population is divided into the youth and elderly population, the former being aged between 0 and 14 and the latter being aged 65 or higher.
.jpg)
Source : Korean Statistical Information Service (kosis.kr)
5.2. Productive and Dependent Population Projections, 2010-2040
The productive population will decrease while the dependent population will increase in Seoul from 2010 to 2040
The productive population in Seoul reached 76% of the city’s total population in 2000, and was anticipated to plateau out for the next 15 years. However, after its peak in 2010 and 2011, a downturn has begun already. Seoul has been aging rapidly, with a decline of the productive population and an increase of the dependent population in both size and proportion. Seoul is no longer immune to the issue of aging population.
.jpg)
Source : Korean Statistical Information Service (kosis.kr)
5.3. Dependency Ratio, 1980-2040
The total dependency ratio in Seoul was 30.4 in 2010
An aging population, when coupled with low birth rates, adds more pressure and burdens to society, especially to the productive population. The total dependency ratio is a common measure of such pressure, a ratio of those typically not in the labor force to those typically in the labor force. The total dependency ratio of Seoul in 1980 was 51.0, and the ratio decreased significantly to 30.4 in 2010. To decompose the total ratio into the child dependency ratio and the aged dependency ratio, respectively, the former was 18.2 whereas the latter was 12.2. This means that there is currently more burden to support the young population than to support the aged population in Seoul.
The Burden of supporting the elderly population will soon exceed that of supporting the young population
By 2015 and 2016, however, the burden of supporting the elderly population will exceed that of supporting the young population as a result of the continuously decreasing young population and the increasing elderly population. According to the estimates, the child dependency ratio and the aged dependency ratio will be 16.0 and 15.6, respectively, in 2015, and 15.8 and 16.2, respectively, in 2016.
.jpg)
Source : Korean Statistical Information Service (kosis.kr)
6. Changes in the Married Population
6.1. Changes in the Married Population
No significant changes in the marital status of Seoulites in the past 30 years
Because young people today tend to postpone marriages to later ages and the number of single person household is on the rise, it is likely to speculate that there must have been significant changes in the marital status of Seoulites. However, measured by the relative size, not by the absolute numbers, there have not been any considerable changes mainly due to the continued low birth rates. That is, while the lower birth rates have reduced the absolute number of young population who can get married, the relative percentage of married population within has not changed.
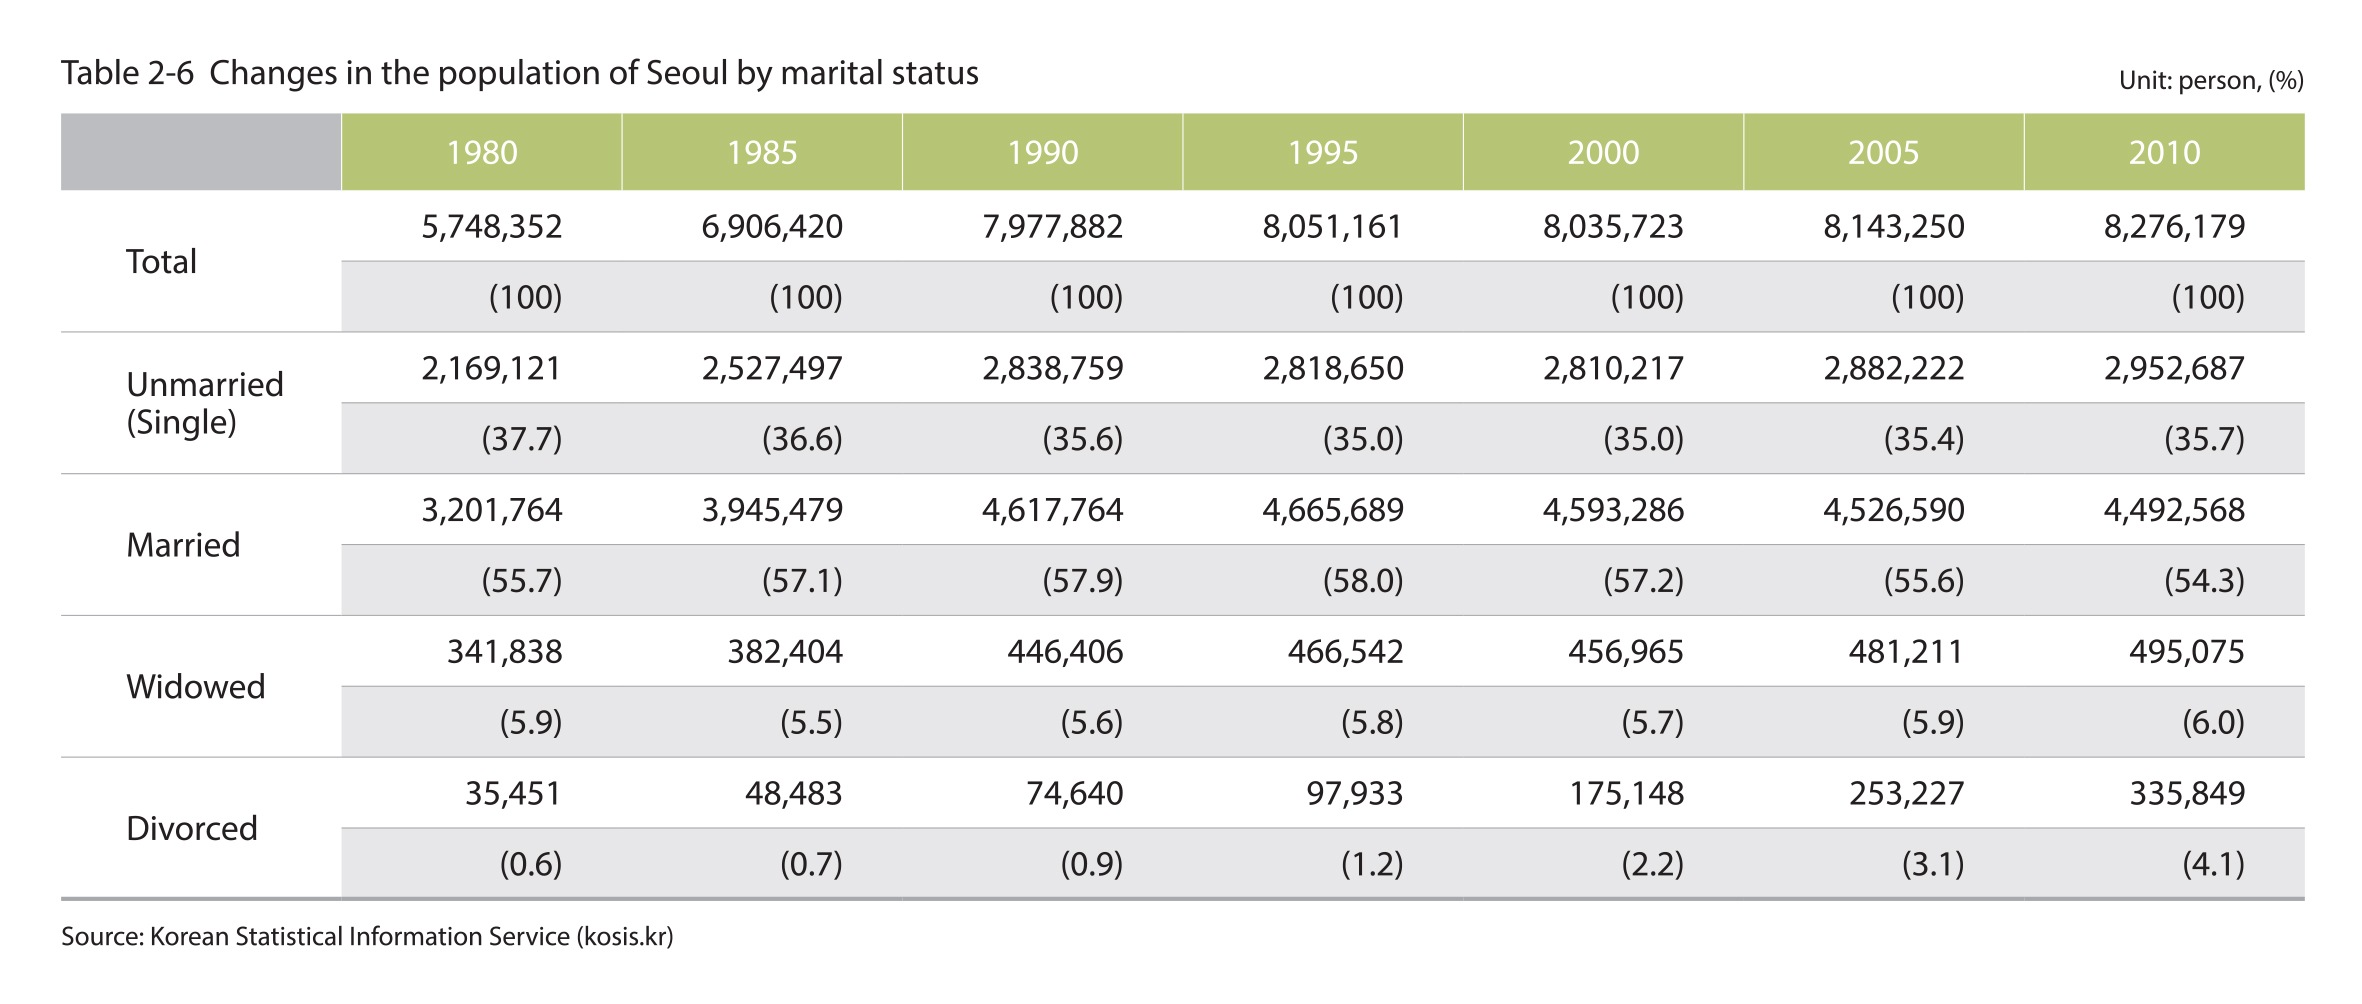
The biggest change in the past 30 years is the increased divorce rate
Although the ratio of the unmarried to the married population has not changed significantly over the last 30 years, the percentage of the divorced population has increased from 0.6% in 1980 to 4.1% in 2010. An increased divorce rate may indicate an increased remarriage rate; however, this is not clearly captured by the official statistics reports as the remarried population is lumped together with the married population as a whole. Although a number of people have gone from divorce to remarriage, the divorced population is still on the rise and characterizes the marital status of Seoulite.
Source : Korean Statistical Information Service (kosis.kr)
6.2. Changes in the Unmarried Population of Reproductive Age between 20 and 49
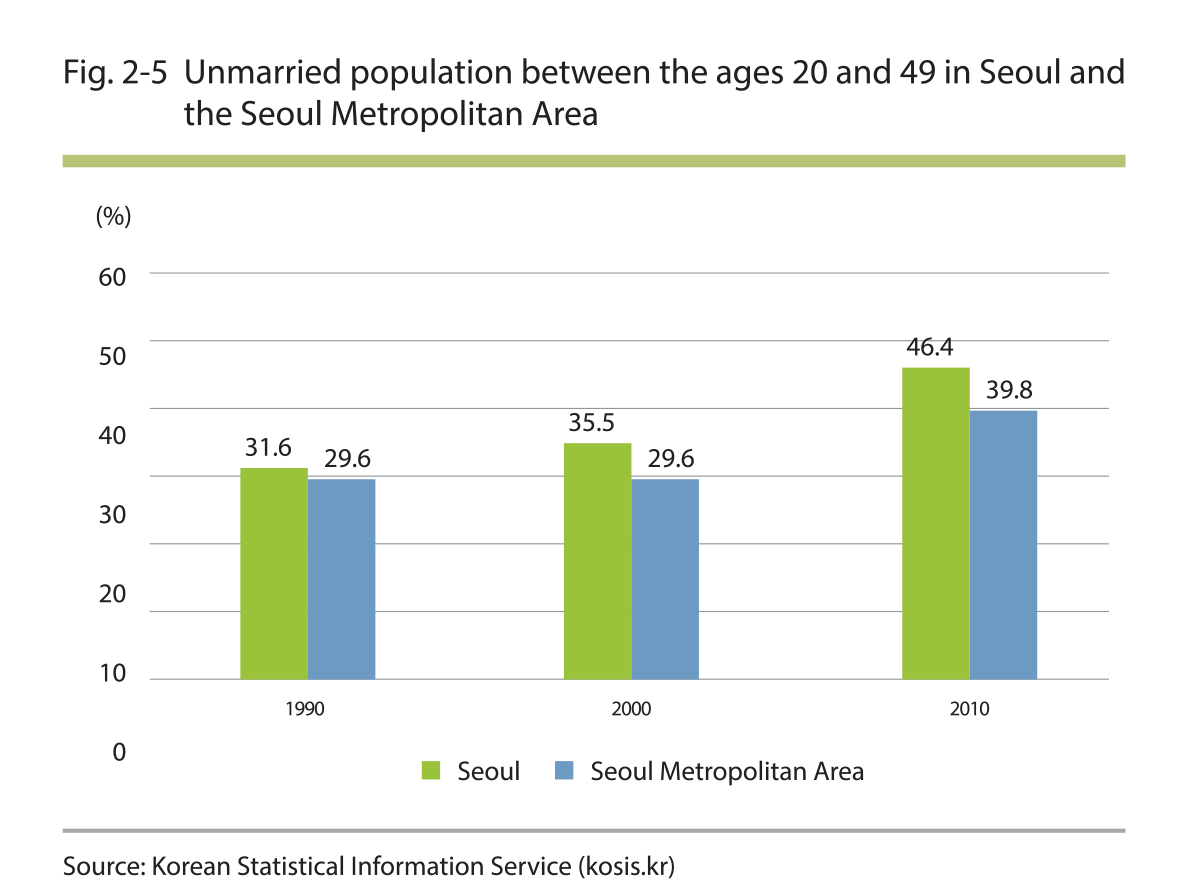
The unmarried population of reproductive age in Seoul rose from 35.5% in 2000 to 46.45% in 2010
The unmarried population of reproductive age between 20 and 49 was 31.6% of the total population of Seoul in 1990, which rose dramatically to 35.5% and 46.4% in 2000 and 2010, respectively. In the Seoul Metropolitan Area, the figure was 29.6% in both 1990 and 2000, and 39.8% in 2010. Nearly half of the population of reproductive age in Seoul is unmarried.
Source : Korean Statistical Information Service (kosis.kr)
7. Foreigner
7.1. Changes in the Foreigner Population
The number of foreigners in Seoul continued to rise until 2011 and started to fall in 2012
Over the past 20 years, the foreigner population has expanded across Seoul, the Seoul Metropolitan Area, and the entire nation. From 2002 to 2011, the rates of increase were higher in Seoul and the Seoul Metropolitan Area than in the nation, and the rate of increase in Seoul surpassed that of tbe Seoul Metropolitan Area in 2005. The number of foreigners in Seoul was 279,220 in 2011 and decreased to 247,108 in 2012.
260,000 registered foreigners in Seoul account for 2.49% of the registered population of the city
According to the registry of sojourning foreigners, the number of foreigners in Seoul in 2010 was 262,902, which was 2.49% of the city’s total registered population including both Koreans and foreigners. This is a 5.8-fold increase from the registered foreigner population of 45,072 in 1995. The foreigner population was larger in the Seoul Metropolitan Area than Seoul between 2000 and 2005; but the foreigner population in Seoul doubled by 2012, which accounted for 2.49% of the city's total population. This is slightly higher than 2.35% of the Seoul Metropolitan Area.
.jpg)
Source : Korean Statistical Information Service (kosis.kr)