
-
인구
부양비
-
부양비
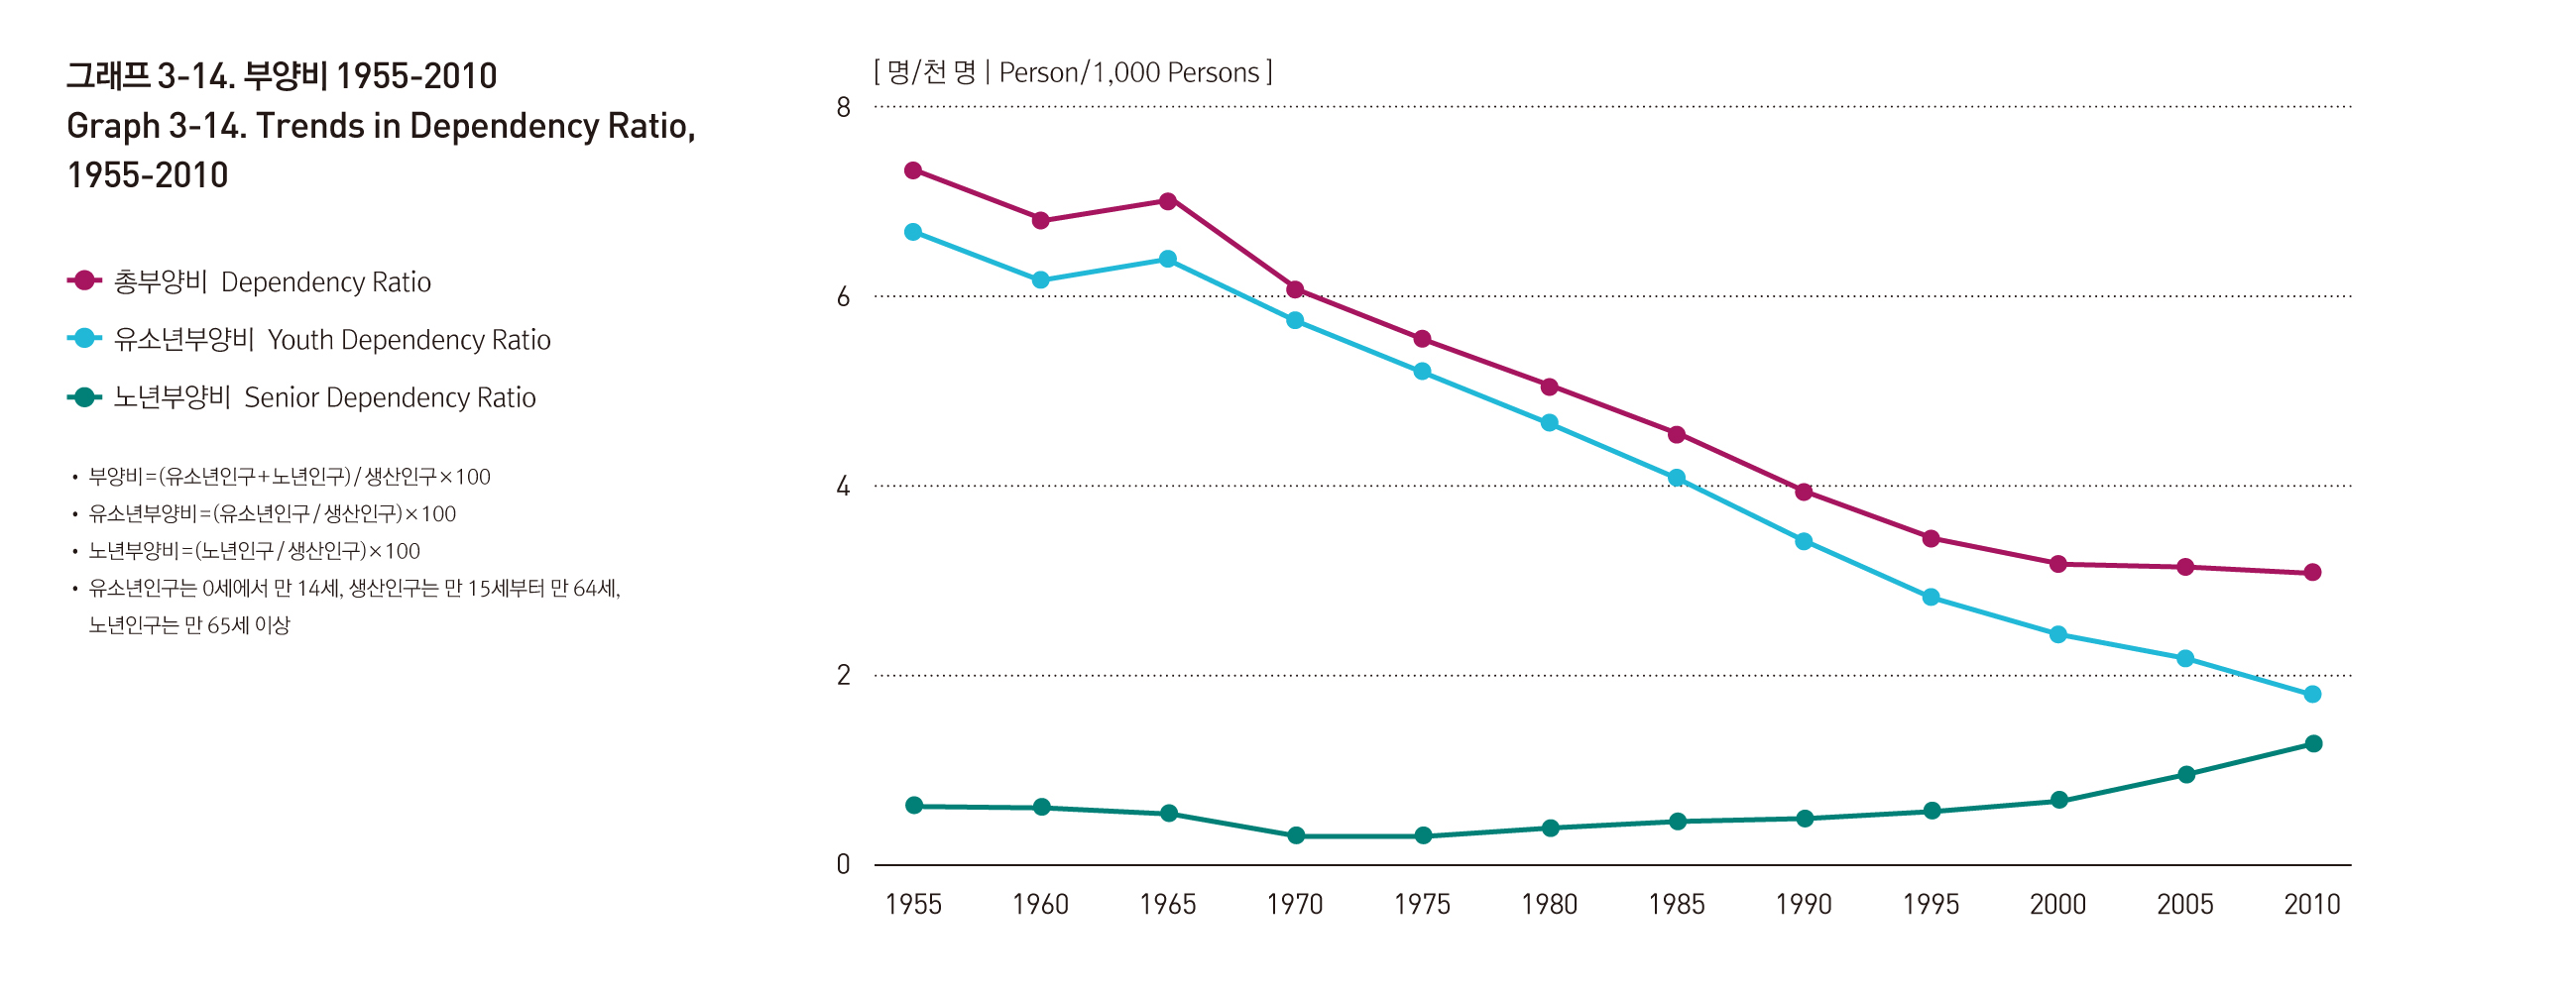
저출산은 유소년인구의 규모를 줄이고 고령화는 고령인구의 비율을 늘려 결국에는 고령인구 부양의 부담을 증가시킨다. 저출산이 지속되면서 노년부양비의 증가보다 유소년부양비의 감소정도가 커 총부양비는 감소하여 왔다.
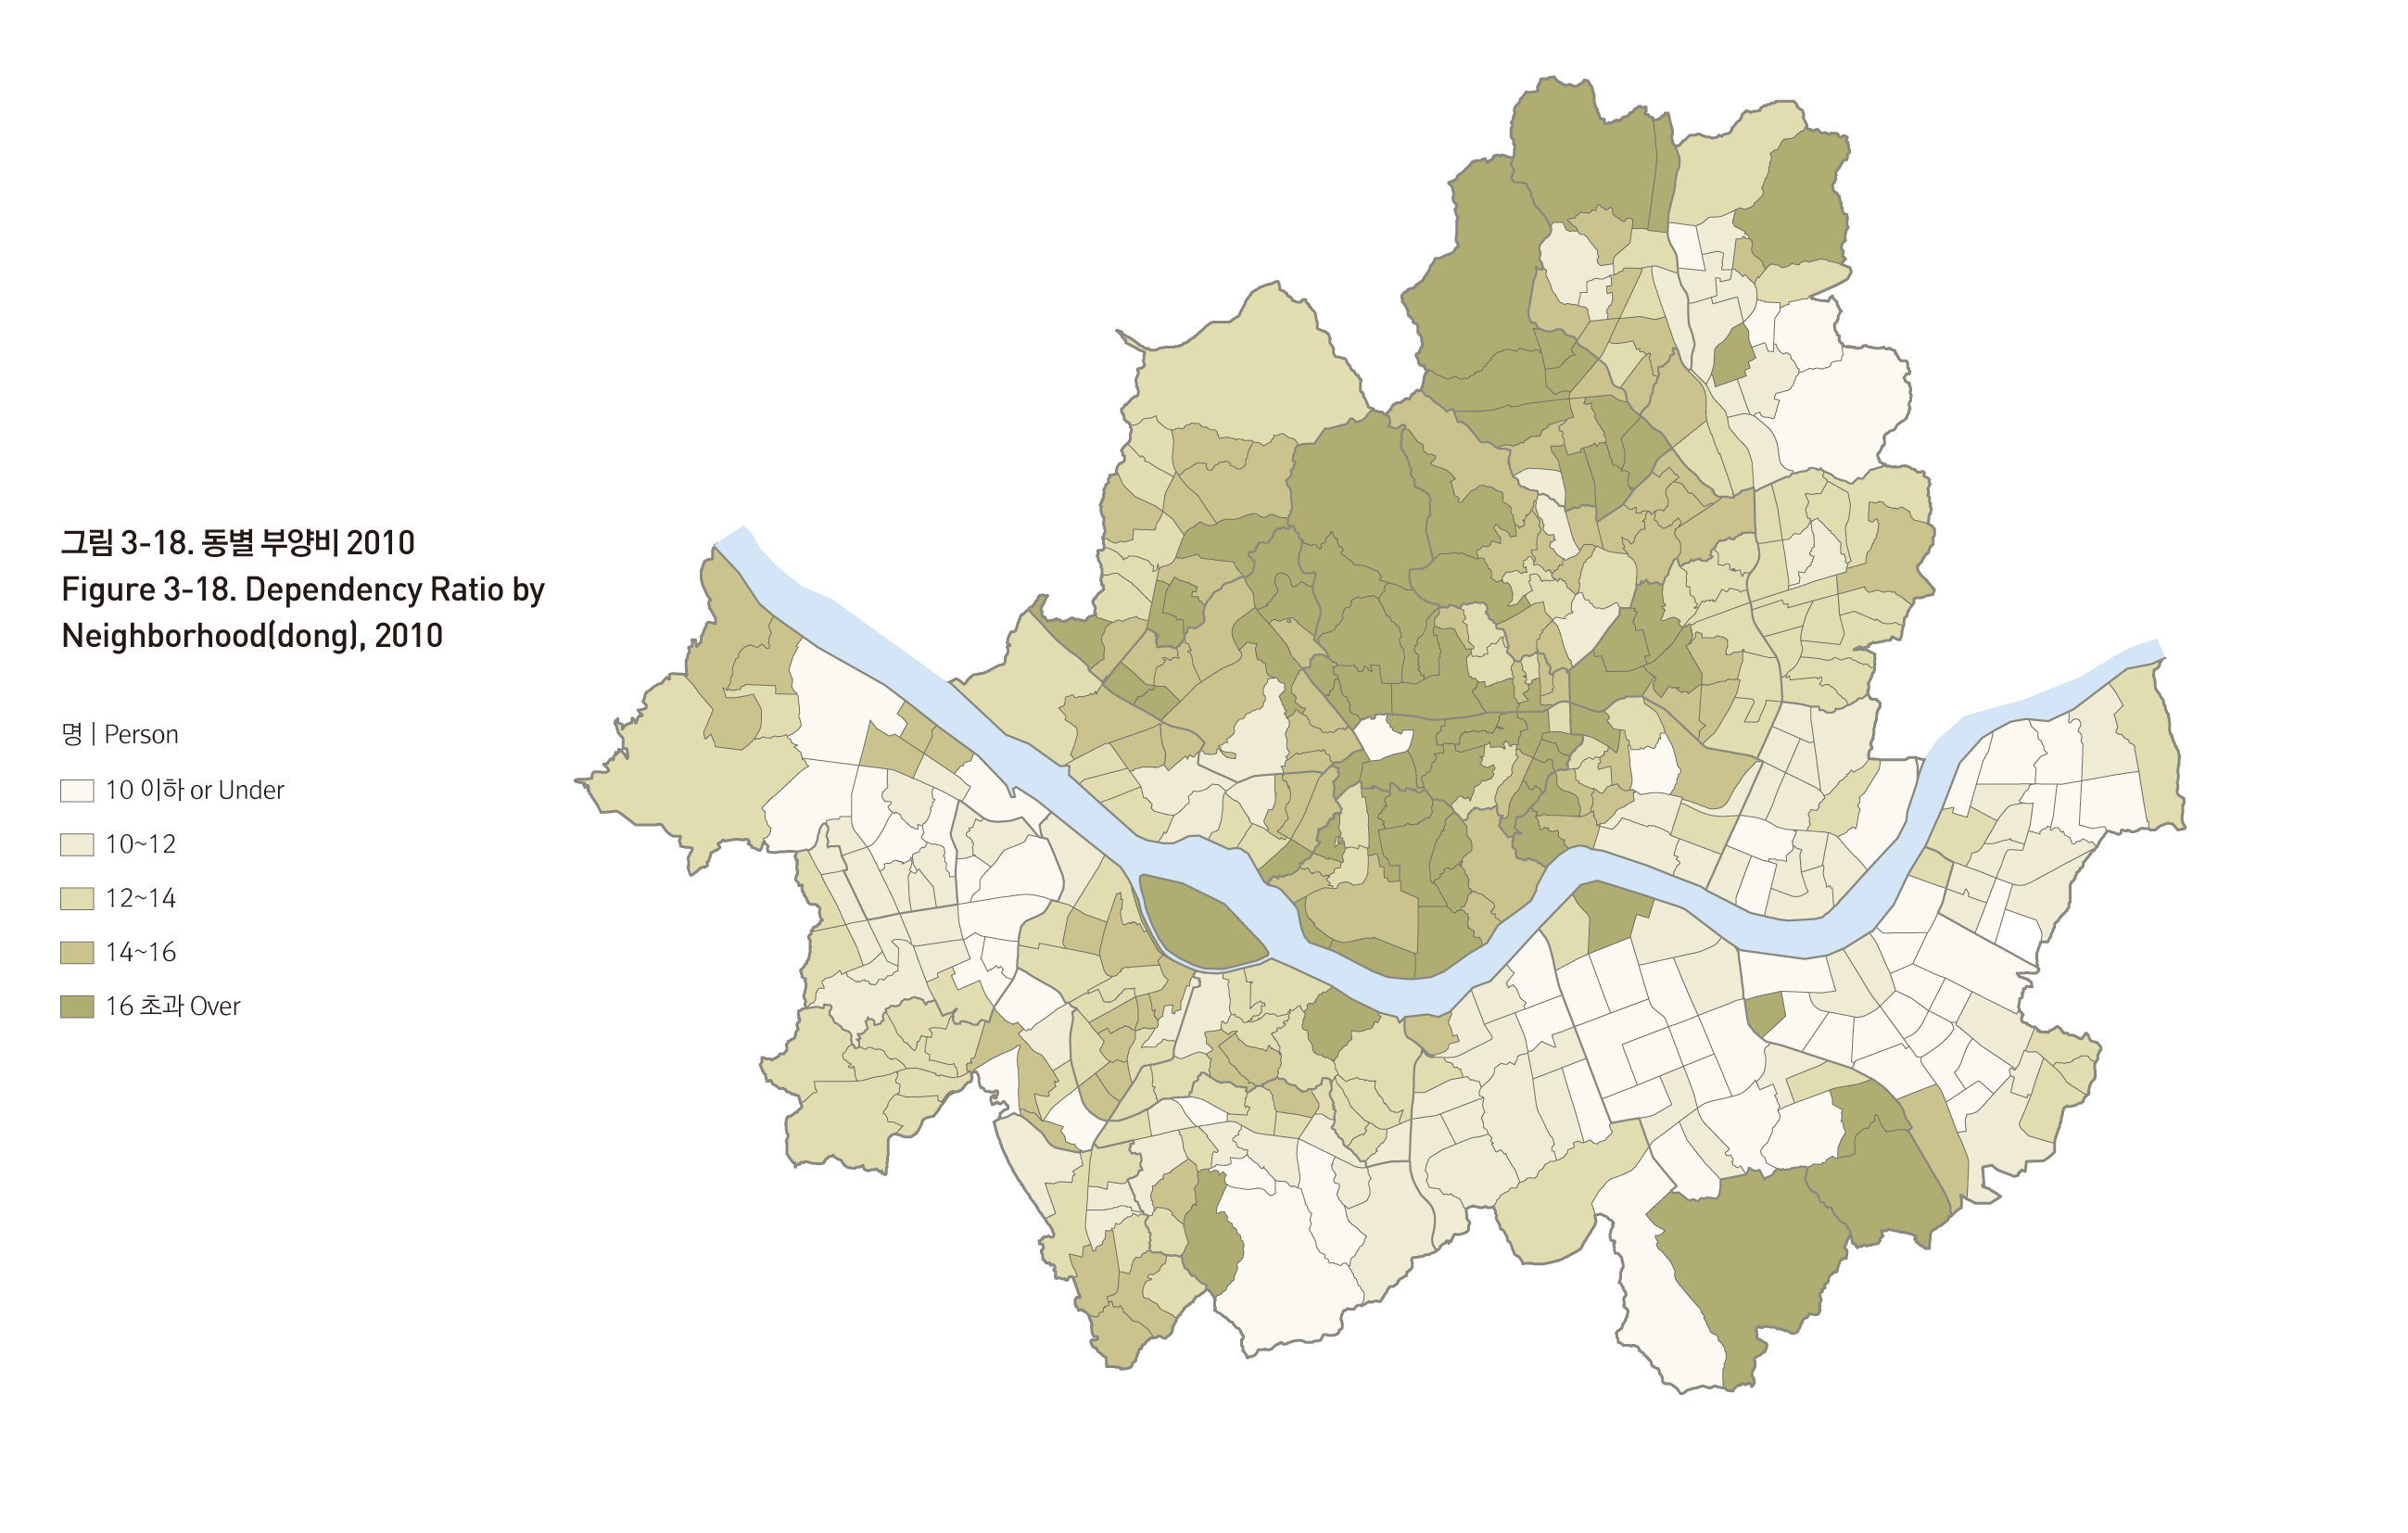
서울의 총부양비는 1980년에는 51.0이었지만, 30년이 지난 2010년에는 30.4로 크게 감소하였다. 2010년 기준 총부양비를 유소년부양비 및 노년부양비로 구분해 보면 유소년부양비는 18.2, 노년부양비는 12.2로 유소년부양비가 노년부양비보다 여전히 높다. 고령인구를 부양해야 하는 부담보다 유소년인구를 부양해야 하는 부담이 더 큰 것이다. 인구추계에 따르면 2016년에는 노년부양비가 16.2로 유소년부양비 15.8을 앞지르게 된다.Dependency Ratio
Due to low birth rates and the aging of the population, the youth population has declined, while the senior population has increased, as with the overall societal load of senior dependency. The continuation of low birth rate trends will reduce the overall dependency ratio, since the rate of decline in youth dependency will be greater than the growth in senior dependency.
The total dependency ratio in Seoul in 1980 was 51.0. As of 2010, these figures have decreased to 30.4, with youth dependency ratio remaining higher than the senior dependency ratio, at 18.2 and 12.2 respectively. According to population estimations, however, by 2016, the senior dependency ratio is projected rise to 16.2, outmatching the youth dependency ratio of 15.8.

출처 : 통계청, 국가통계포털(KOSIS)
출처 : 통계청, 국가통계포털(KOSIS)