
-
인구
인구구조
-
인구구조
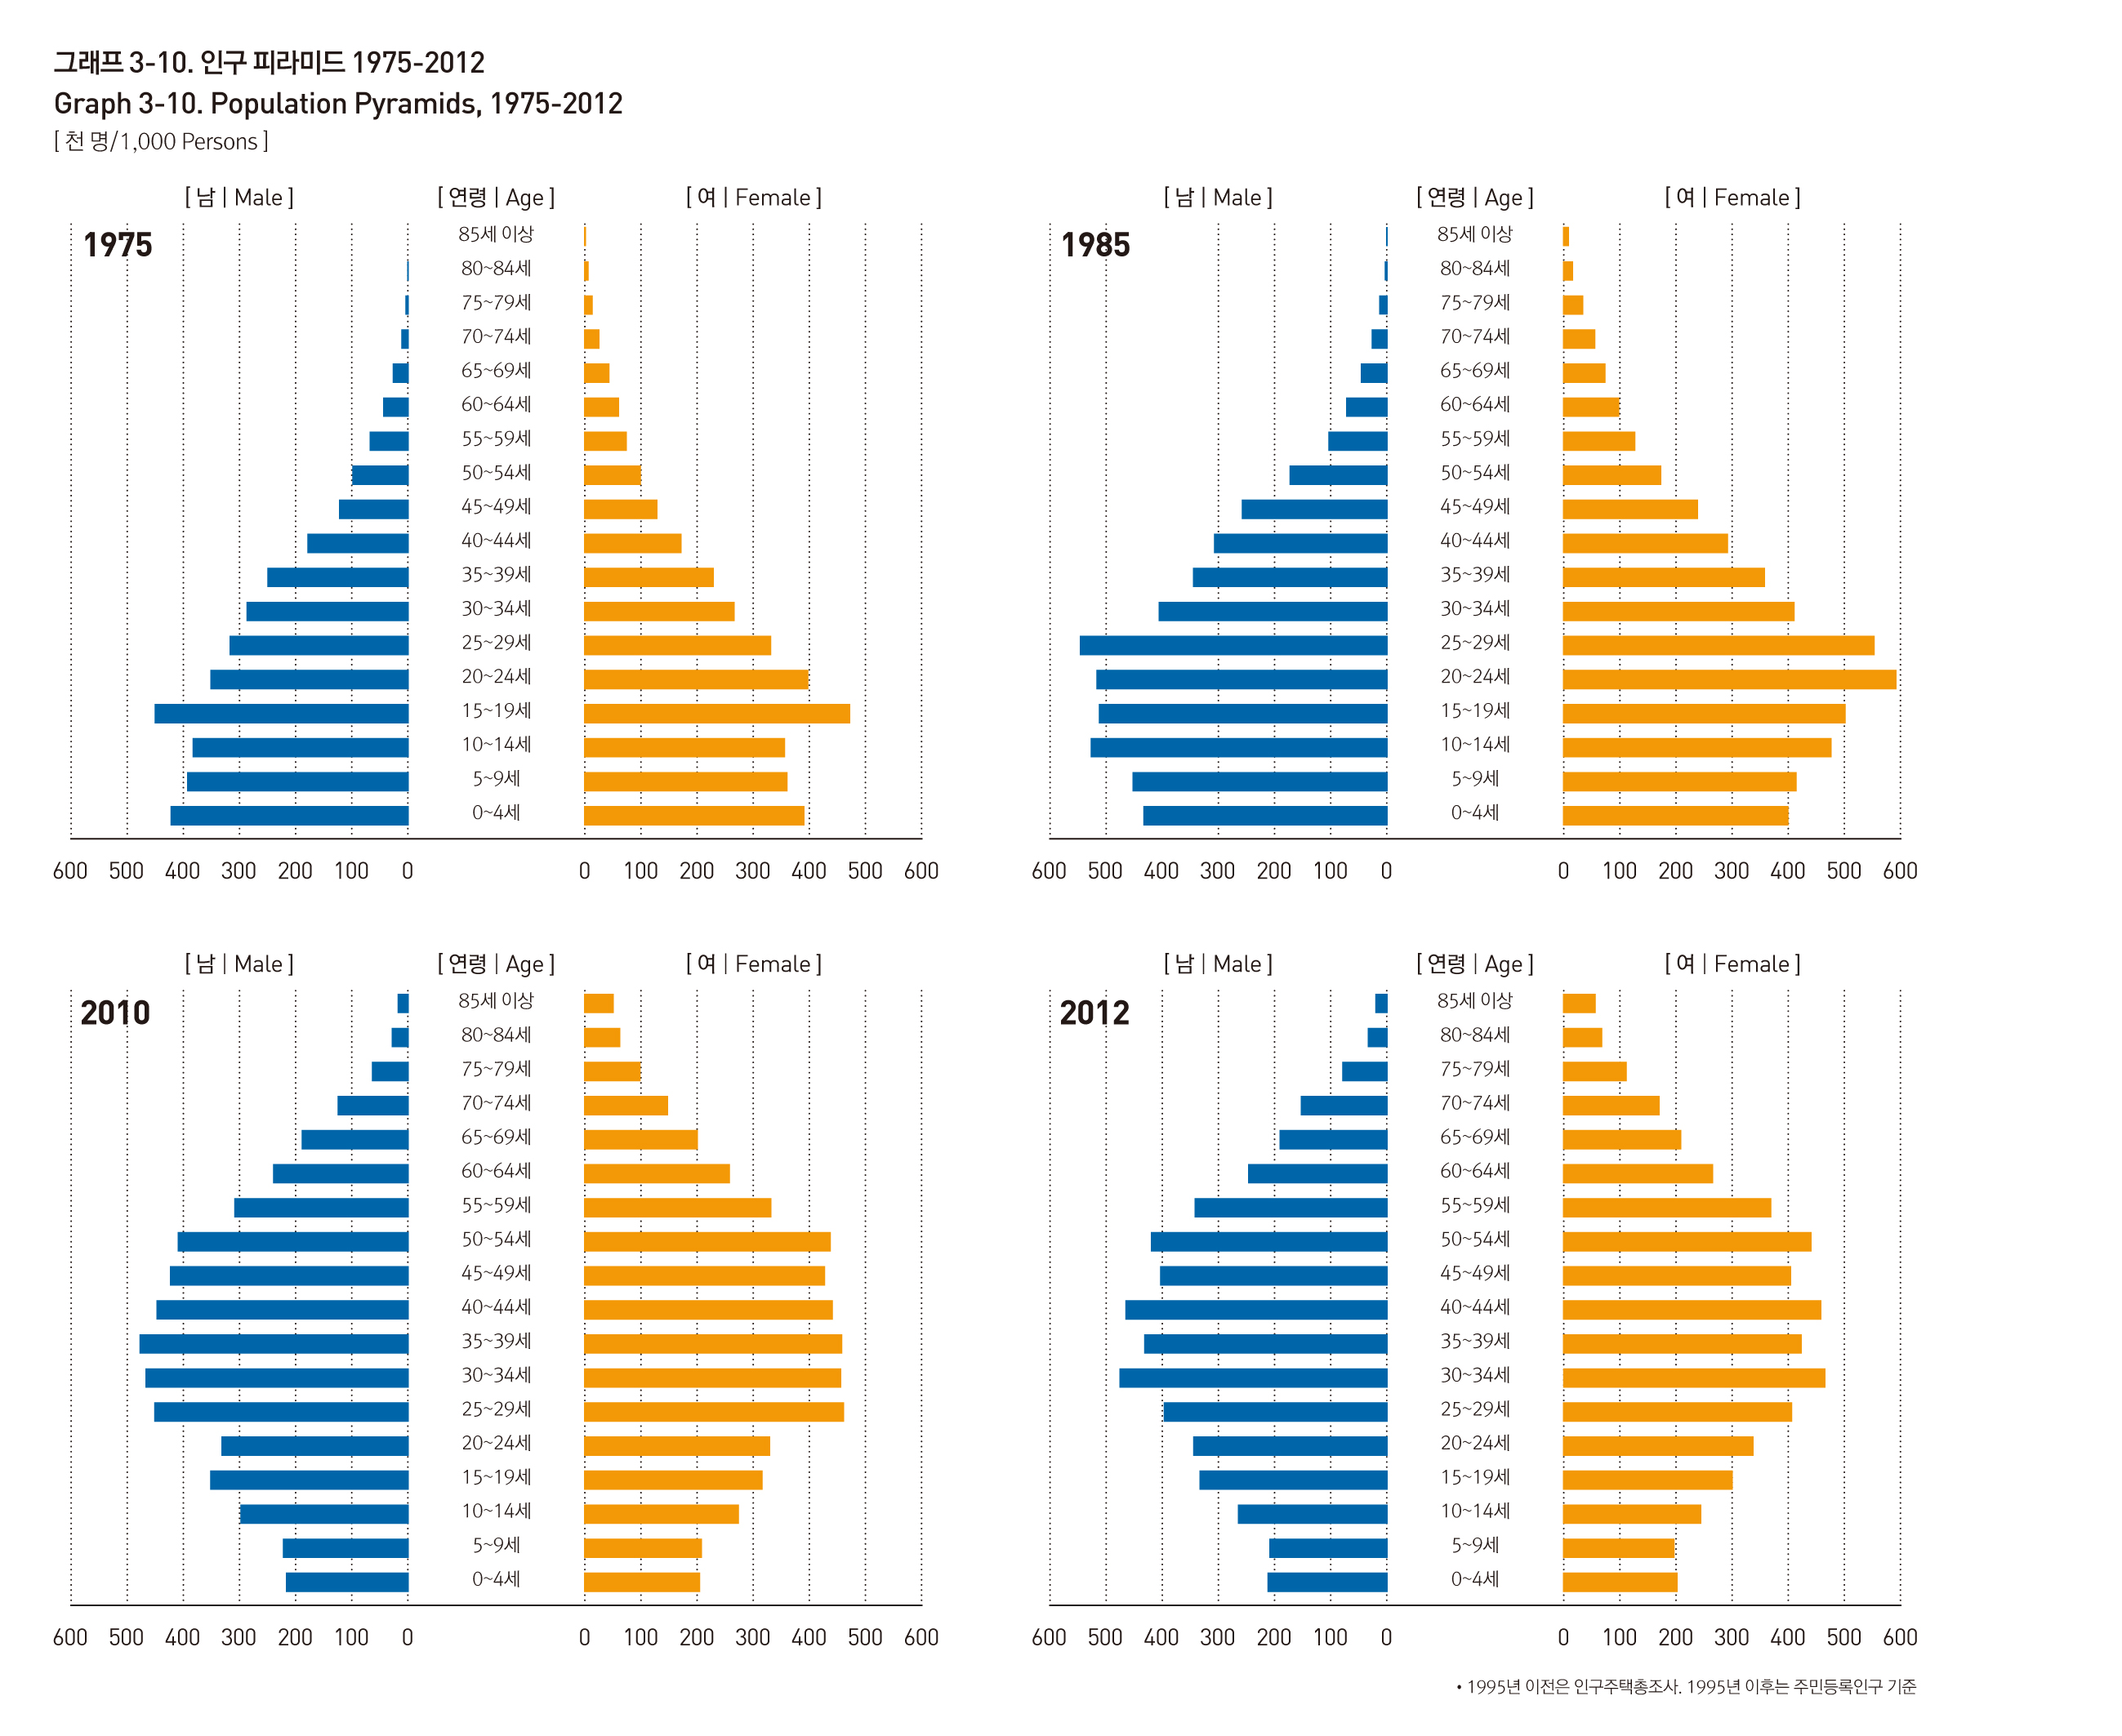
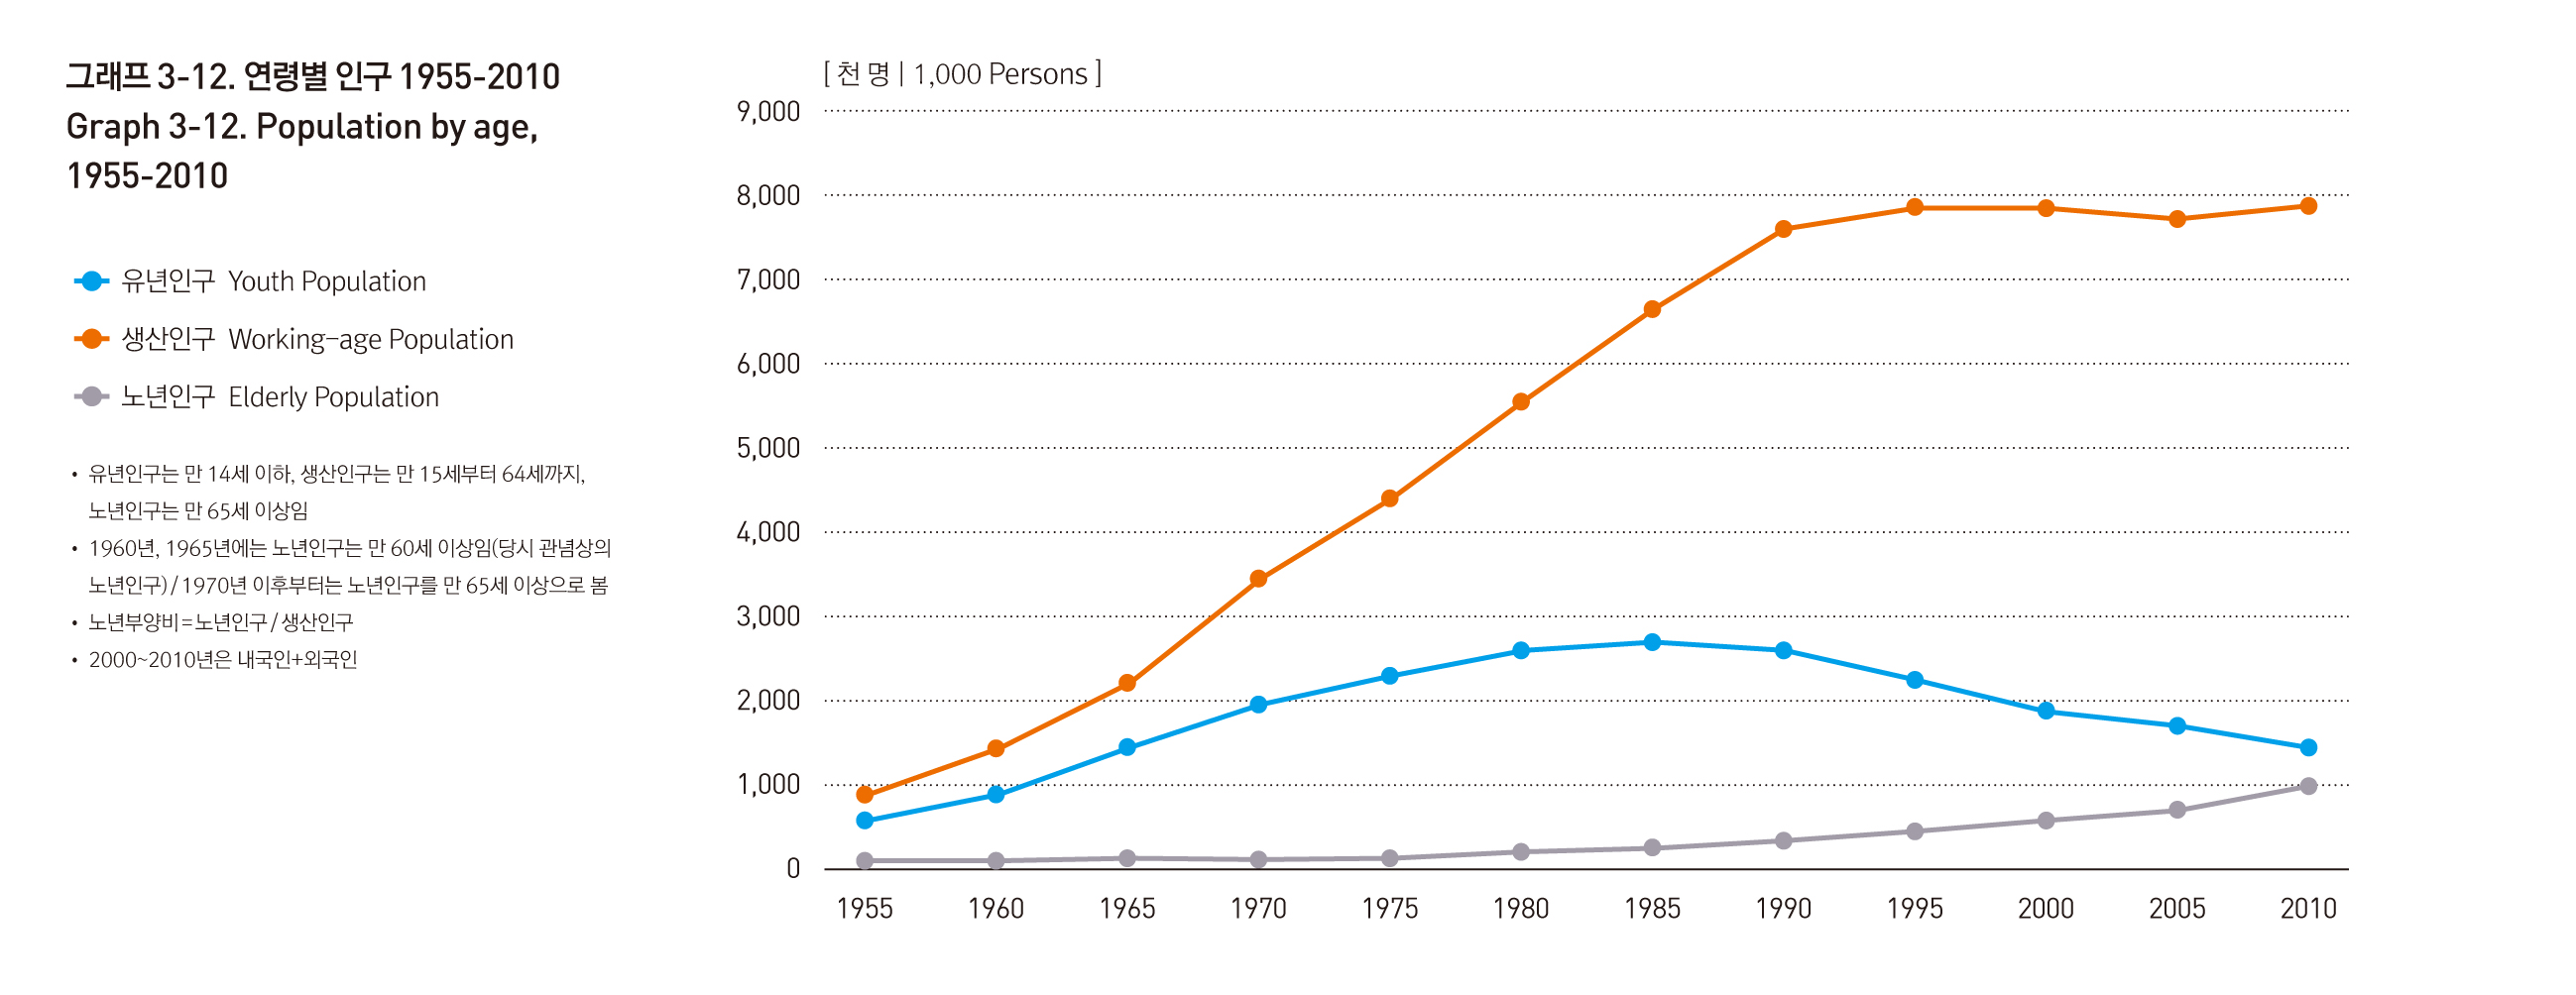
1955년부터 현재 시점까지 연령별 인구 특징을 살펴보면, 유년인구의 비율은 꾸준히 감소하였으며, 생산인구의 비율은 1990년대 후반부터 증가율이 둔화되어 절대규모가 감소하다가 2005년 이후 다시 증가하였다. 노년인구는 평균수명 연장과 사망률 감소로 전 기간에 걸쳐 절대수가 계속 증가한다. 인구피라미드는 1975년 아래가 넒은 피라미드 형태였으나, 출산율 감소와 고령화 현상으로 점차 종모양으로 변화하고 있다.
인구 천 명당 출생아 수를 나타내는 조출생률은 1970년부터 최근까지 점점 하락하는 추세를 보이는데, 1970년 23.9명에서 2010년 9.2명으로 줄어든 것으로 나타난다.
한편 인구 천 명당 사망한 인구수를 나타내는 조사망률은 1970년 3.9명에서 1975년 4.1명으로 증가하였으나, 이후 3.5~3.9명 수준으로 대체로 일정한 수준을 유지하고 있다.
Population Structure
Trends in population age structures from 1955 to the present show a steady decline in youth population. On the other hand, the working age population saw slowed growth and decline in the late 1990s, before taking an upward turn again after 2005. Due to the overall extension of life span and to the drop in mortality, the senior population has consistently risen through all periods. The graphs show a transition from the bottom-heavy pyramid of the 1975 graph to the bell figure graph of the later periods, which is due to the fall in birth rate and the aging of the population.
Crude birth rate has seen gradual decline, from 23.9 in 1970 to 9.2 in 2010. Crude death rate rose from 3.9 in 1970 to 4.1 in 1975, but has since then remained mostly consistent at 3.5~3.9.

출처 : 통계청, 국가통계포털(KOSIS)
서울특별시, 서울통계

출처 : 통계청, 국가통계포털(KOSIS)
유아인구
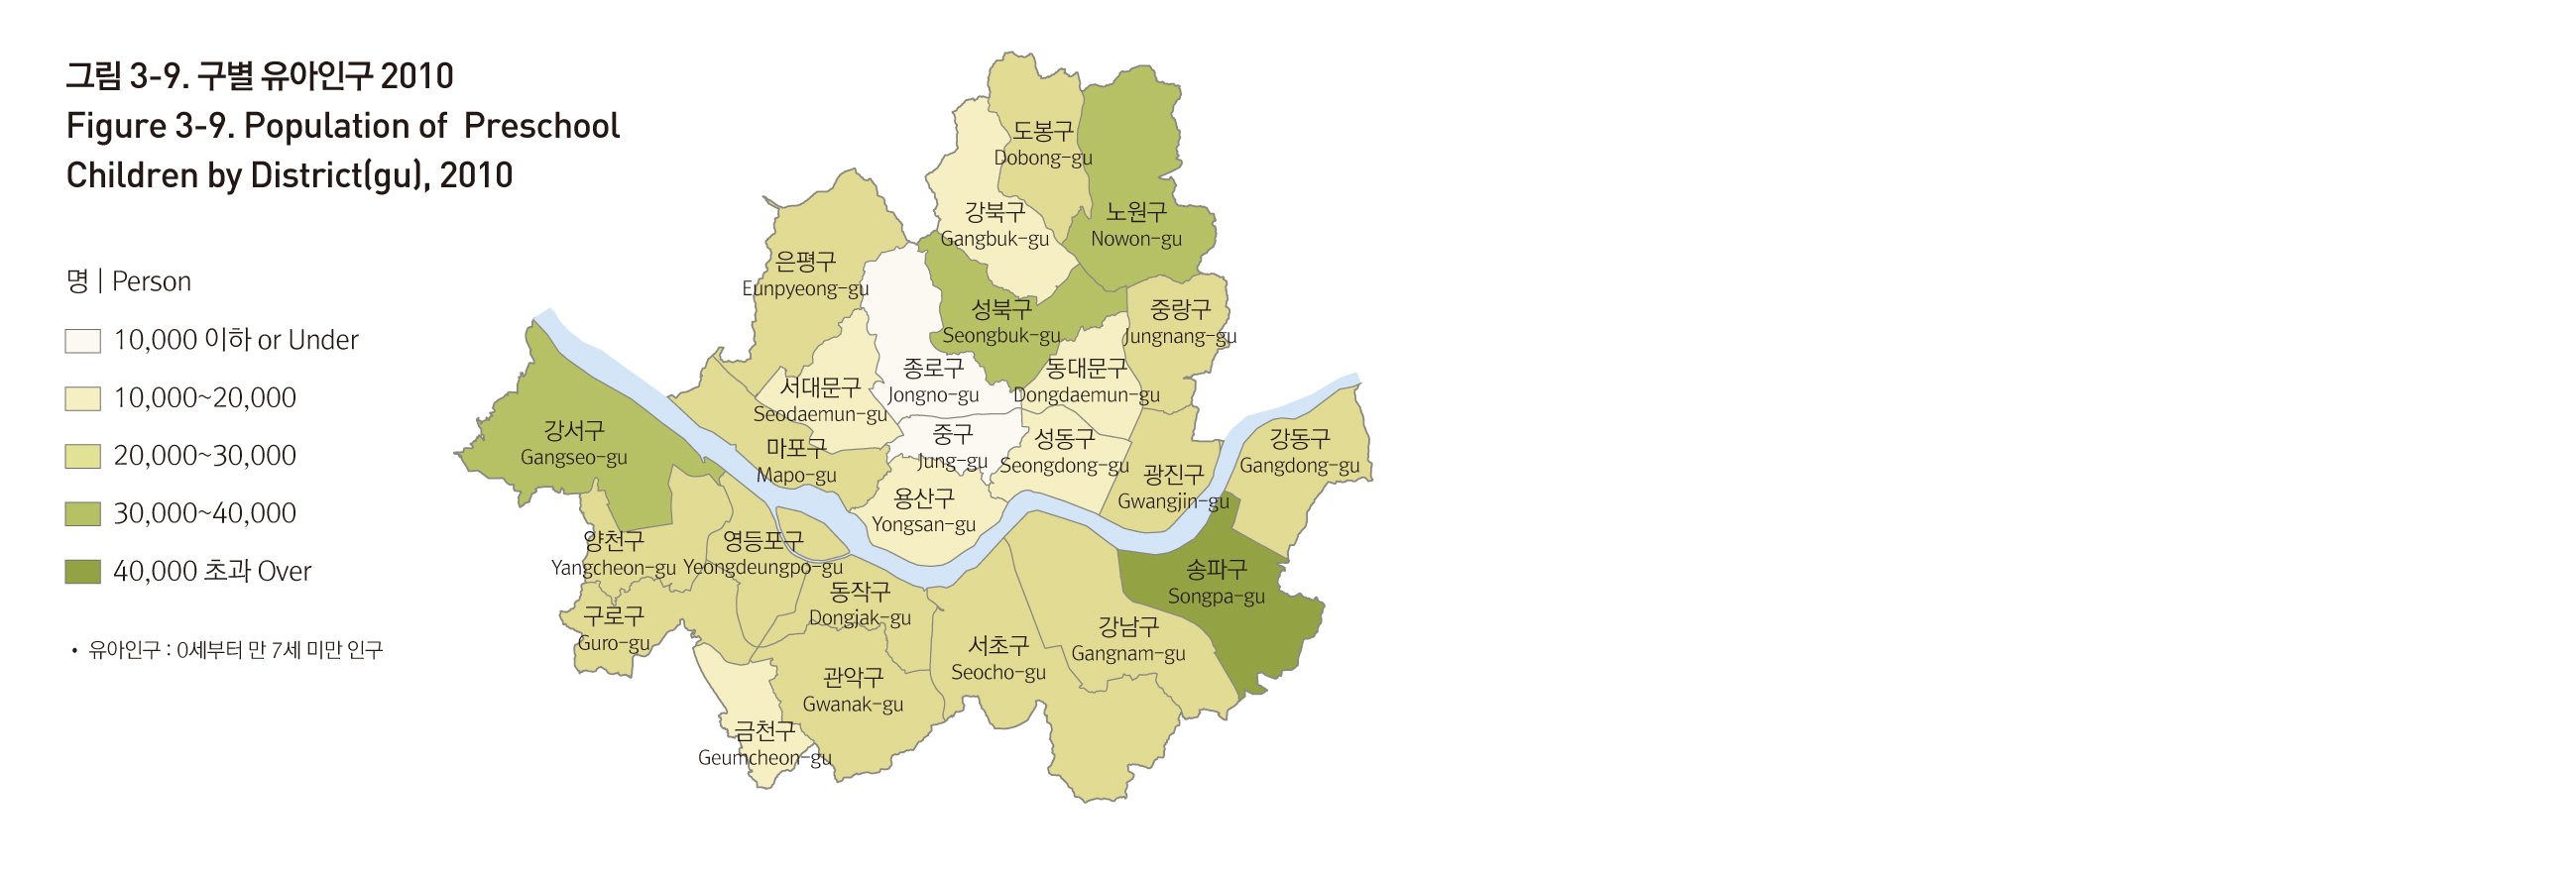
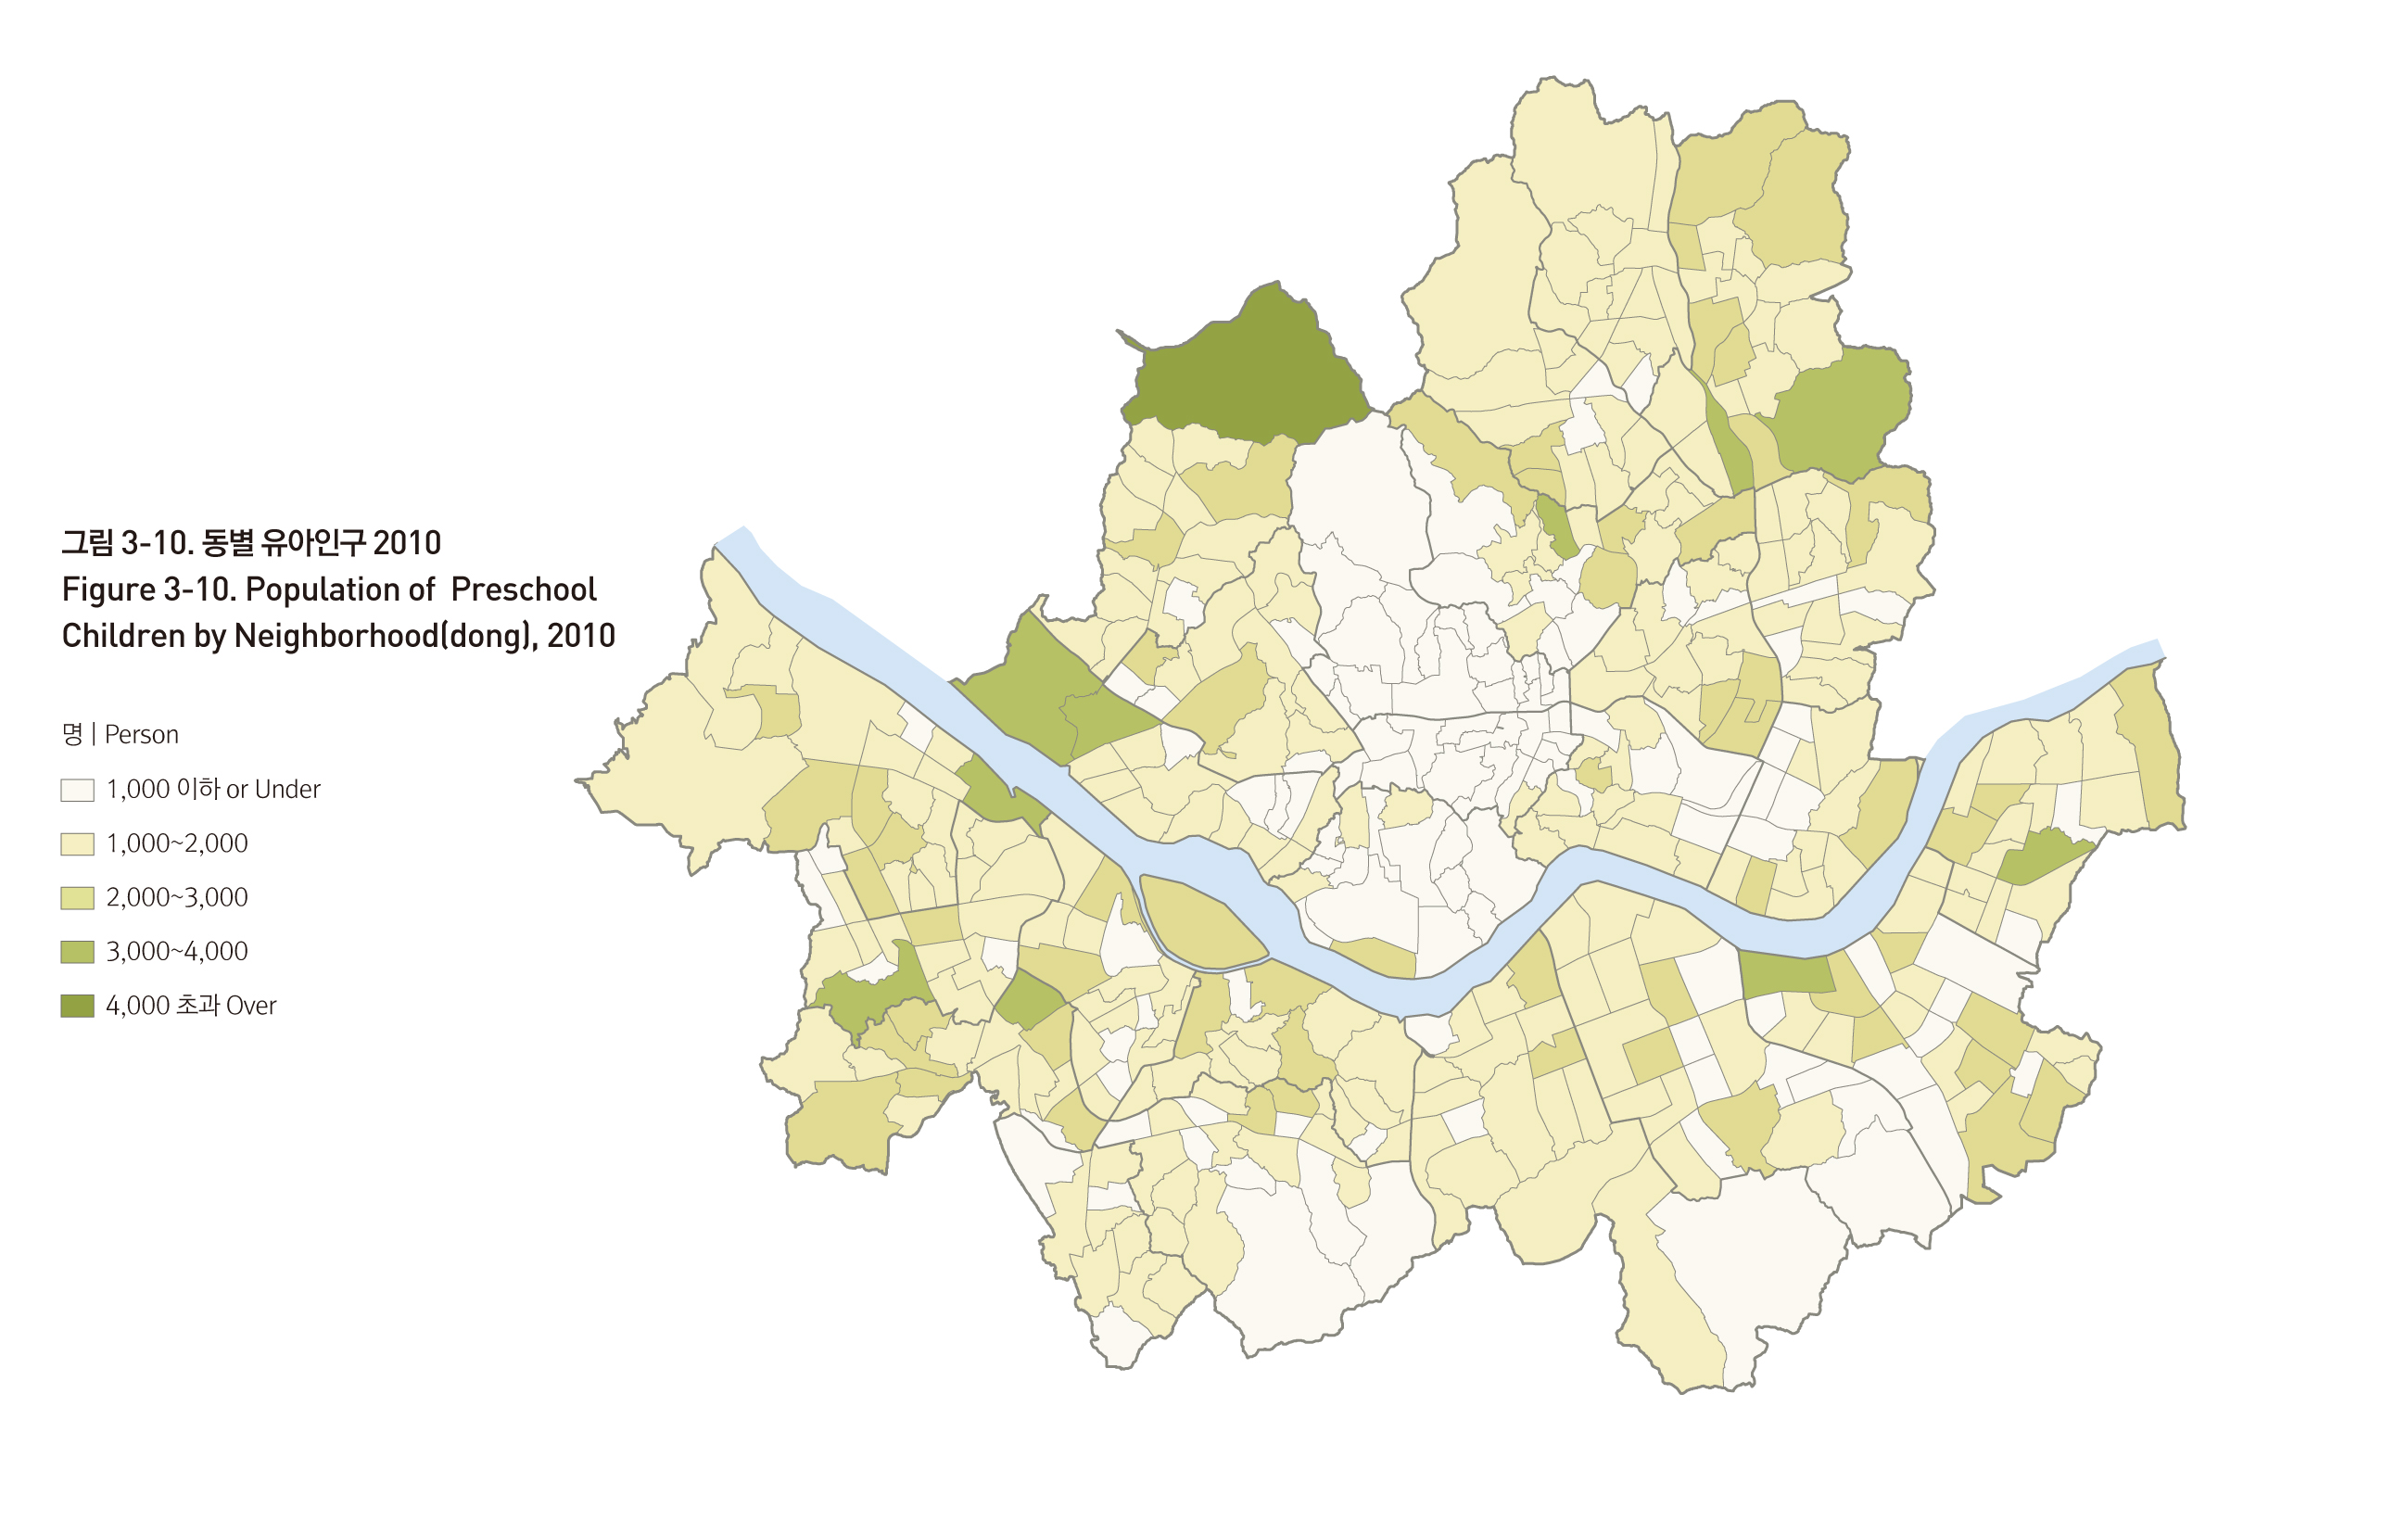
서울시 유아인구는 588,203명으로 전체 인구의 약 6.1%를 차지한다. 유아가 가장 많이 거주하는 자치구는 송파구(40,839명)이고 그 다음으로는 강서구(36,052명), 노원구(36,005명) 순이다. 동별로 보면 은평구 진관동(4,356명)에 가장 많이 거주하고 있다.
population of preschool childrenThe population of preschool children in Seoul is 588,203 which accounts for 6.1% of the national total. Songpa-gu (40,839) is the district with the highest population of preschool children, followed by Gangseo-gu (36,052) and Nowon-gu (36,005). Among neighborhoods, Jingwan-dong in Eunpyeong-gu (4,356) has the highest number of preschool children.
출처 : 서울특별시, 서울통계, 주민등록인구, 2010년
학령층인구
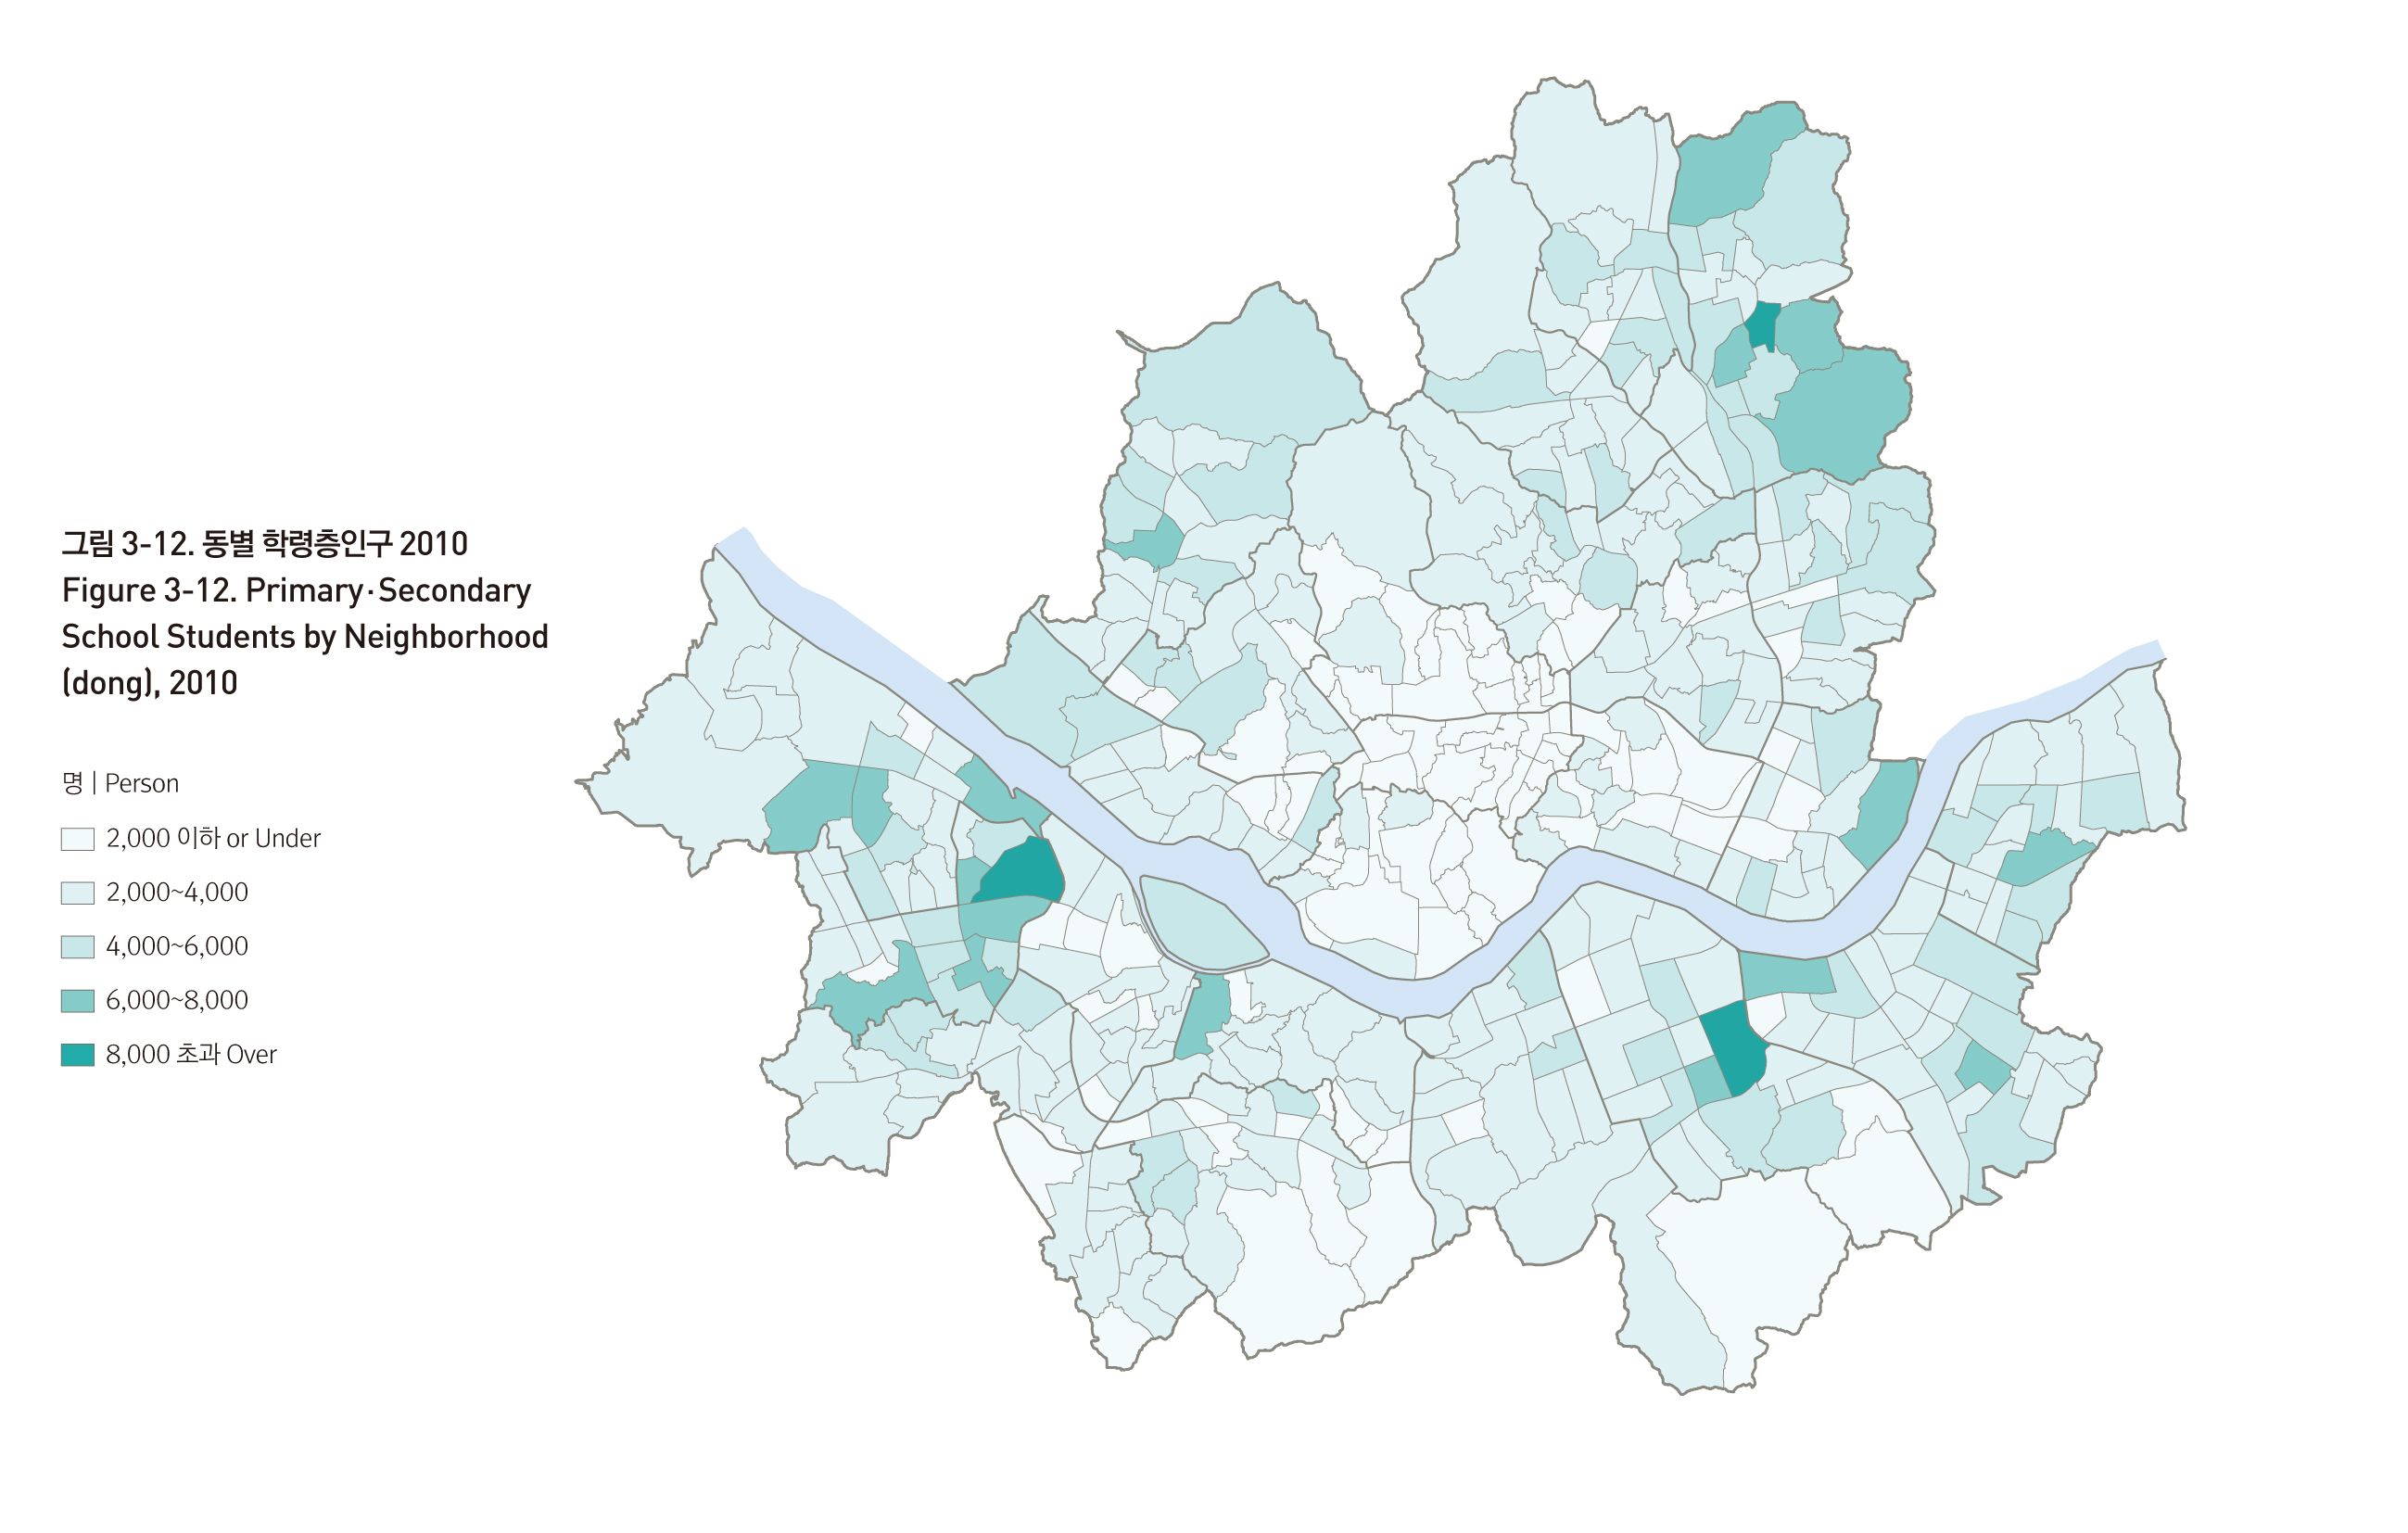
서울시 학령층인구는 1,294,244명으로 전체 인구의 약 13.4%를 차지한다. 학령층인구가 가장 많이 거주하는 자치구는 노원구(94,525명)이고 그 다음으로는 송파구(93,619명), 종로구(20,216명) 순이다. 동별로 보면 양천구 목5동(10,834명)에 가장 많이 거주하고 있다.
Population of School-age StudentsThere are 1,294,244 school-age students in Seoul which accounts for 13.4% of the national total. Nowon-gu (94,525) is the district with the highest population of school-age students, followed by Songpa-gu (93,619) and Jongno-gu (20,216). Among neighborhoods, Mok5-dong in Yangchegu (10,834) has the highest number of school-age students.

출처 : 서울특별시, 서울통계, 주민등록인구, 2010년
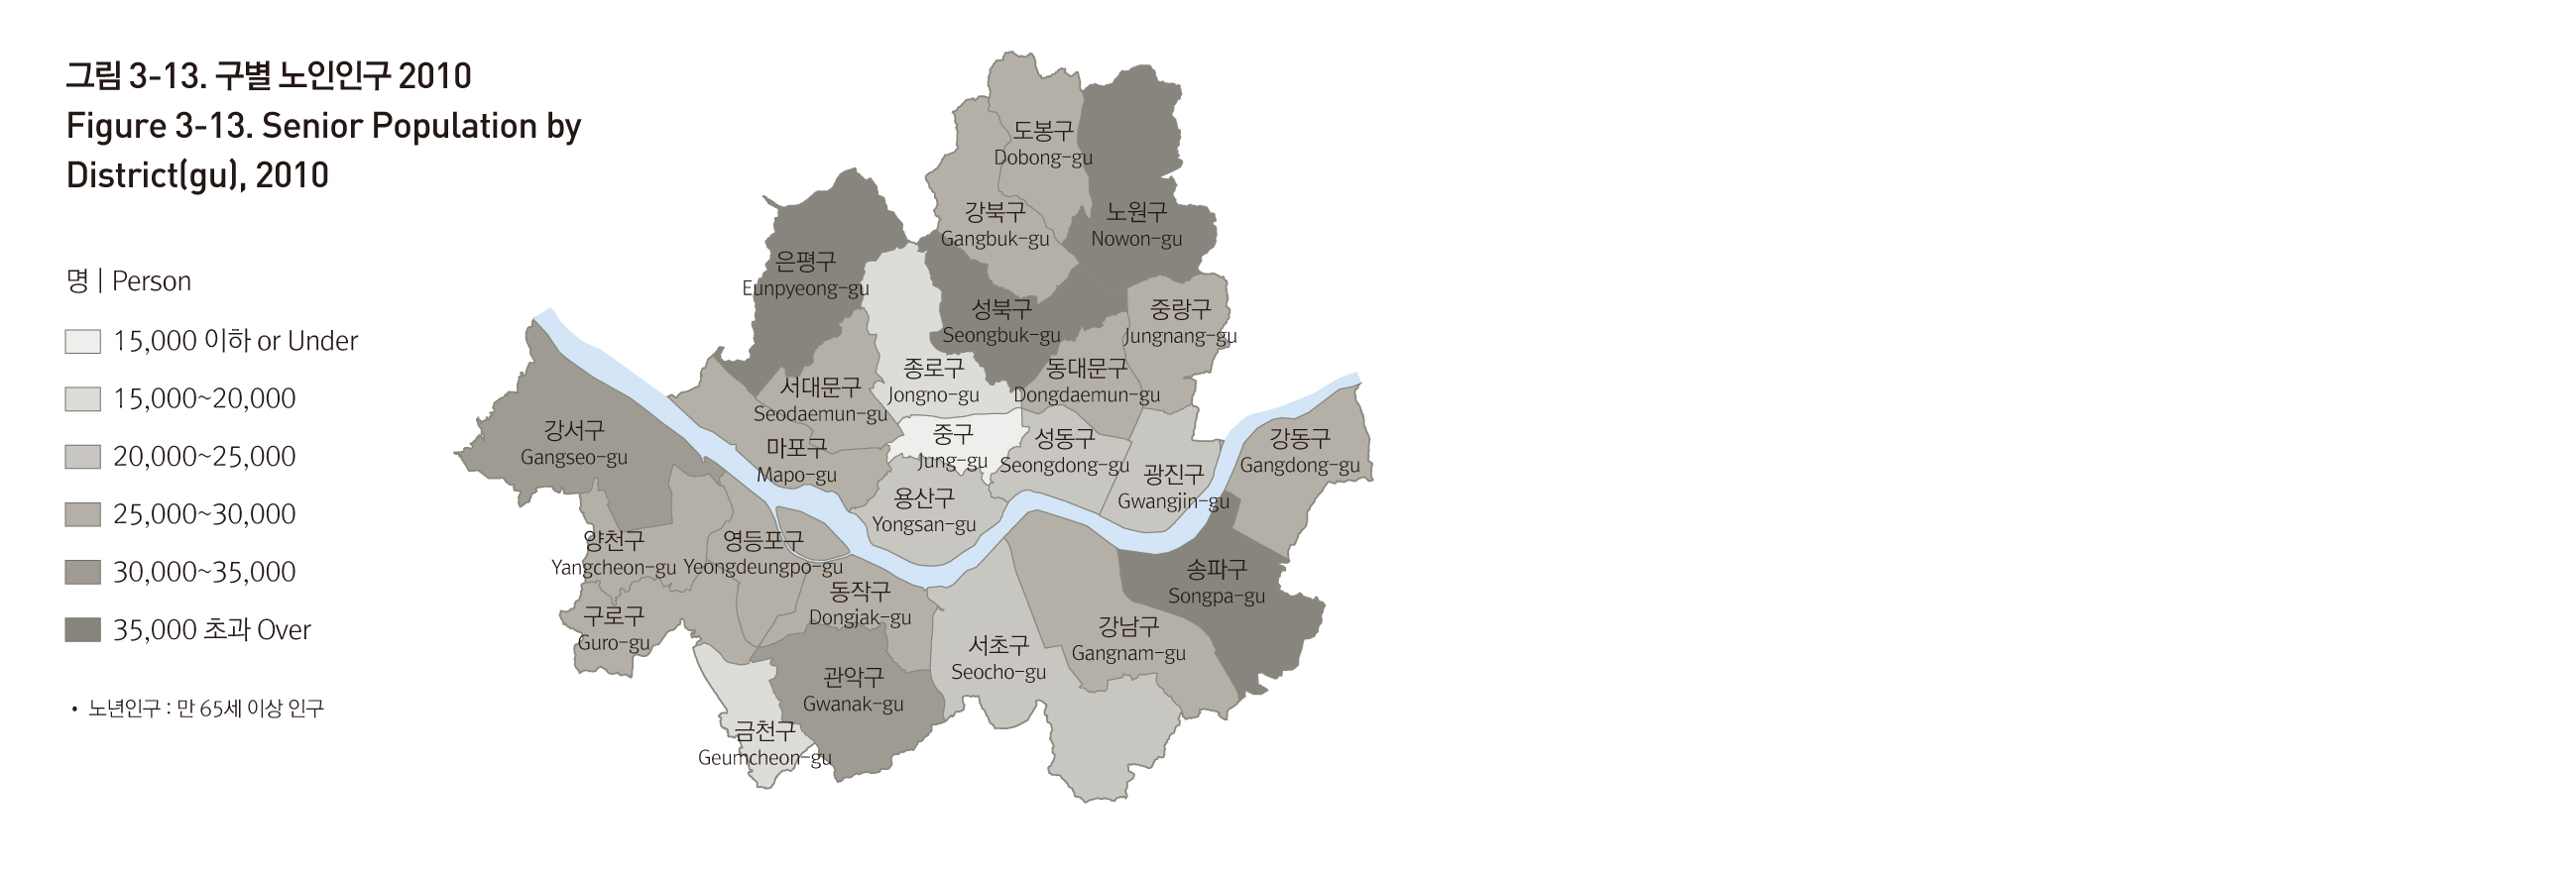
노년인구
서울시 노년인구는 928,956명으로 전체 인구(내국인)의 약 9.7%를 차지한다. 노년인구가 가장 많이 거주하는 자치구는 노원구(54,334명)이고, 그 다음으로는 은평구(49,849명), 성북구(48,843명) 순이다. 동별로 보면 노원구 상계3·4동(4,931명)에 가장 많이 거주하고 있다.
Senior Population
The senior population in Seoul is 928,956 which accounts for 9.7% of the national total(Local). The district with the highest senior population is Nowon-gu (54,334), followed by Eunpyeong-gu (49,849) and Seongbuk-gu (48,834). By neighborhood, Sanggye 3 and 4 dong in Nowon-gu is the highest in senior population.

출처 : 서울특별시, 서울통계, 주민등록인구, 2010년
연령별 인구
유소년인구의 구성비는 출산율의 감소로 인해 1955년 38.5%에서 2010년 13.9%로 절반 이하 수준으로 감소하였다. 생산인구의 구성비는 1955년 전체 인구의 59.3%에서 2010년 전체 인구의 76.7%로 증가하였다. 노년인구는 1970년대 후반부터는 꾸준히 증가하는 추세이다. 특히 2000년 5.4%에 불과하던 노년인구가 2005년에는 7.2%로 증가하면서 고령화 사회로 진입하였으며 2010년 현재 노년인구는 전체 인구(내국인+외국인)의 약 9.3%를 차지한다.
Population by Age
Due to birth rate declines, the proportion of youth population decreased from 38.5% in 1955 to 13,9% in 2010. In contrast, the working age population increased from 59.3% of the total population in 1955 to 76.7% in 2010. The senior population has also steadily grown since the late 1970s. Senior population accounted for only 5.4% in 2000, but rose to 7.2% in 2005 as Korea became an aging society. Today senior population stands at 9.3% of the total population(Local + Foreign nationals).
출처 : 통계청, 인구주택총조사
서울특별시, 서울통계