
-
환경
대기질
-
대기질
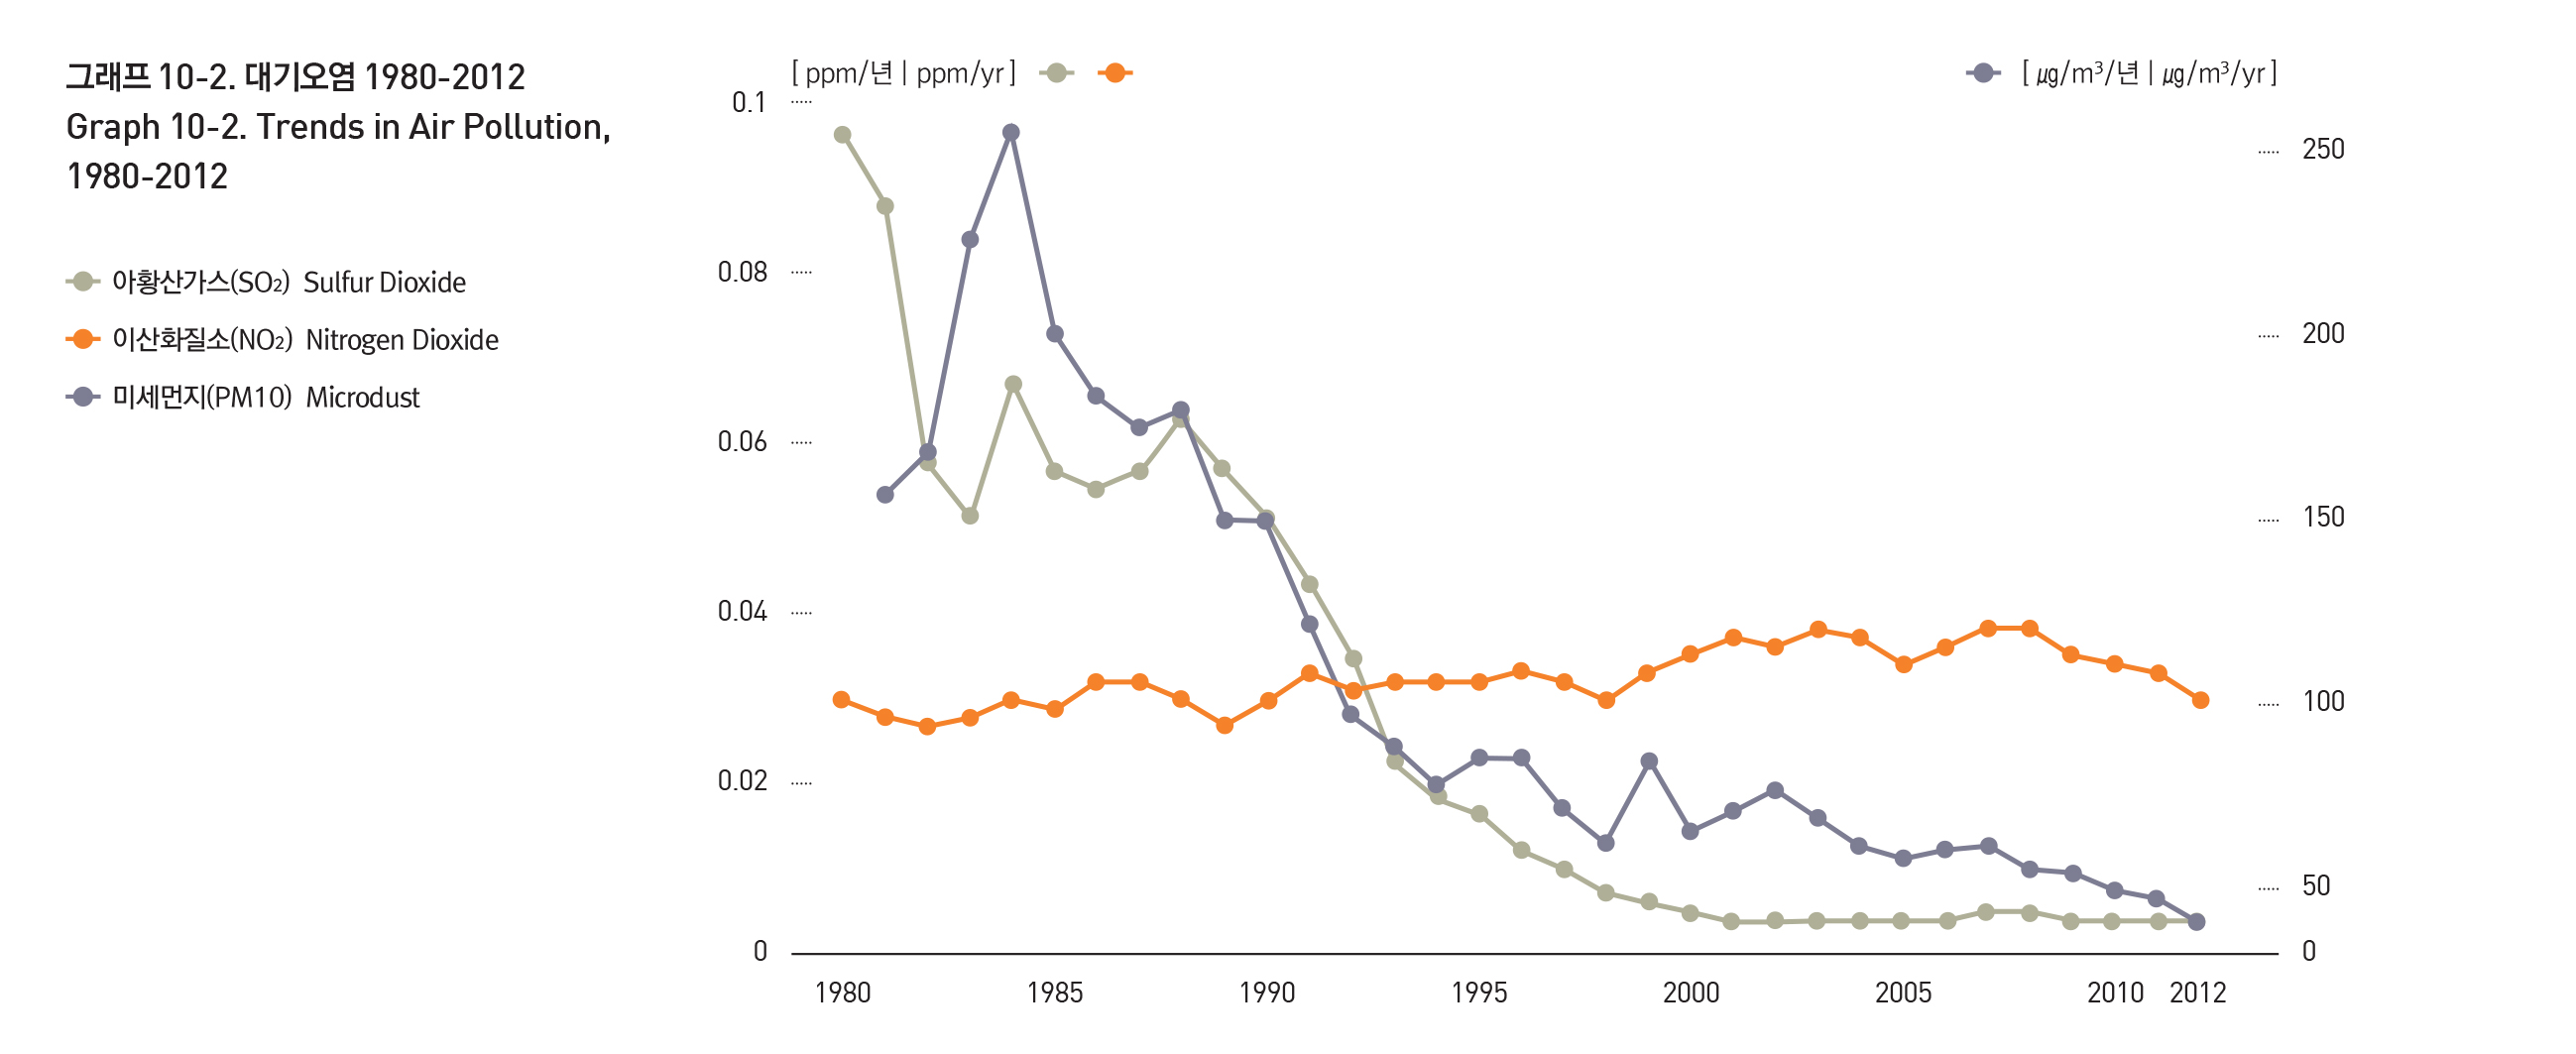
1960~1970년대의 인구증가와 산업발전, 그리고 자동차의 증가 등으로 1980년대까지 서울의 대기오염은 심각한 상태였다. 그러나 1988년 청정연료 사용을 의무화하고 대기오염원에 대한 각종 규제가 실시된 결과 서울의 대기오염은 개선되기 시작하였다.
서울의 미세먼지 수준은 1981년에 당시 서울시 연평균 기준치인 60㎍/㎡의 2.6배에 해당하는 156㎍/㎡이었다가 1984년 254㎍/㎡를 정점으로 감소하였다.
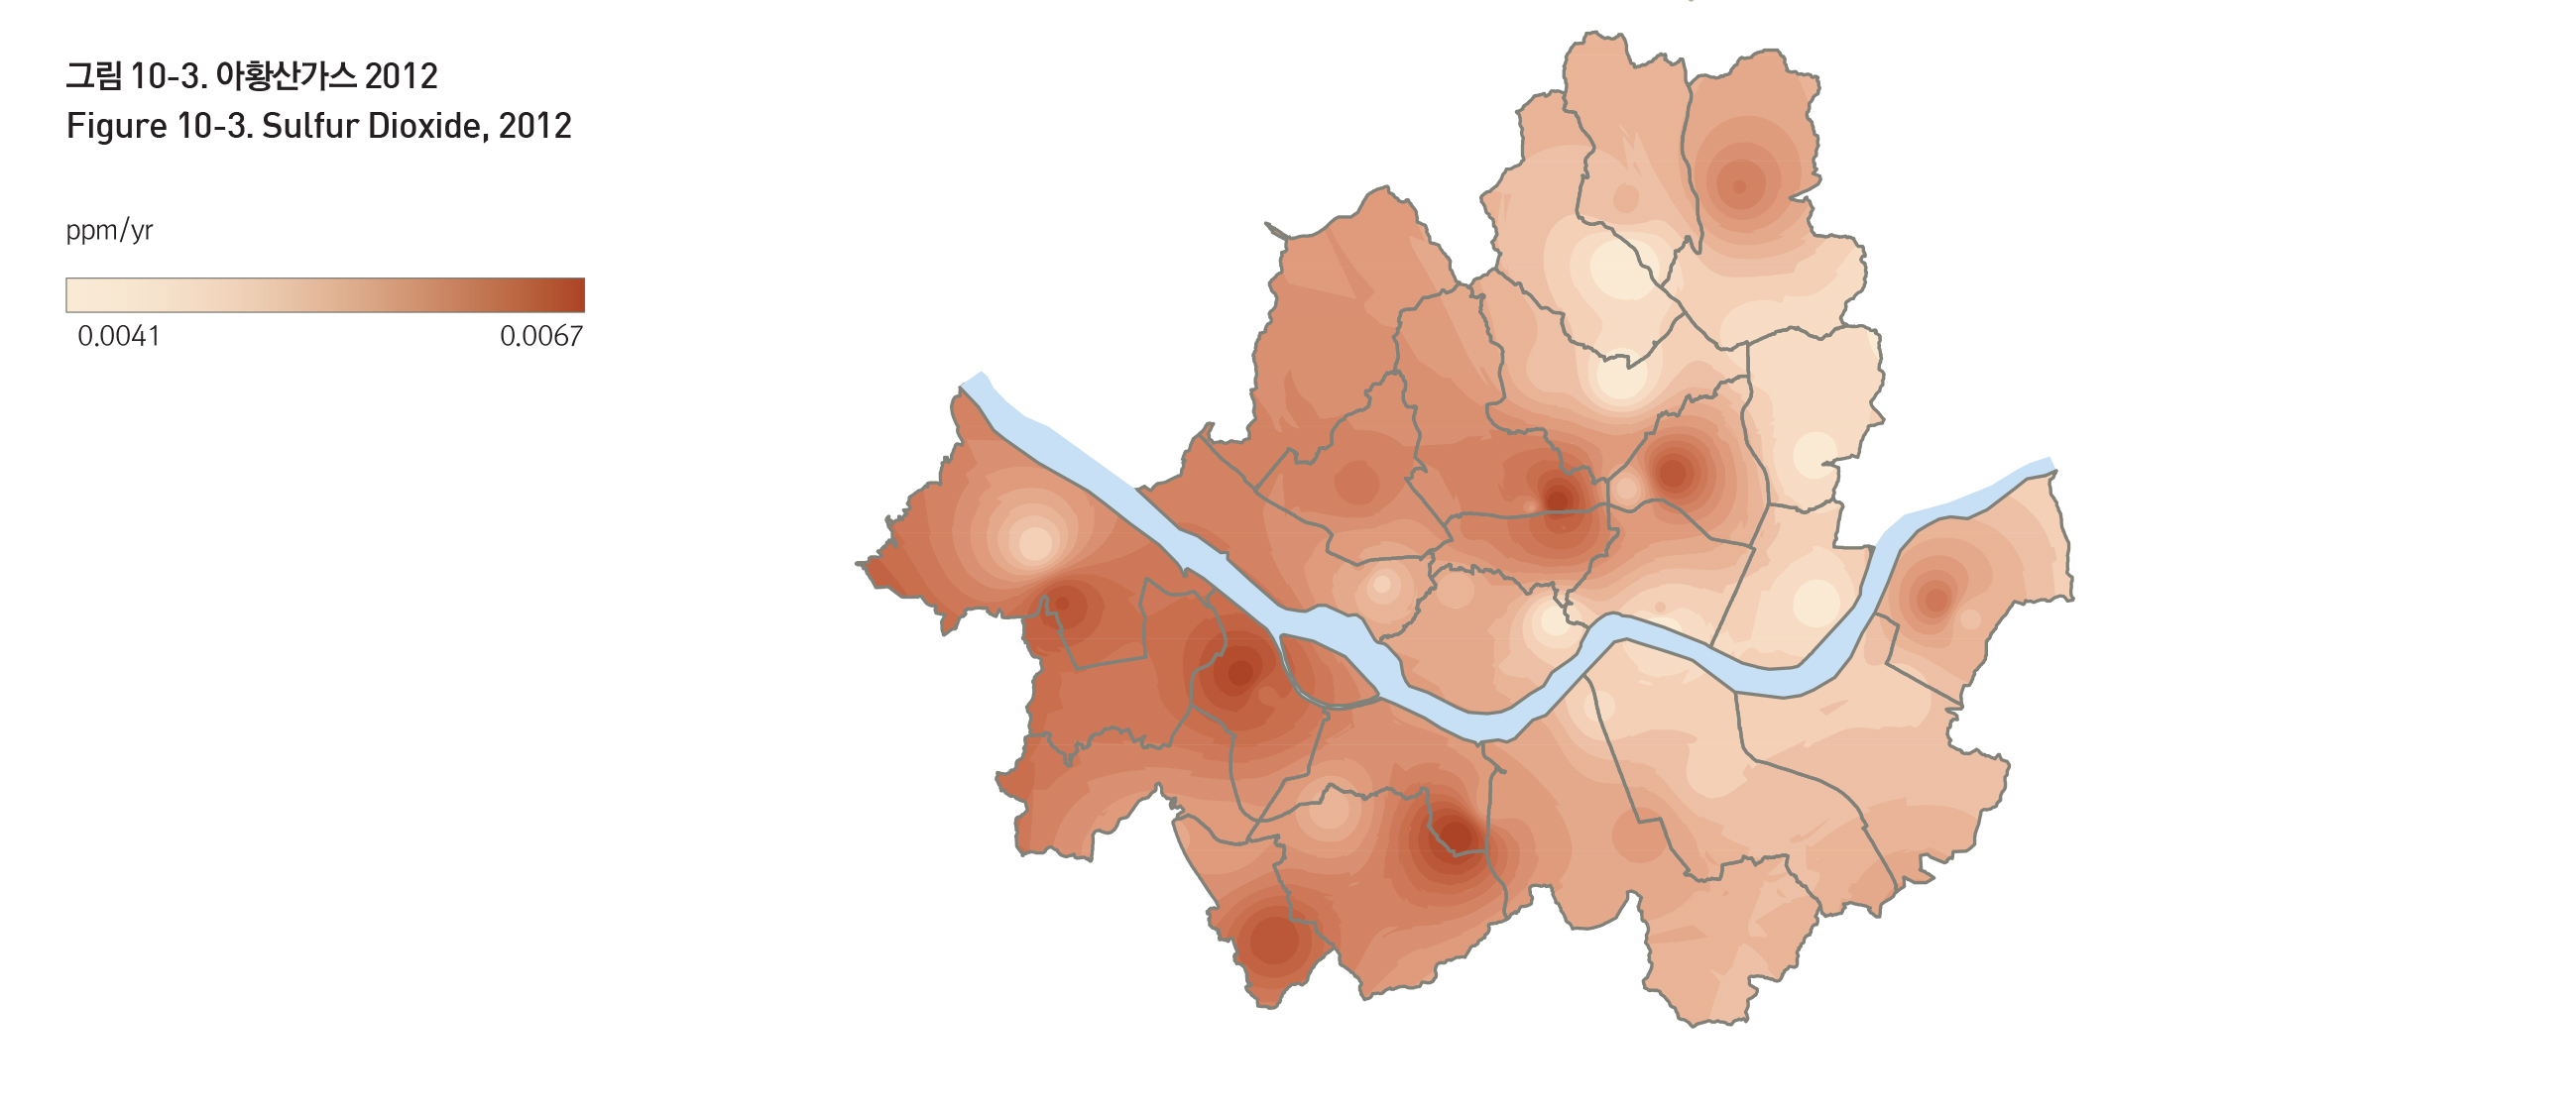
2012년 현재 41㎍/㎡으로 서울시 연평균 기준에 부합하고 있다. 아황산가스는 1980년 0.094ppm으로 가장 높았는데, 이는 서울시 연평균 기준치인 0.01ppm의 9.4배에 해당한다. 2012년 현재 아황산가스의 농도는 0.005ppm이다.
AIR QUALITY
Air pollution became a serious problem in Seoul in the 1980s, due to the hike in the number of licensed automobiles in the 1980s and the rapid population and industrial growth of the 1960-70s. Seoul's air quality began to improve after regulations were placed on sources of air pollution, such as requirements on natural fuel use in 1988. In 1981, the level of PM-10 in Seoul was at 156㎍/㎡, about 2.6 times higher than the regulation standards of 60㎍/㎡. After reaching its peak in 1984 at 254㎍/㎡, PM-10 levels began to decline. As of 2012, PM-10 levels are currently at 41㎍/㎡, safely below the city's annual regulation standards. In 1980, the SO2 levels were at their highest at 0.094ppm, over 9.4 times the regulation standards. They steadily declined thereafter, remaining at 0.005ppm as of 2012.
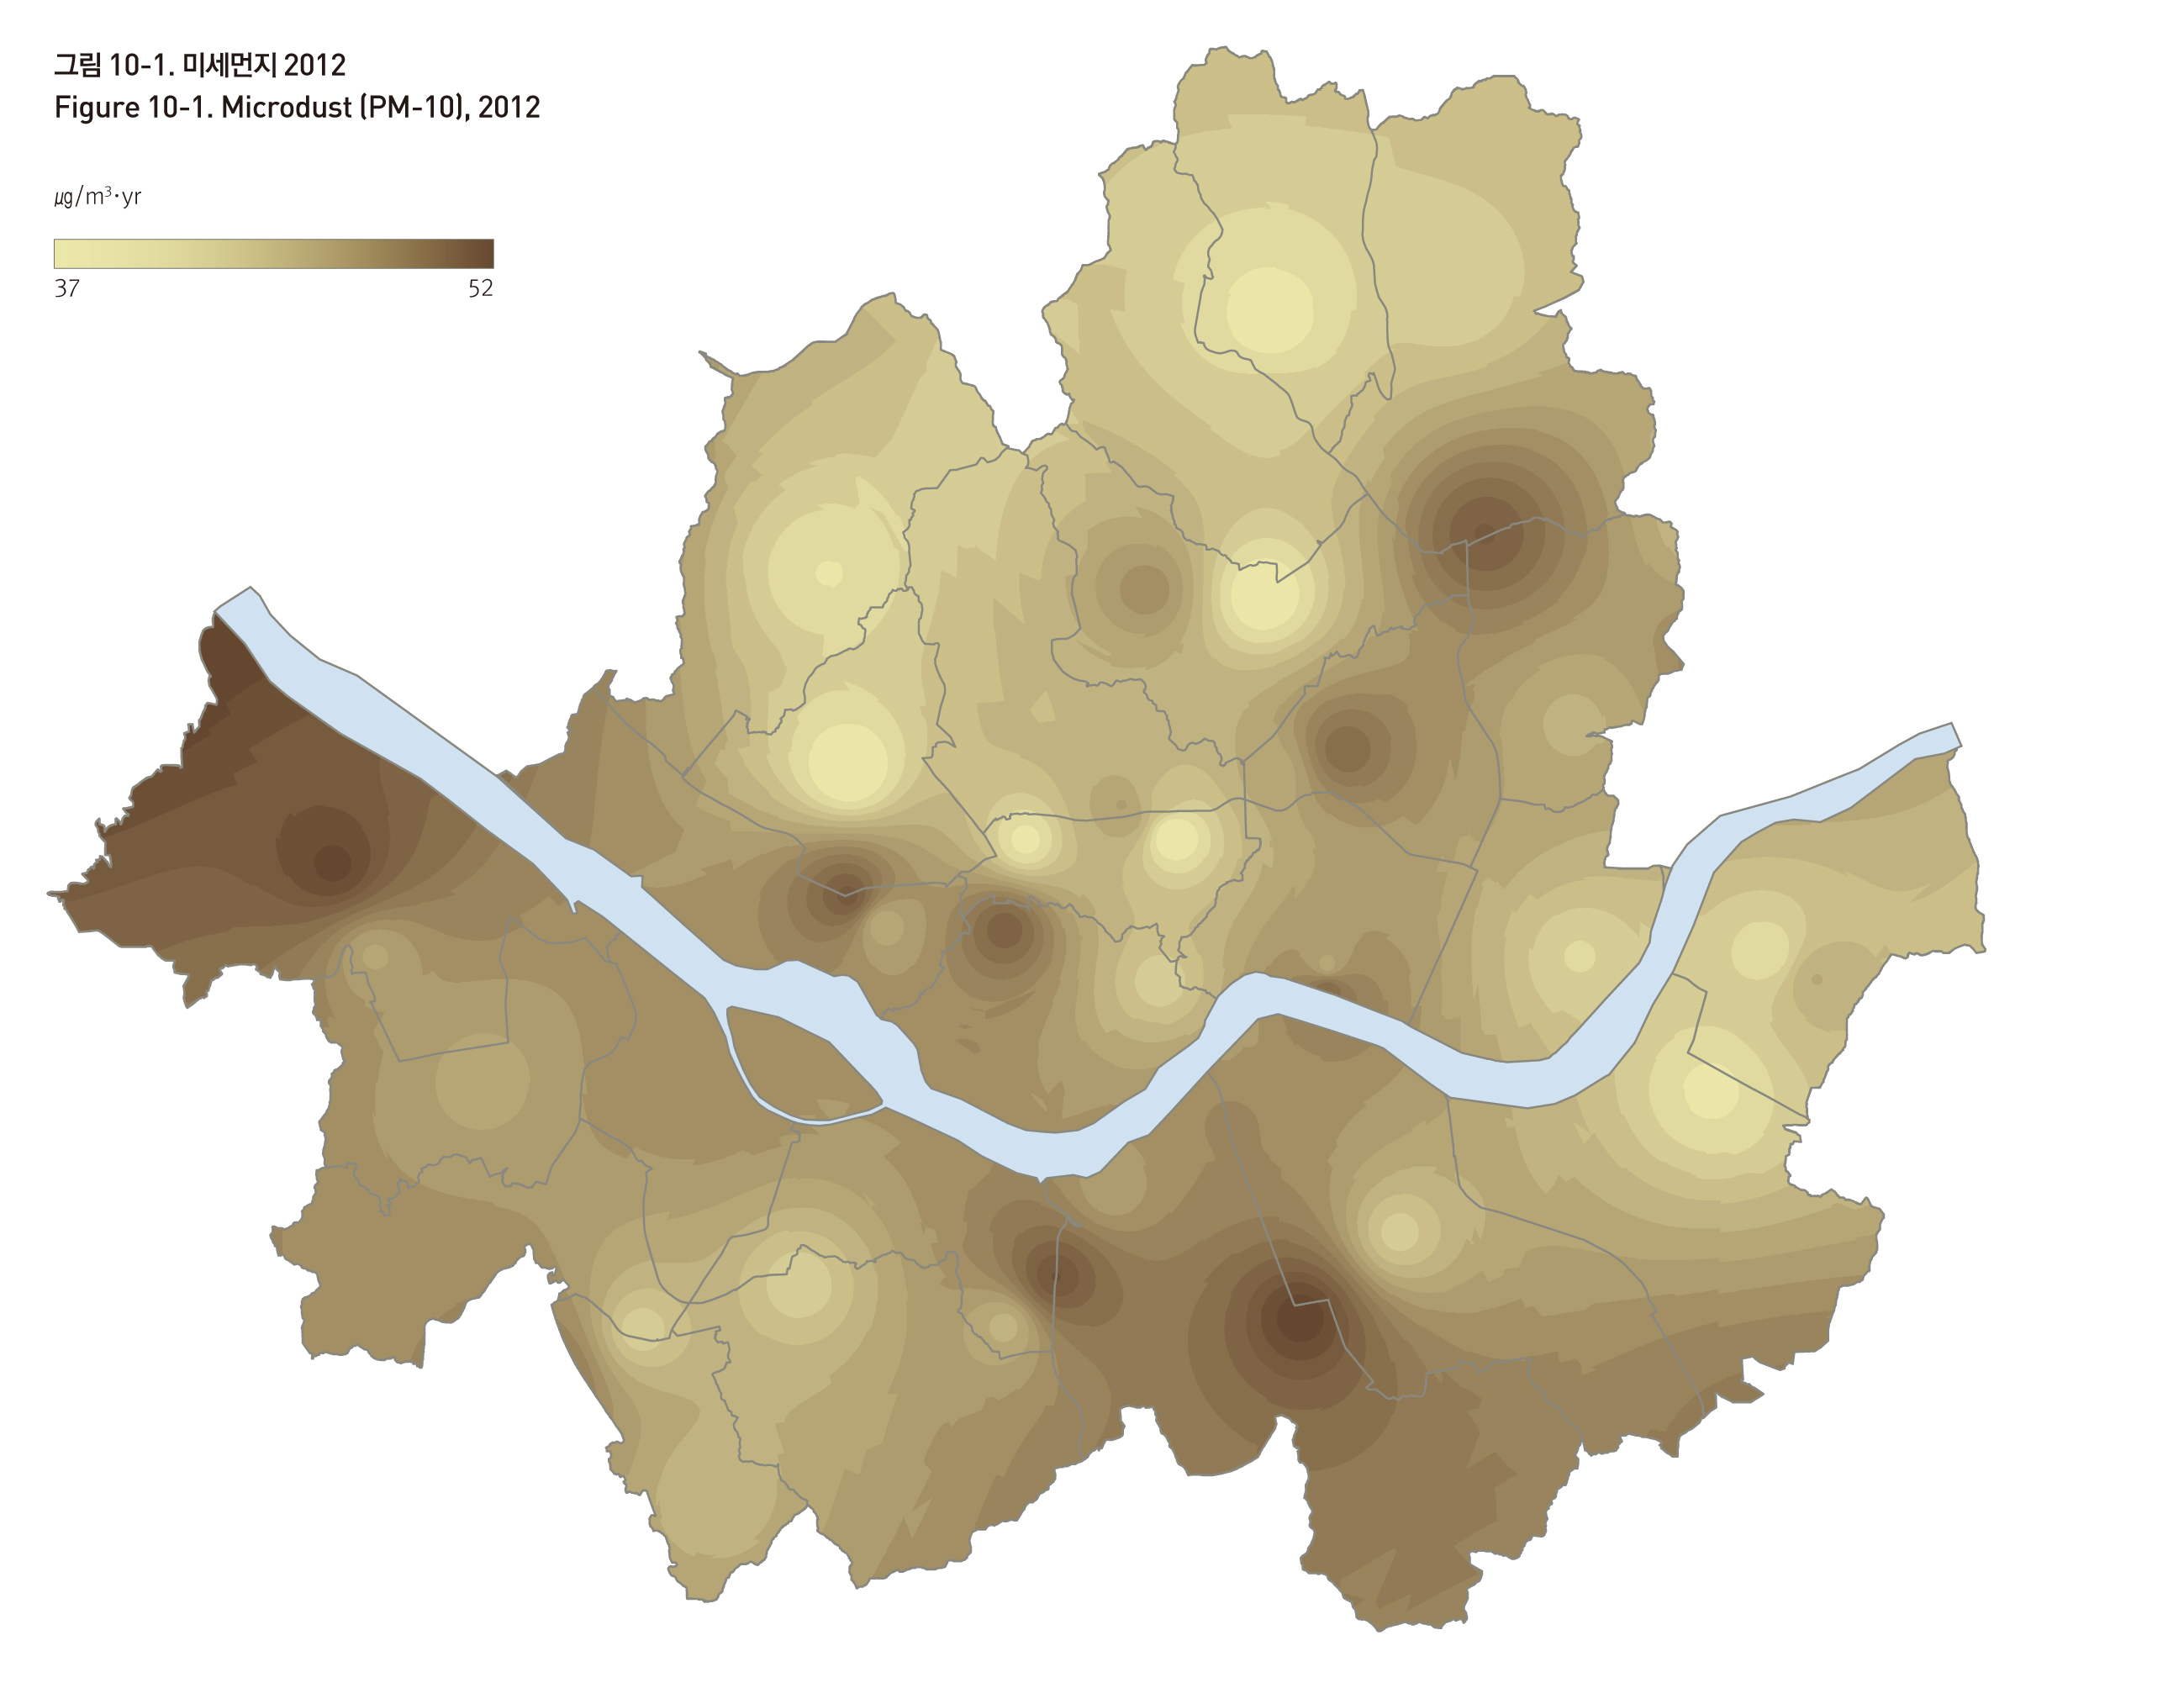
출처 : 환경부 국립환경과학원, 대기오염측정자료, 2012년
출처 : 환경부 국립환경과학원, 대기오염측정자료, 2012년
출처 : 환경부 국립환경과학원, 대기오염측정자료, 2012년
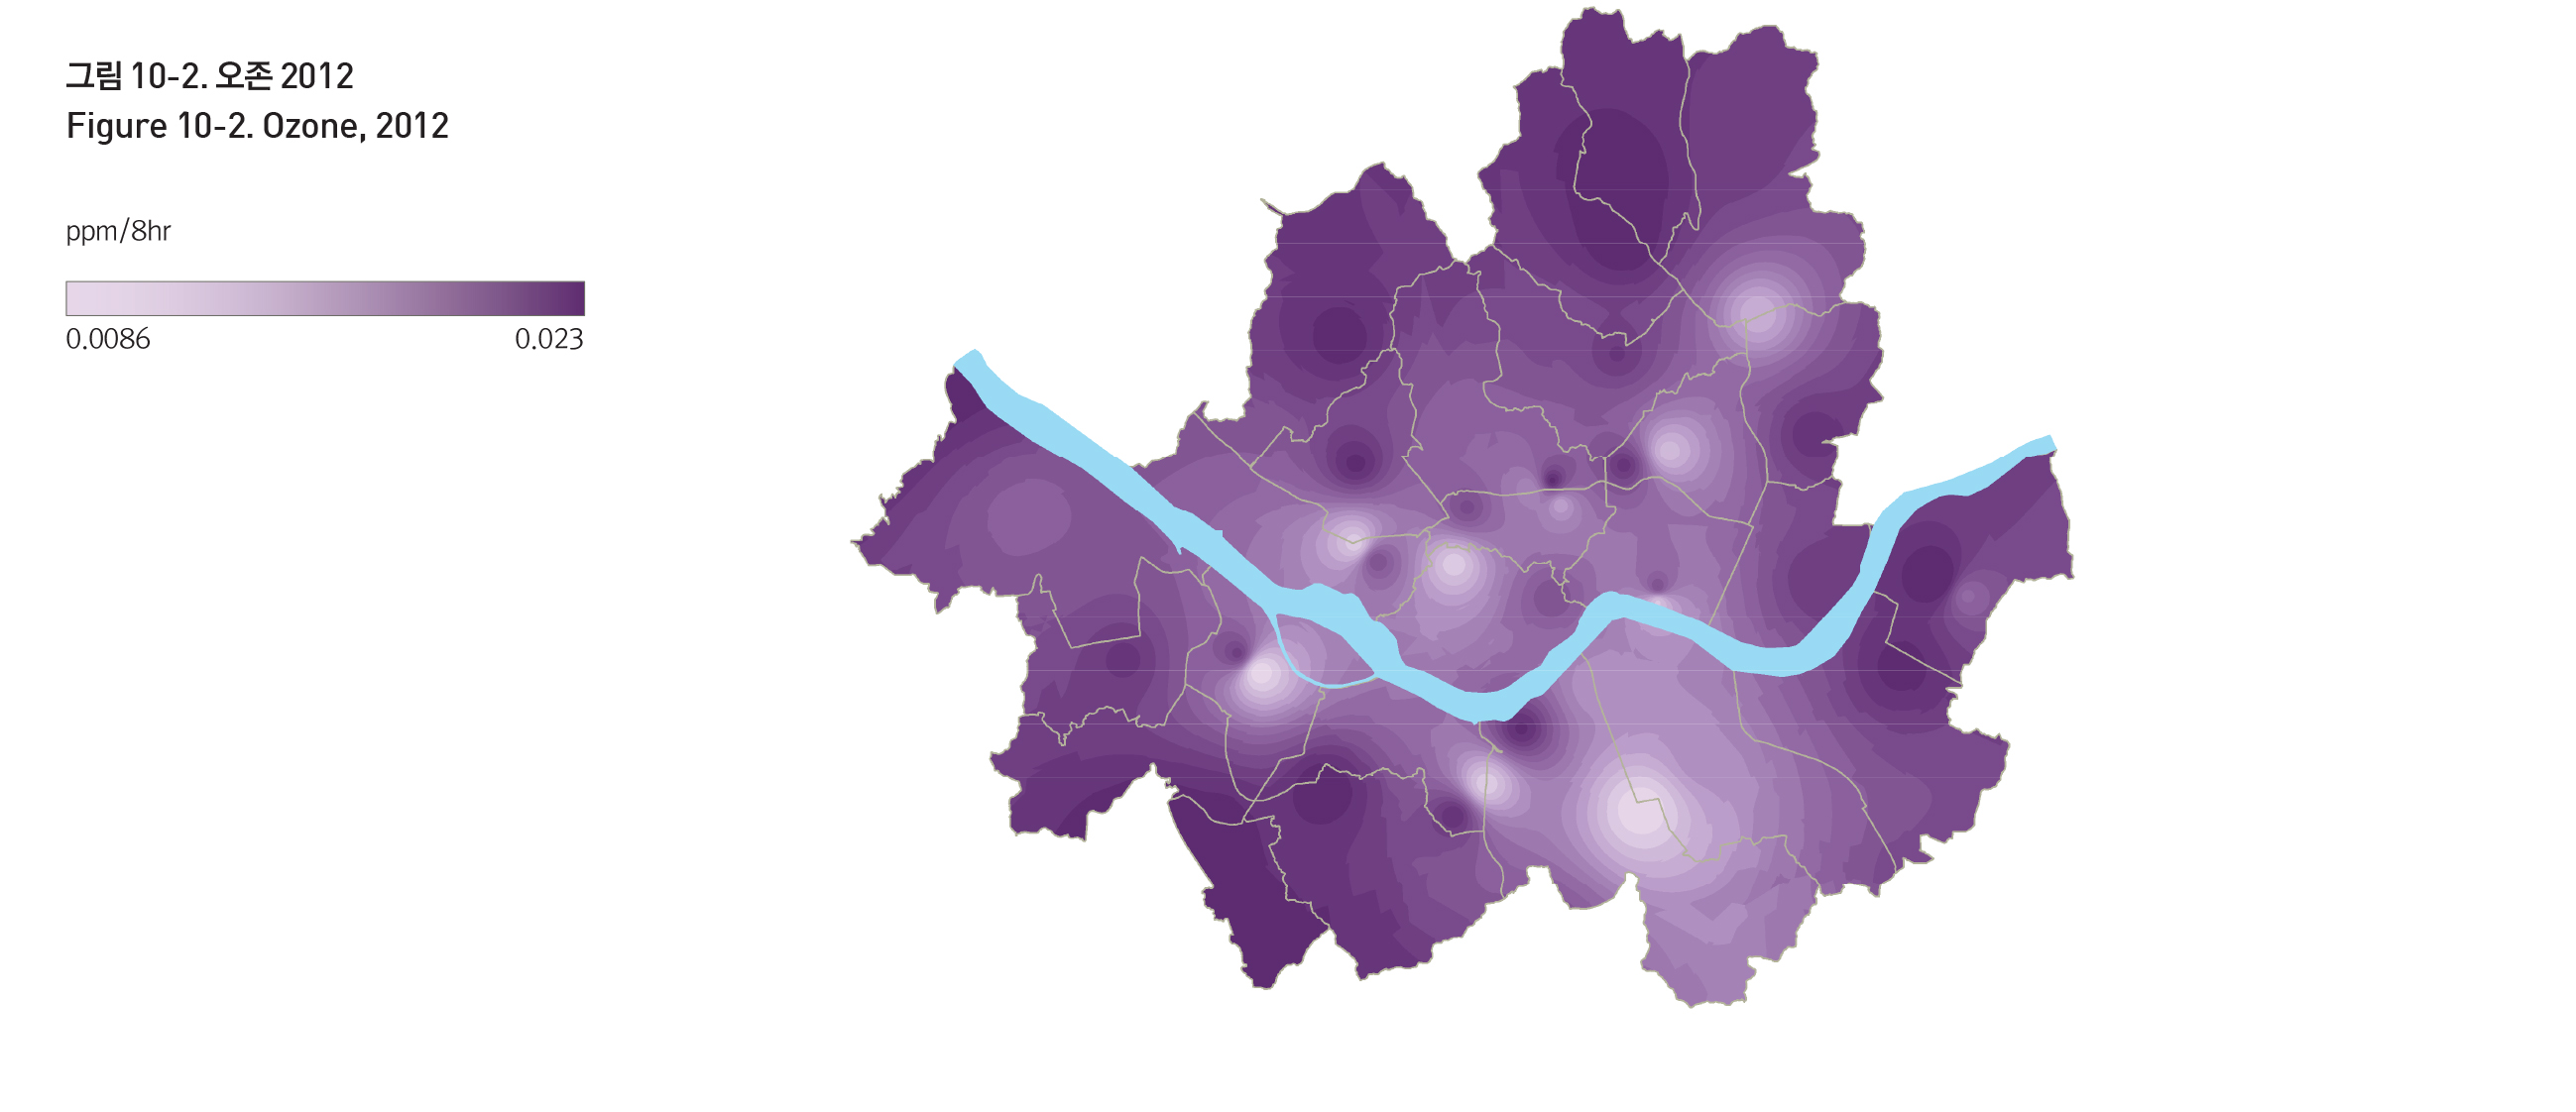
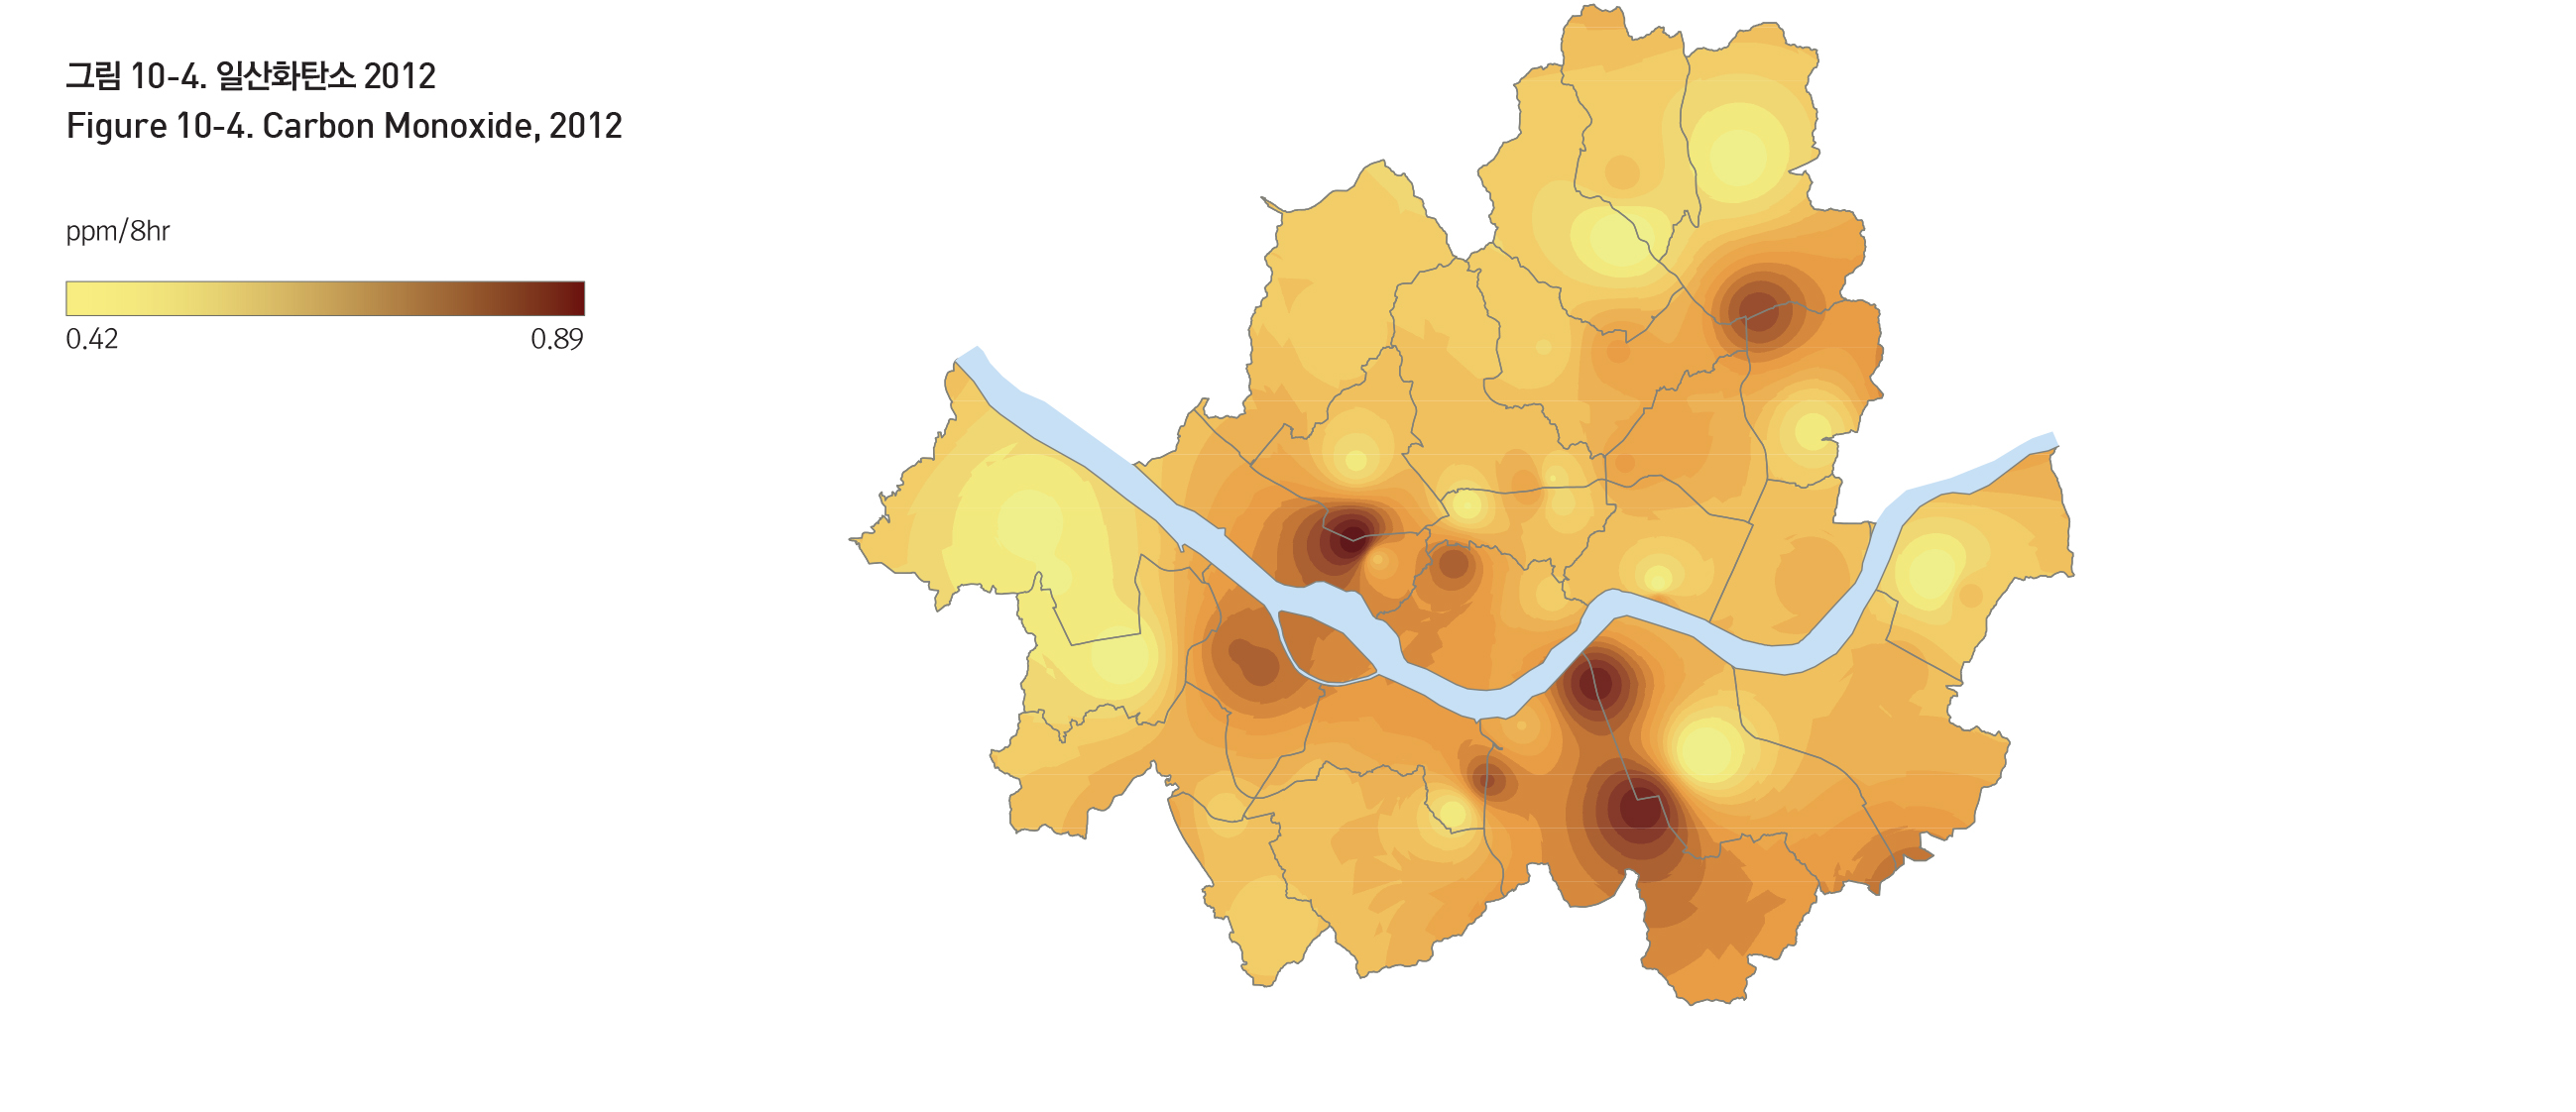
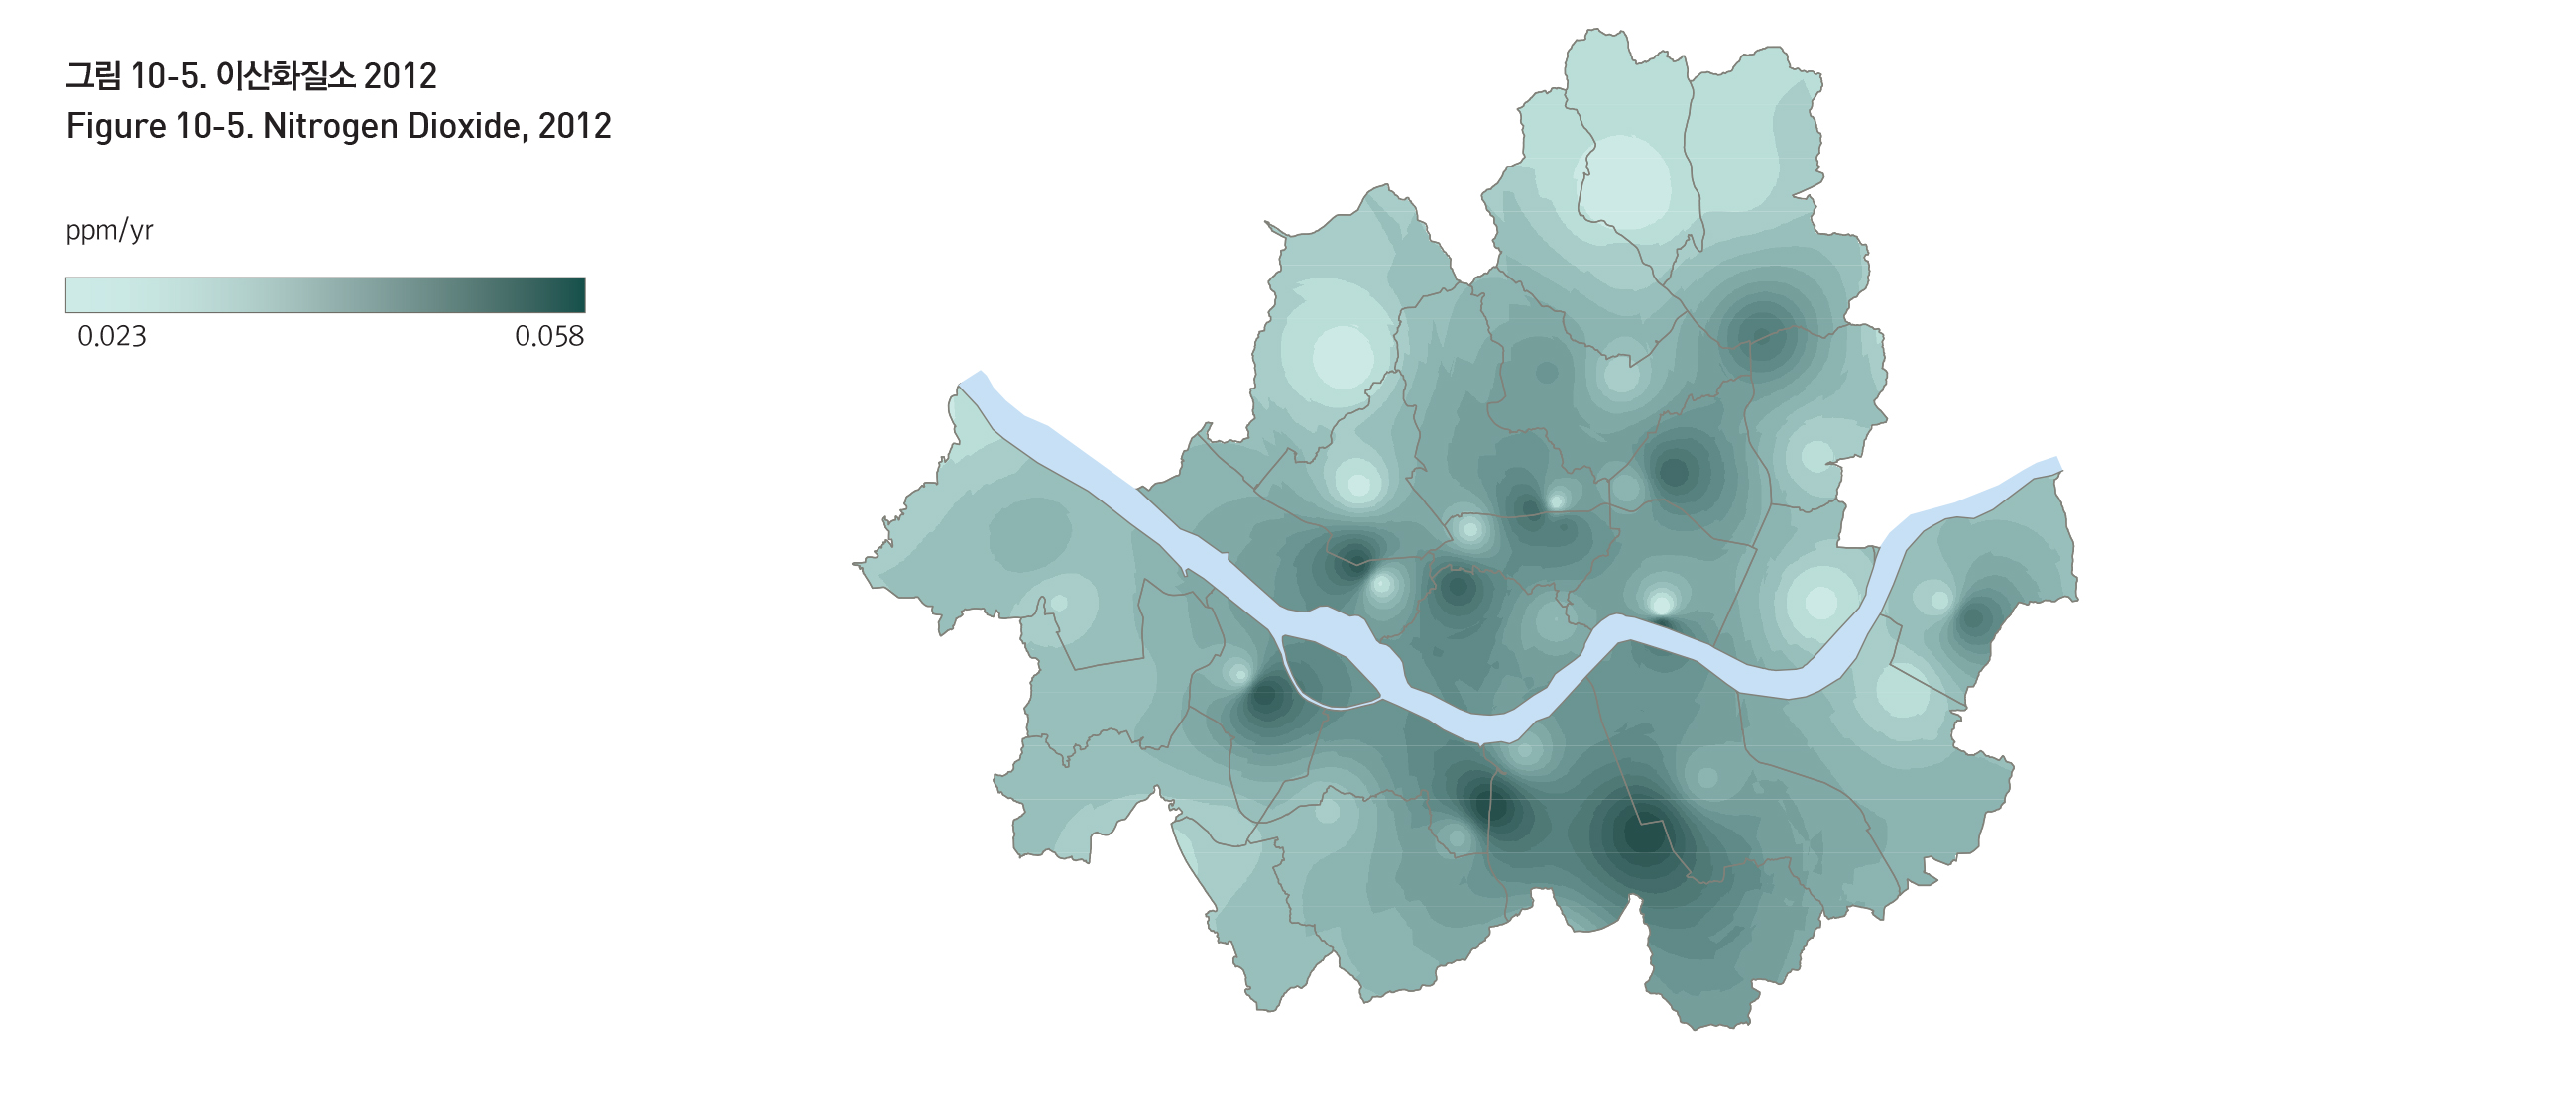
일산화탄소는 0.5ppm/8hr으로 서울시 기준 9ppm/8hr에 부합하고 있다. 이산화질소는 2006년까지는 서울시 연평균 기준치가 0.04ppm이었으며, 2006년까지는 이 기준치 이하의 양호한 상태였다. 하지만 2007년 이후 이산화질소의 기준치가 0.03ppm으로 낮아지면서 2006년 이후 기준치 이상의 농도를 보였으나, 점차 감소하여 2012년 현재 0.03ppm이다.
미세먼지와 아황산가스의 농도는 점차 낮아지고 있지만 이산화질소의 농도는 큰 변화가 없음을 알 수 있다. 이산화질소는 산성비의 원인이 되는 물질중의 하나로 자동차, 건설기계, 건물 난방 등으로 인해 발생된다. 서울시에서는 주요 발생 원인별 관리를 통해 대기 질을 개선하고 있다.
The current level of carbon monoxide in Seoul is 0.5ppm/8hr, well under the city regulation standards of 9ppm/8hr. Prior to 2006, when the city regulation standards for nitrogen dioxide were 0.04ppm, nitrogen dioxide were also well under these levels.
When the standards were raised to 0.03ppm in 2006, the nitrogen dioxide concentration in Seoul remained above these standards, before scaling down at 0.03ppm as of 2012.
These figures show that while the concentration of PM-10 and SO2 is gradually decreasing, the level of nitrogen dioxide has not improved significantly. Seoul aims to reduce these pollutants and improve air quality by regulating their major causes.
출처 : 환경부 국립환경과학원, 대기오염측정자료, 2012년
출처 : 환경부 국립환경과학원, 대기오염측정자료, 2012년

출처 : 환경부 국립환경과학원, 대기오염측정자료, 2012년
출처 : 환경부 국립환경과학원, 대기오염측정자료, 2012년