-
주택
주택 수
-
주택 수
서울시의 주택은 1980년대 후반과 1990년대 초반, 2000년대 초반에 대규모로 공급되었다. 1990년대 초반에는 정부의 주택 200만 호 건설계획에 따라 거의 매년 10만 호 이상의 주택이 공급되었다. 이후 외환위기로 주택건설이 주춤하다가 2000년대 초반 주택건설 수요가 늘고, 1970~80년대 아파트들이 재개발, 재건축을 하면서 주택 공급량이 증가하였다. 2008년에는 세계적인 금융위기로 인해 수요가 감소하였지만 2011년 현재 주택건설 실적이 9만 호 수준으로 증가하였는데, 이는 소형주택 건설과 다세대주택의 건설이 증가하여 나타나는 현상으로 보인다.
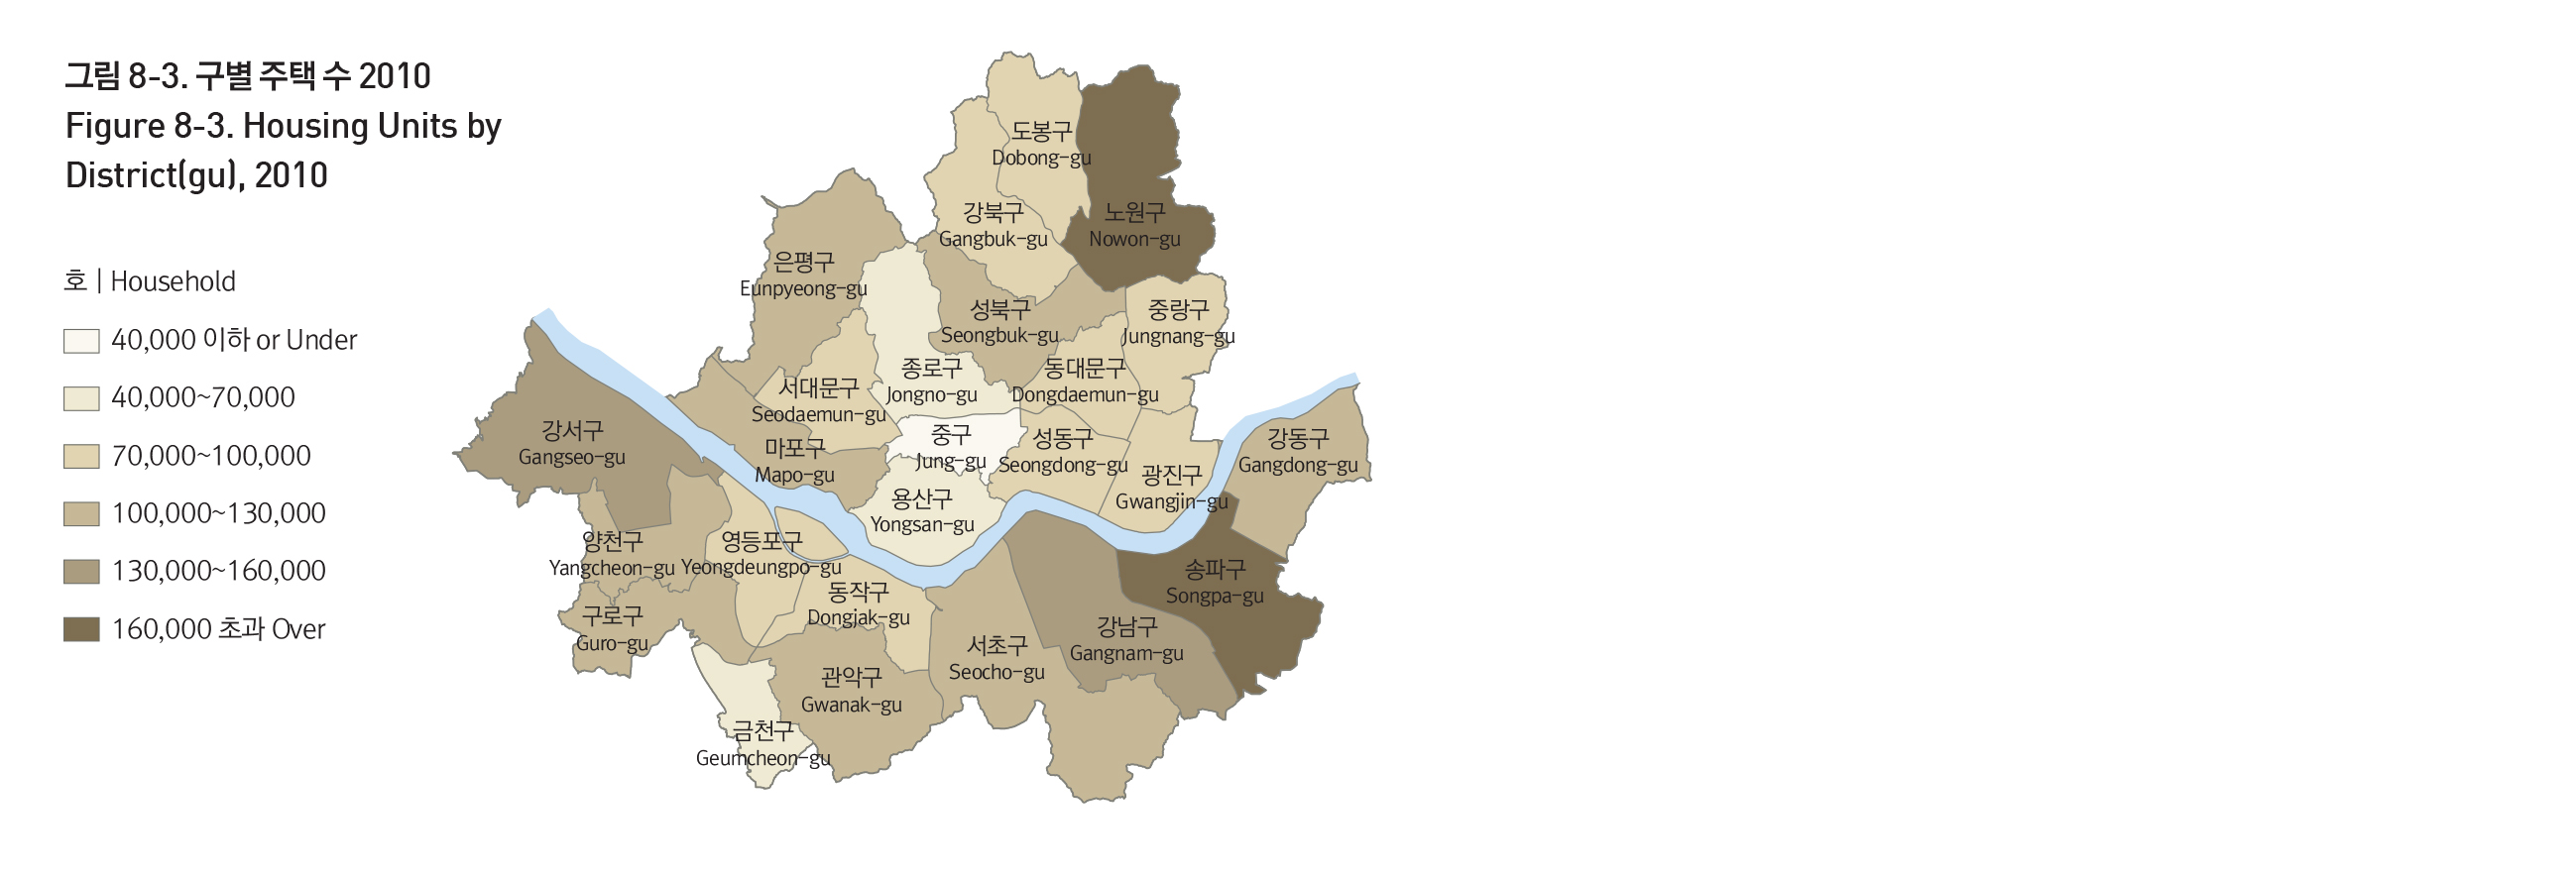
공간적으로 보면, 노원구, 송파구, 강서구, 강남구에 가장 많은 주택이 위치해 있다. 동별로 보면 노원구 중계2·3동, 은평구 진관동, 노원구 상계6·7동, 강서구 등촌3동 순으로 주택이 많이 위치해 있다.
HOUSING
Housing in Seoul was supplied on a massive scale during the late 1980s, early 1990s, and early 2000s. During the early 1990s, more than 100,000 housing units were supplied each year, before it all came to a halt during the IMF crisis. The early 2000s saw another influx of housing supply when pre-IMF plans resumed and older apartments began to be redeveloped. Supply again withdrew during the global financial crisis of 2008, but has picked up since then to 90,000 houses in 2011, due to the increased development of smaller houses and multiplexes.
Nowon-gu, Songpa-gu, and Gangseo-gu are districts with the largest housing supply, while Junggye2/3-dong, Jingwan-dong, and Sanggye6/7-dong are the neighborhoods with the largest housing supply.
출처 : 통계청, 인구주택총조사, 2010년
출처 : 서울특별시, 서울통계
국토해양부, 국토해양통계누리


