-
교통
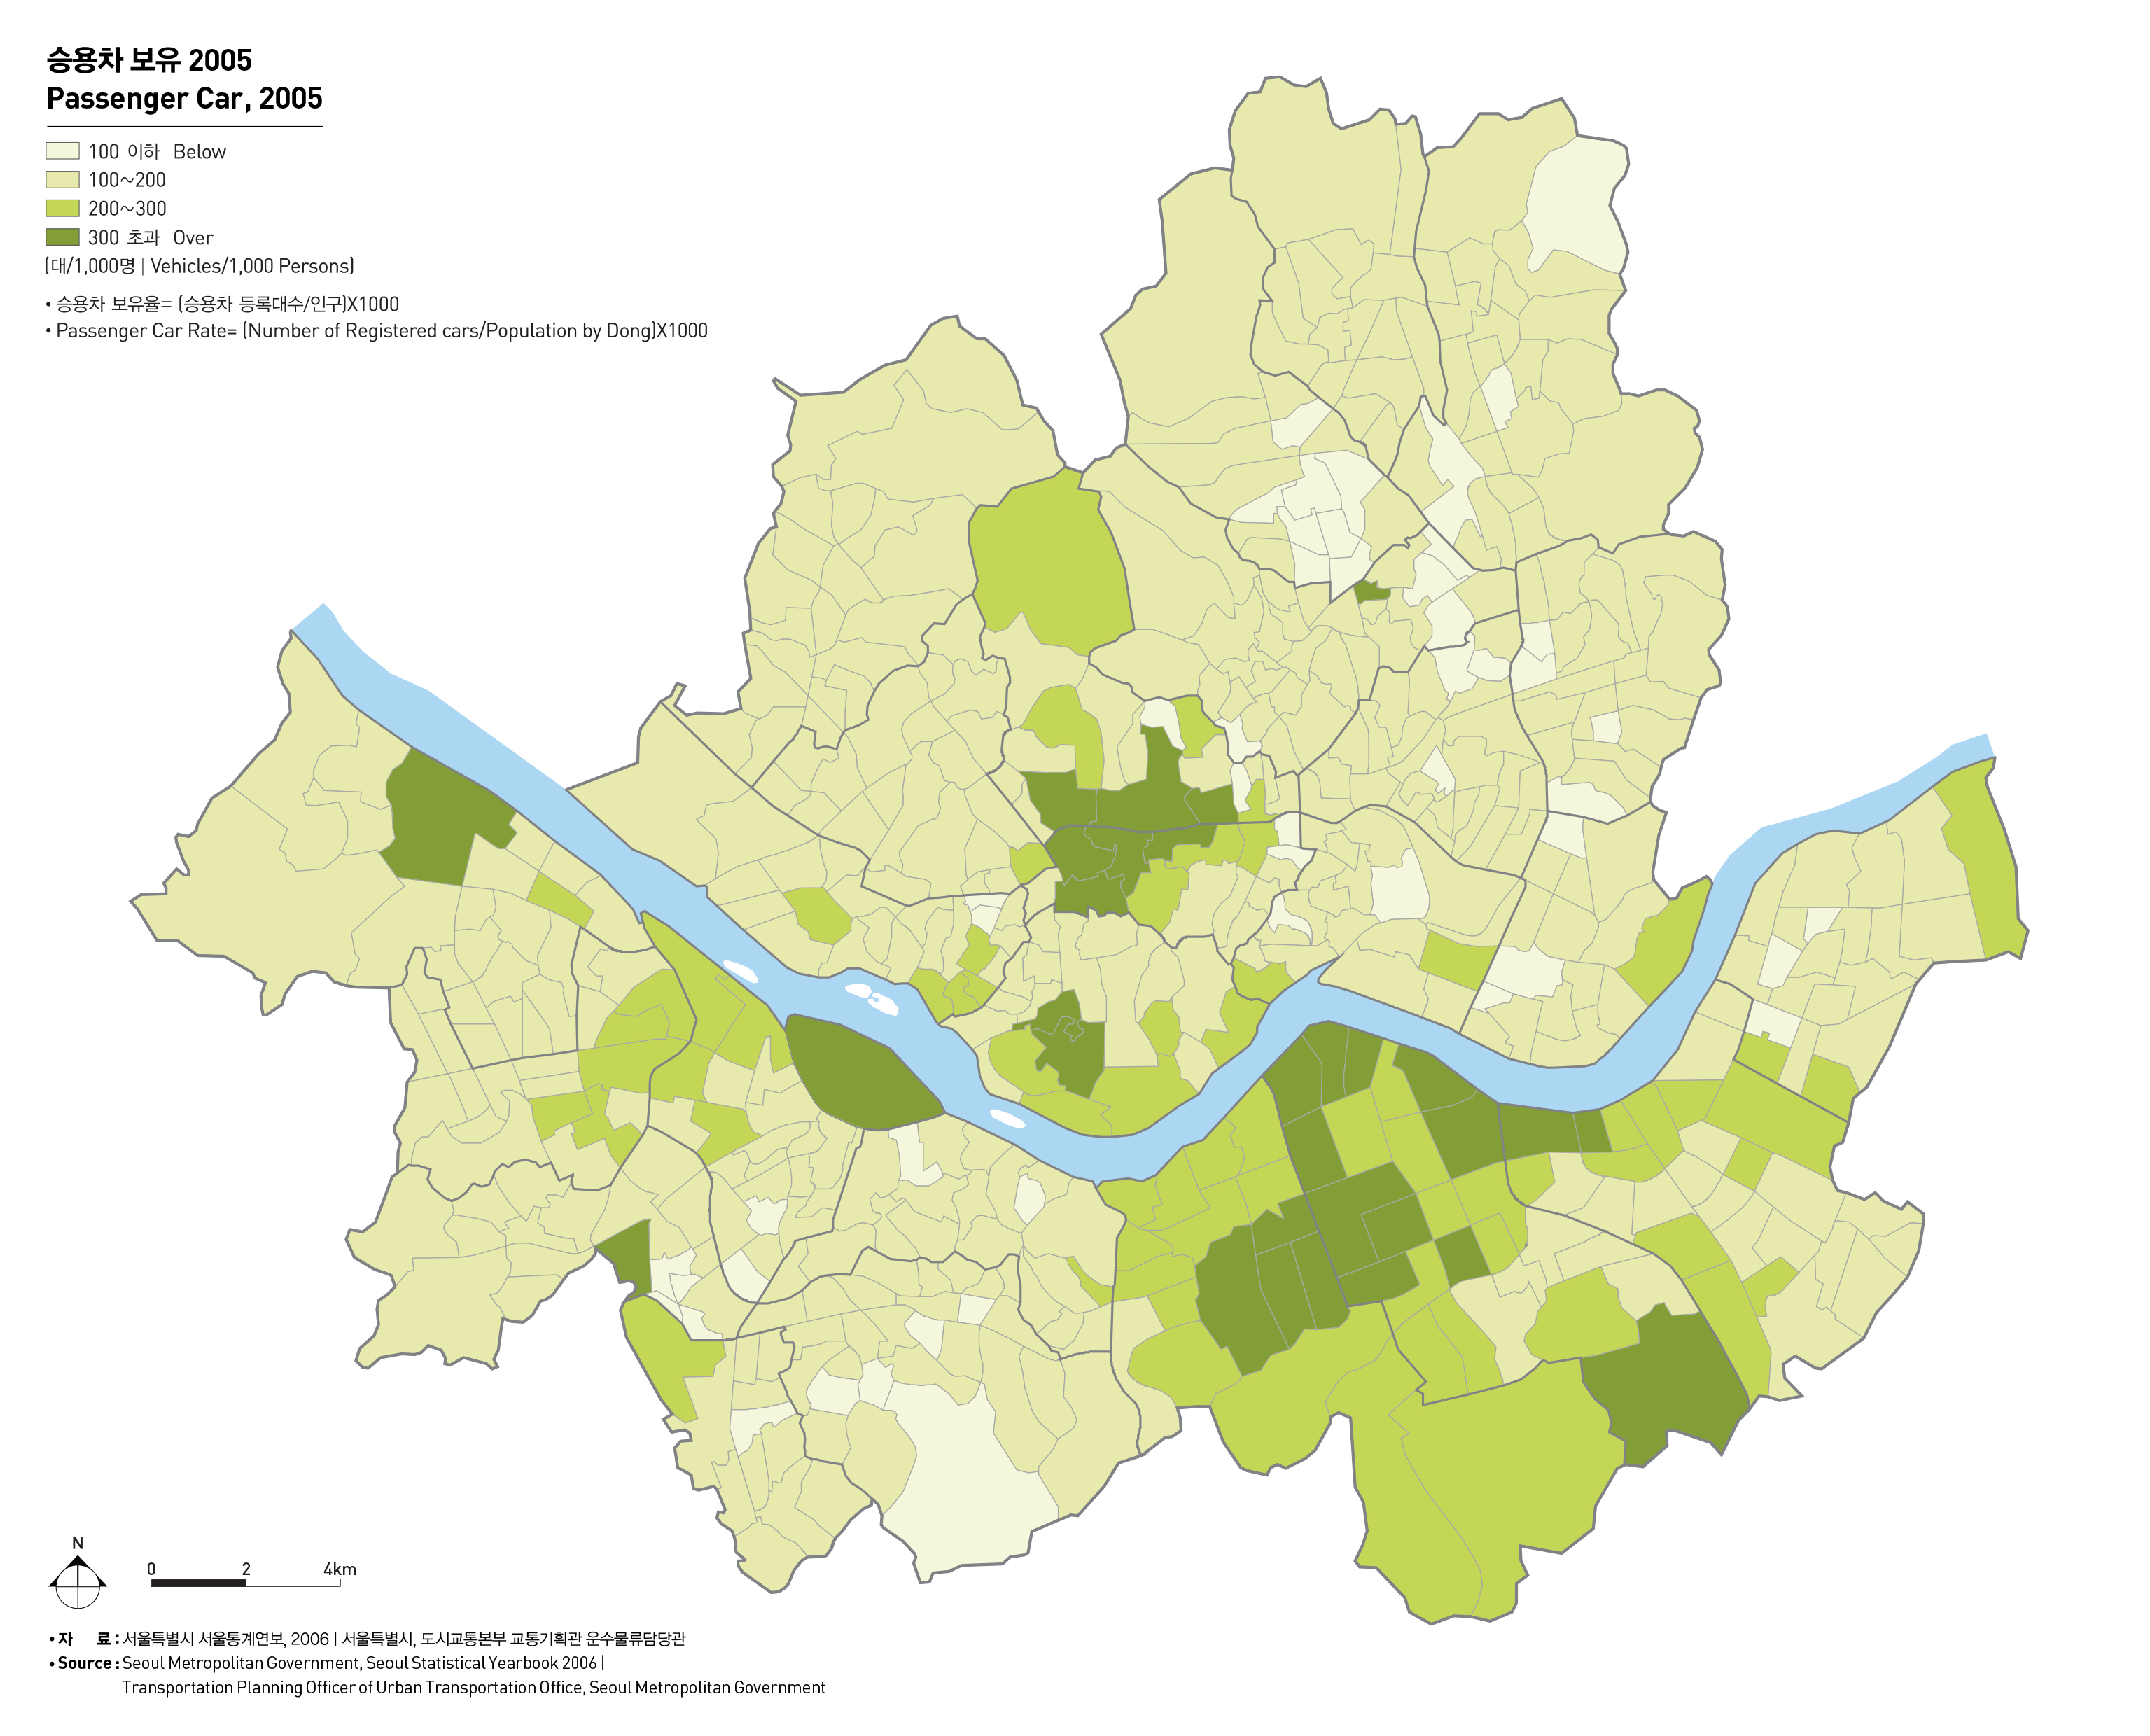
승용차보유
-
승용차 보유
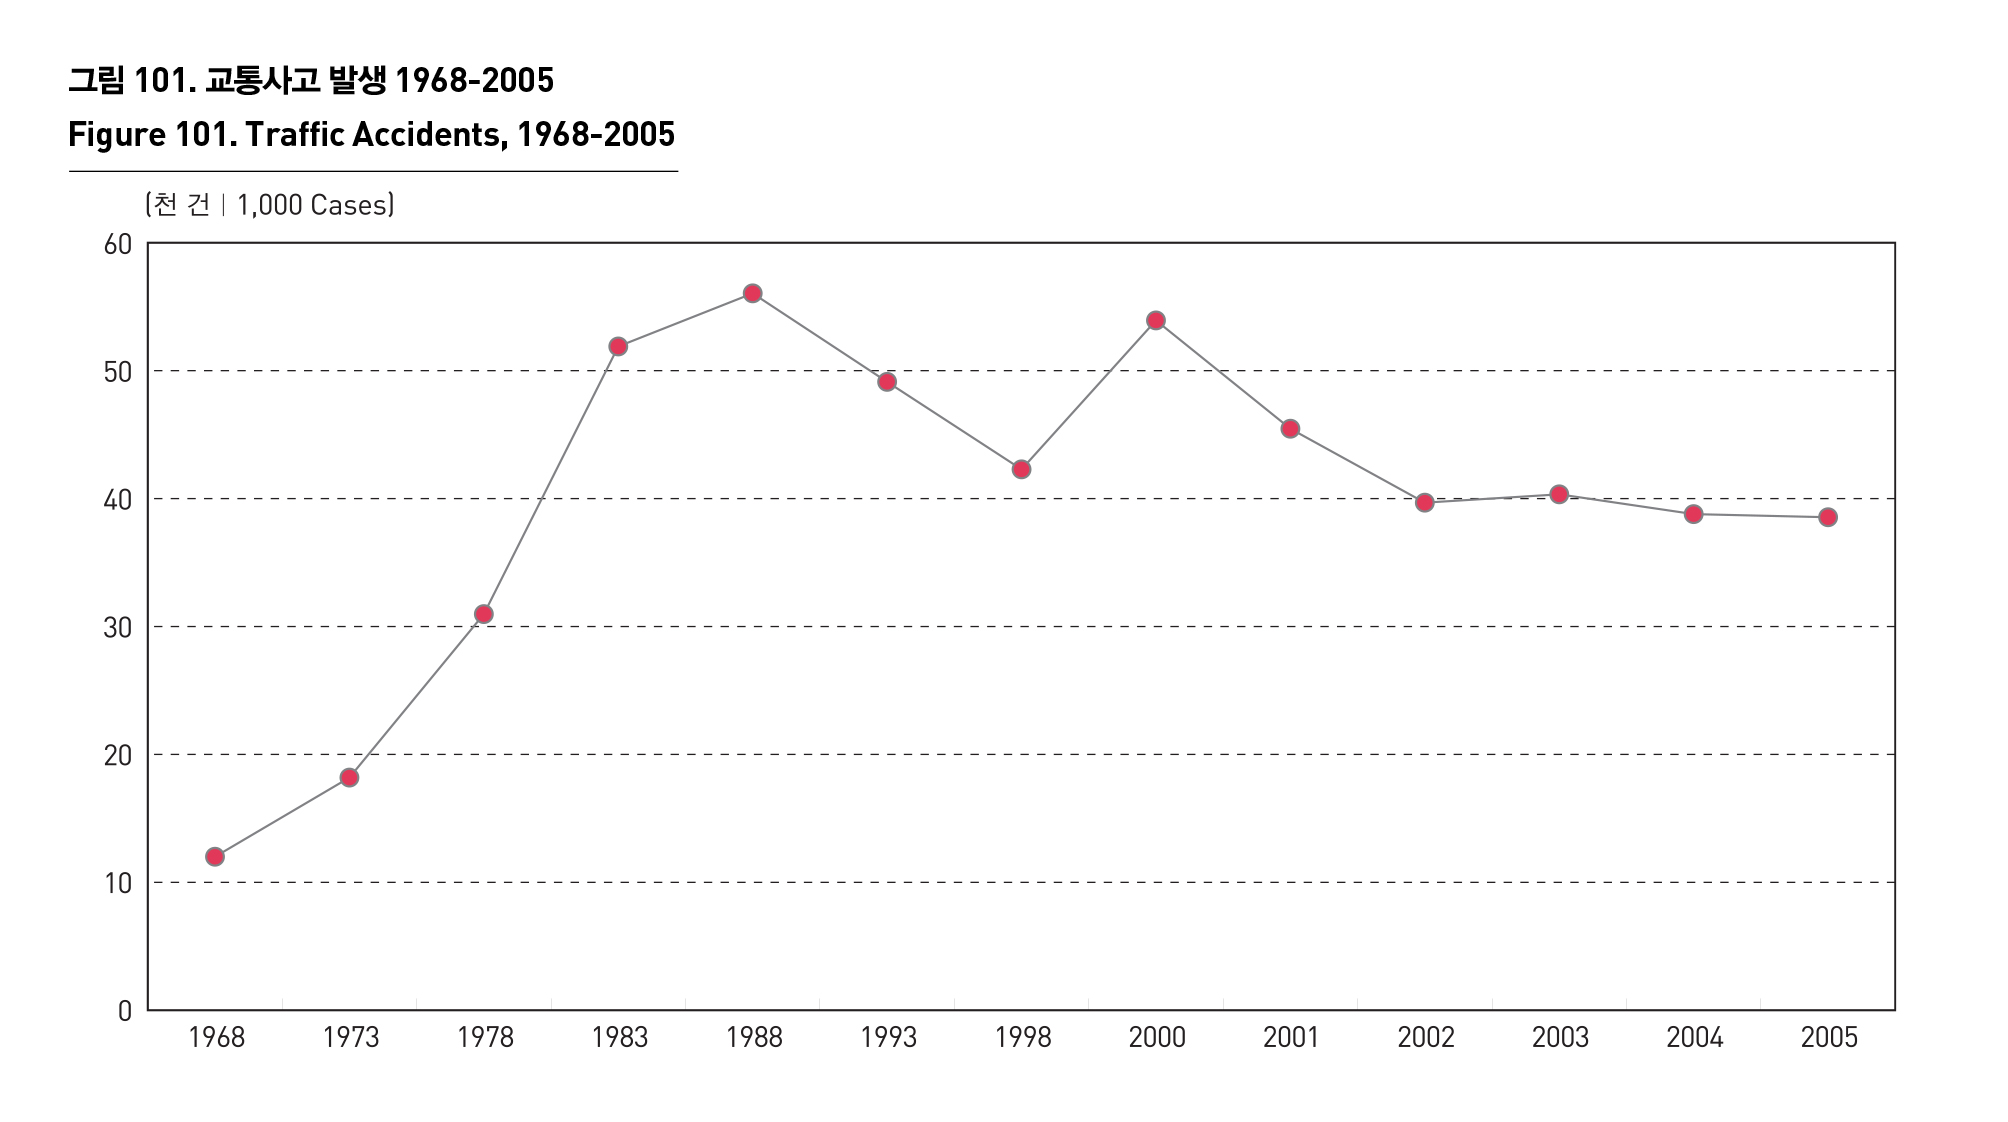
서울의 교통사고는 1970년대 이후 경제성장에 의한 차량의 증가와 더불어 급격하게 증가하다 교통안전대책이 강조되던 2000년 초 이후 점차 개선되어 가고 있는 것으로 파악되고 있다. 천 건당 발생수를 보면 1988년 56천건으로 최고치를 기록한 후 2000년 54천건에서 2005년 현재까지 39천건으로 점차 낮아지는 추세에 있다.
서울의 자동차 등록대수는 2005년 현재 281만대를 넘어서고 있다. 이 가운데 승용차가 79%, 승합차(버스)가 7%, 기타 화물차와 특수차가 14%에 달한다. 승용차 가운데는 자가용이 95%이며, 기타영업용과 관용 승용차가 있다.
인구 1,000명당 승용차 보유대수를 살펴보면 강남 지역이 강북지역보다 높은 것으로 나타나며, 행정시설과 상업시설이 밀집한 종로구와 중구 일부지역과 소득이 높은 서초구, 강남구, 송파구와 영등포구, 용산구, 구로구, 강서구 일부 등에서 승용차 보유 대수가 높은 것으로 나타났다.
PASSENGER CAR
Traffic accidents in Seoul rapidly rose, as economic development in 1970s led to an increase in vehicles. But the accidents began to drop in 2000, when transportation safety measures were emphasized. The number of traffic accidents peaked at 56,000 in 1988, and then gradually dwindled from 54,000 in 2000 to 39,000 in 2005.
More than 2.81 million cars were registered in Seoul as of 2005. The registered cars are made up of passenger cars(79%), buses(7%), and trucks and special vehicles(14%). Passenger cars are composed of 95% of private cars and other business and official vehicles.
There are more passenger cars per 1,000 people in the South of Han river than in the North of Han river. The passenger car rate is high in Jongno-gu and Jung-gu with many administrative or commercial facilities, in high-income regions such as Seocho-gu, Gangnam-gu and Songpa-gu, as well as in Yeongdeungpo-gu(including Yeouido), Yongsangu, Guro-gu and Gangseo-gu.
출처 : 서울특별시 서울통계연보, 2006
서울특별시, 도시교통본부 교통기획관 운수물류담당관