-
교통
교통수단
-
교통수단
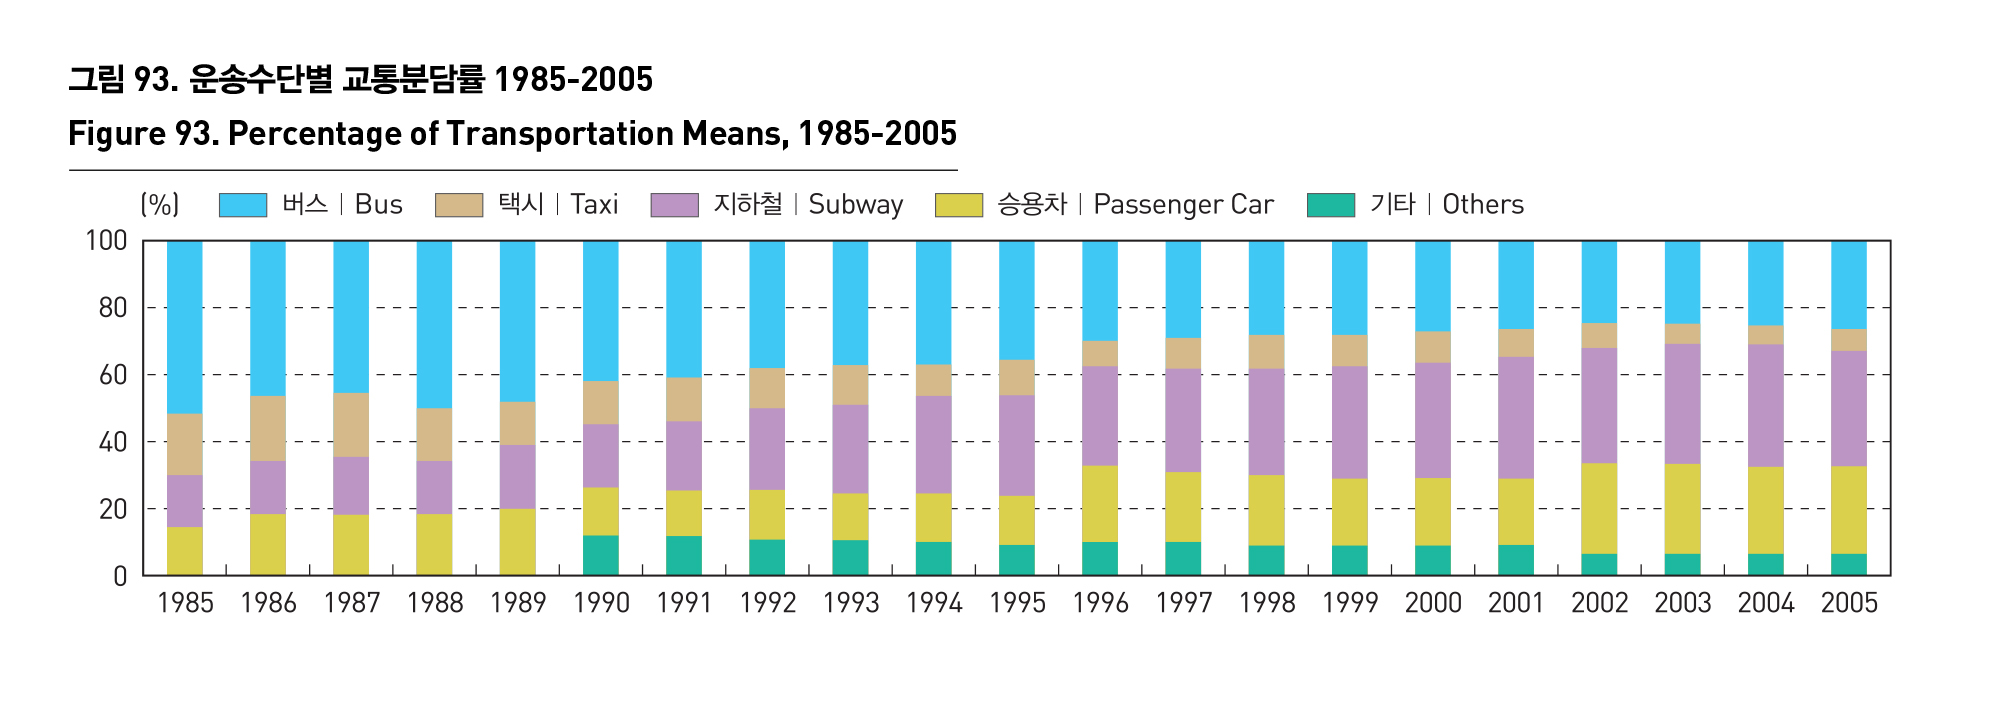
서울의 운송수단별 교통분담률은 2005년 지하철 34.8%, 버스 27.5%, 택시 6.5%, 기타 4.9%를 차지하고 있다. 2004년 7월 대중교통체계개편 이후로 그동안 택시와 함께 감소해왔던 버스의 분담률이 증가추세로 돌아섰으며, 지하철과 승용차는 지속적으로 증가하고 있다.
서울의 지하철은 1974년부터 1985년까지 1기 지하철이 완성되었고, 1987년부터 2000년까지 2기 지하철이 완공되었으며, 현재 지하철 9호선의 건설이 추진되고 있다. 1∼8호선의 지하철 수송인원은 일평균 약 623만명 수준이며 환상선인 2호선이 연간 699,222천명으로 가장 많고, 4호선, 5호선, 7호선이 연간 약 300,000천명 수준으로 그 뒤를 잇고 있다(2006년 기준).
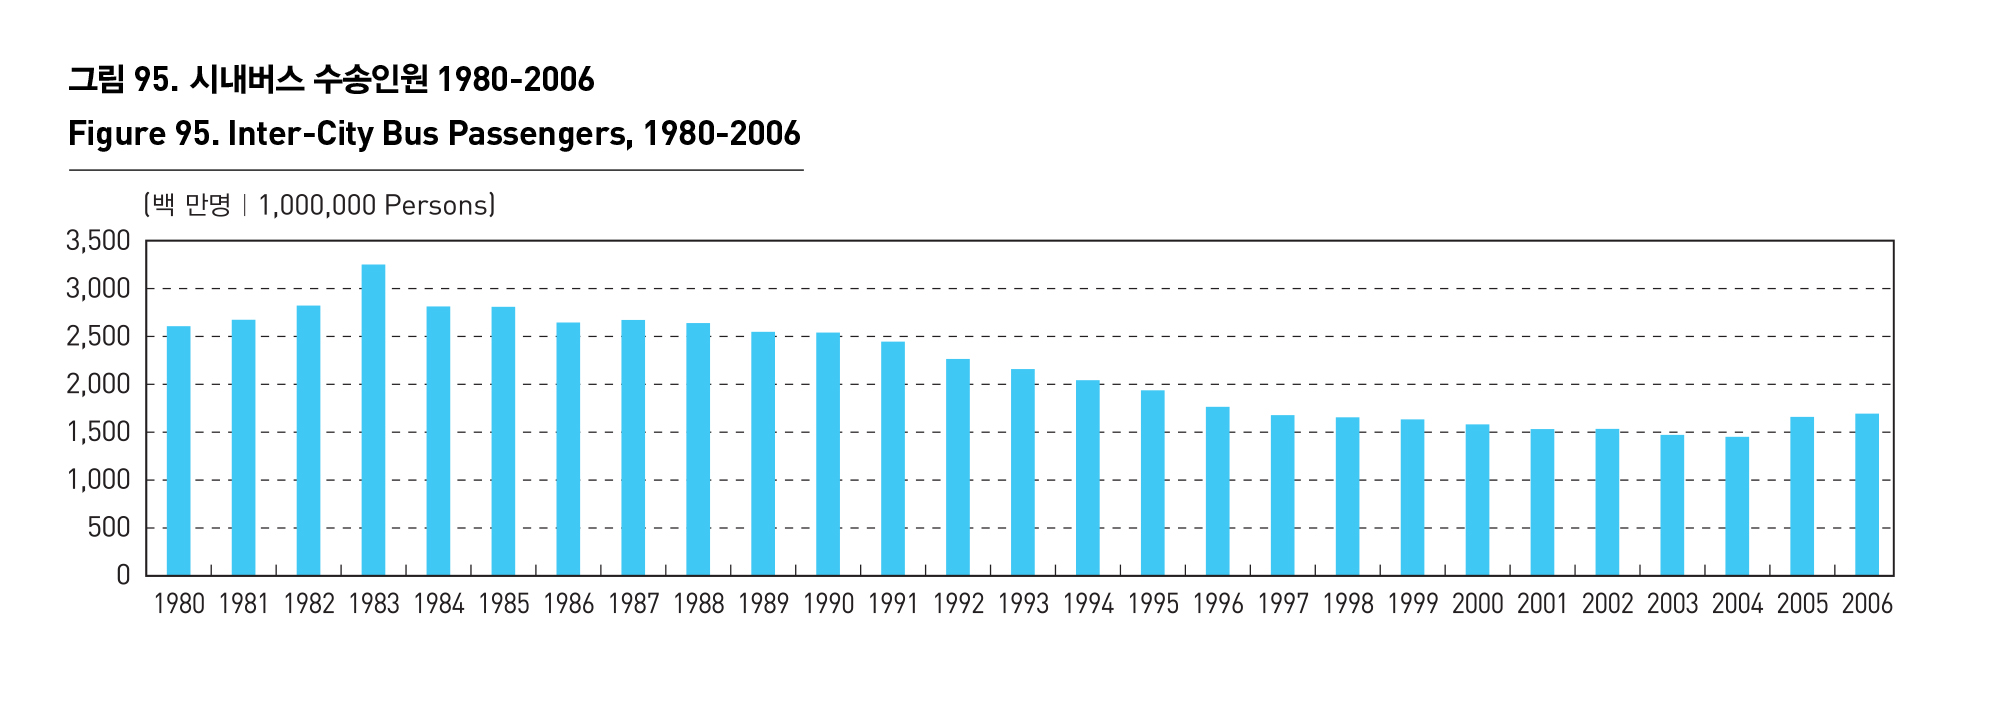
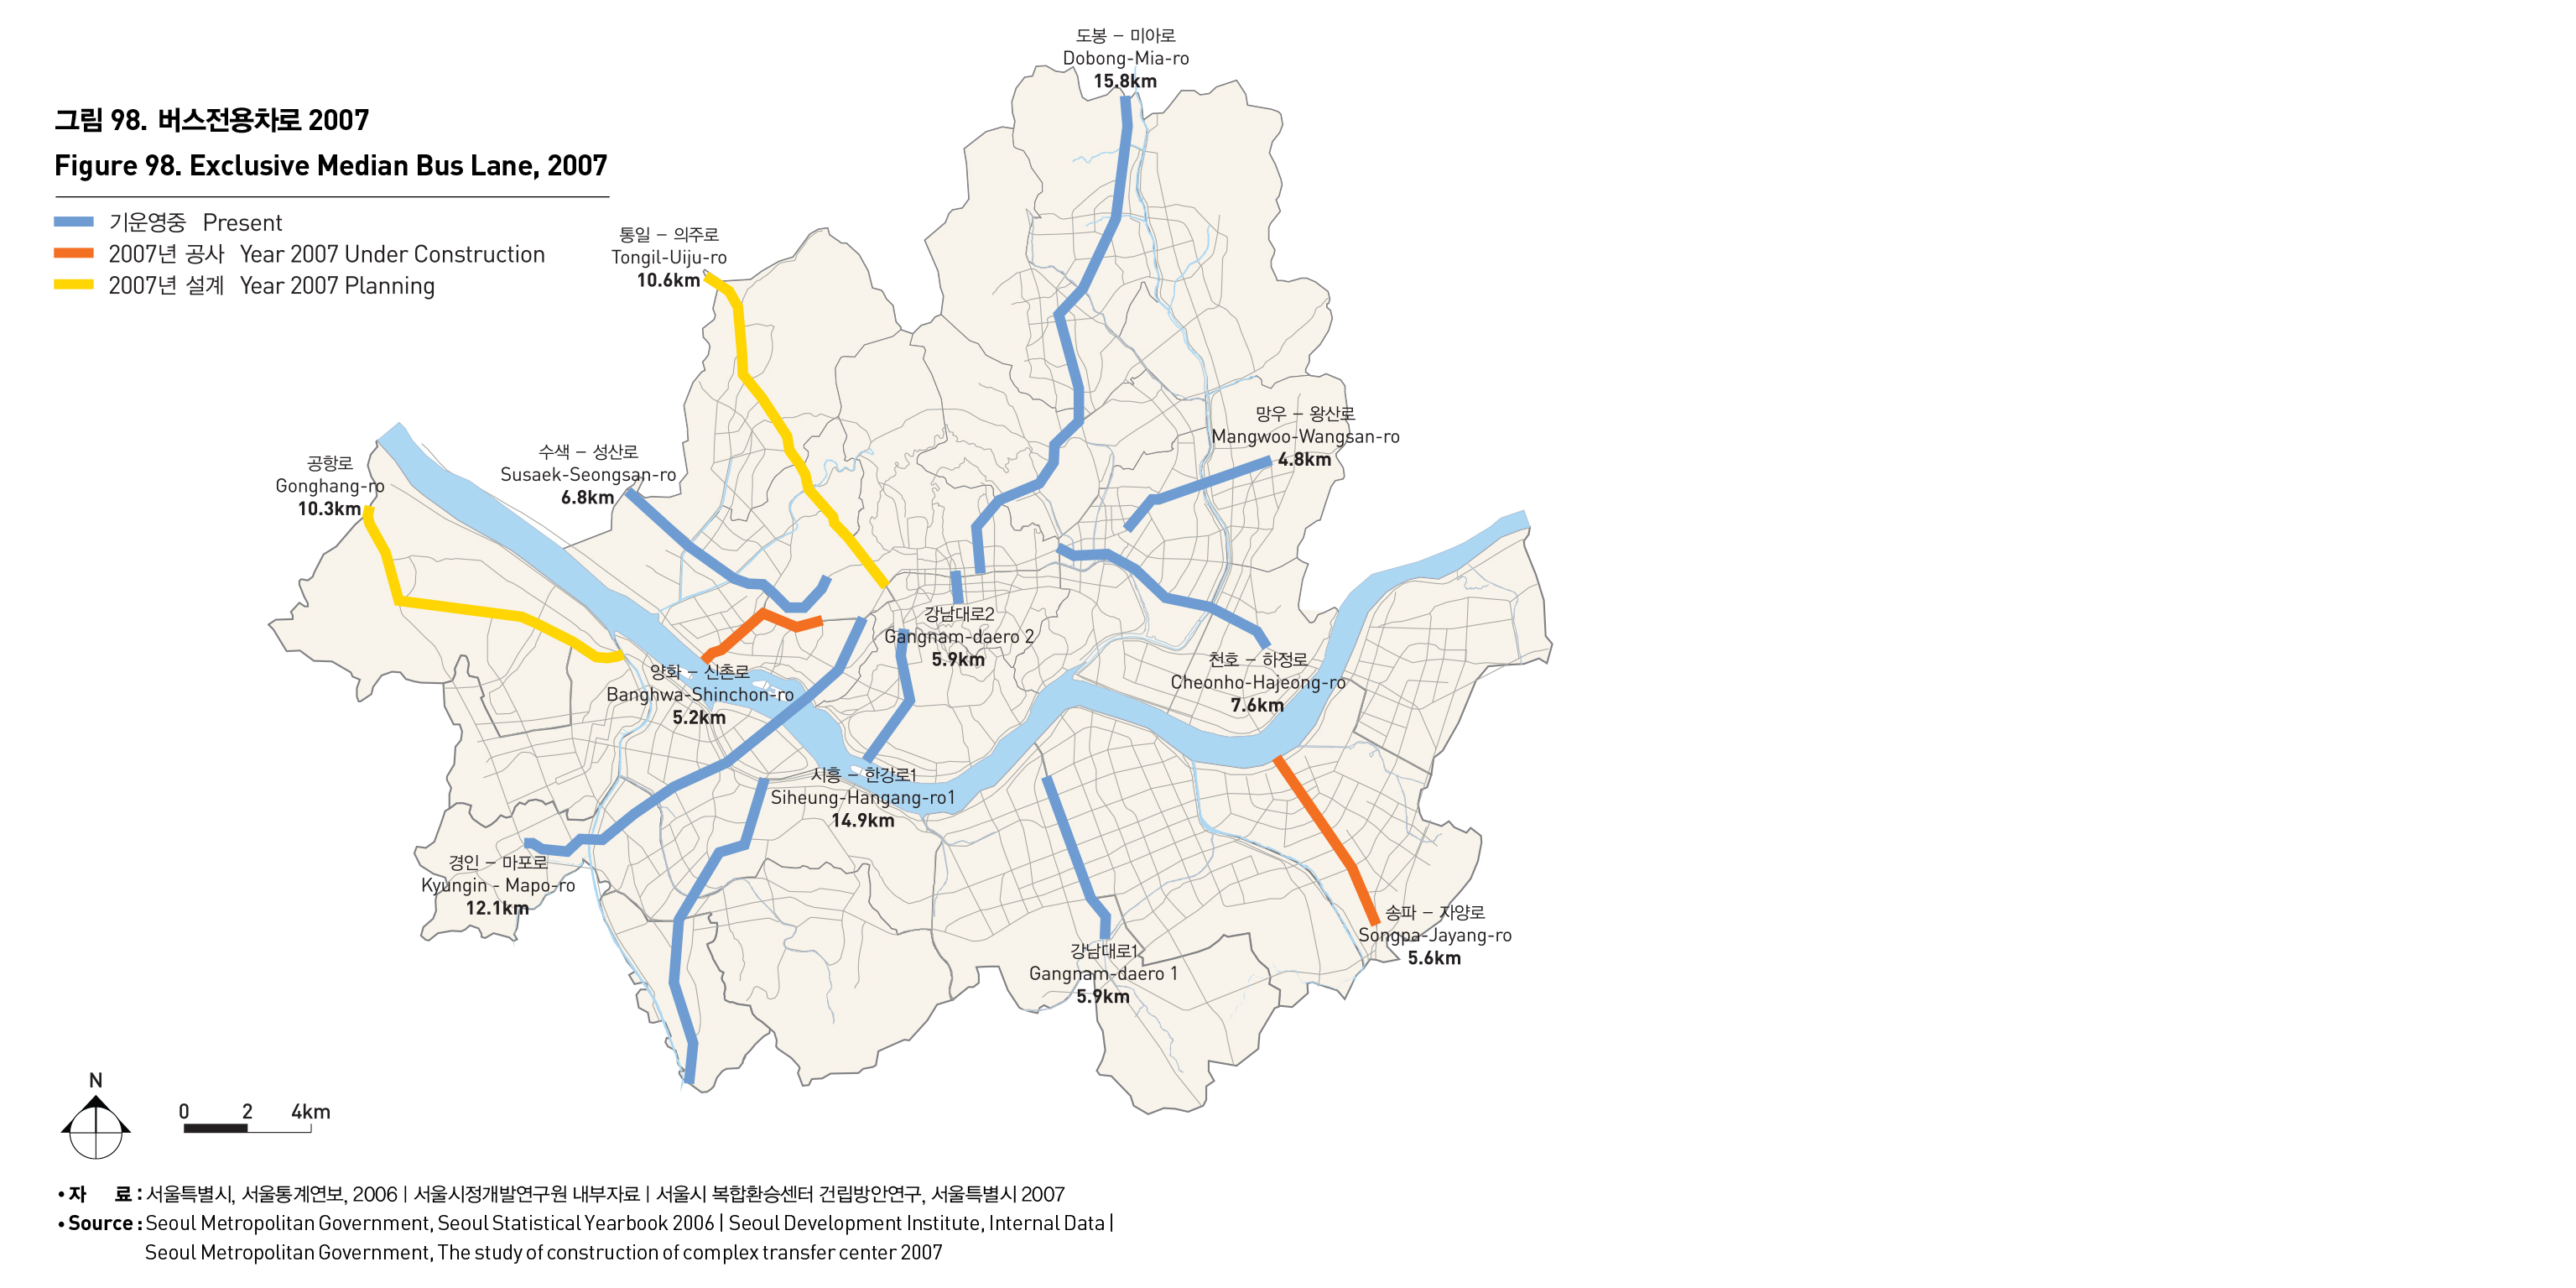
시내버스 수송인원은 1983년 324,190만명을 정점으로 2004년 145,700만명까지 감소하였으나, 대중교통체계개편 이후인 2005년부터 증가하기 시작하여 2006년 기준 169,930만명을 차지하고 있다. 중앙버스전용차로는 2004년 7월 강남-양재구간 5.9Km로 시작되어 현재 7개구간 67.9Km가 운영되고 있으며, 향후 11개 구간 99.6Km까지 확장되어 운영될 전망이다.
TRAFFIC MODE
Subways account for 34.8%, buses 27.5%, taxis 6.5%, and others 4.9% of Seoul’s transportation means as of 2005. After the public transit system was reformed in July 2004, the transportation rates of taxis and buses began to rise, and those of subways and passenger cars have steadily climbed. The 1st stage of subway construction continued from 1974 to 1985. The 2nd stage of subway construction lasted from 1987 to 2000, and Line 9 has been under construction. The subway Line 1 to 8 transport about 6,230,000 passengers per day, and the circular Line 2 carrys 699,222 thousand passengers a year, recording the highest transportation rate, followed by Line 4, Line 5 and Line 7 with 300,000 thousand passengers (as of 2006).
The number of inter-city bus passengers peaked at 3,241.9 million in 1983, and then dwindled to 1,457.0 million in 2004. The number of passengers began to rise in 2005, standing at 1,699.3 million as of 2006. The exclusive median bus lane was first introduced to the Gangnam-Yangjae section of 5.9km in July 2004, and currently operated in 7 sections of 67.9km and to be extended to 11 sections of 99.6Km.

출처 : 서울특별시, 서울통계연보, 2006
서울시정개발연구원 내부자료
서울시 복합환승센터 건립방안연구, 서울특별시 2007