-
산업활동과 재정
총사업체수
-
총사업체수
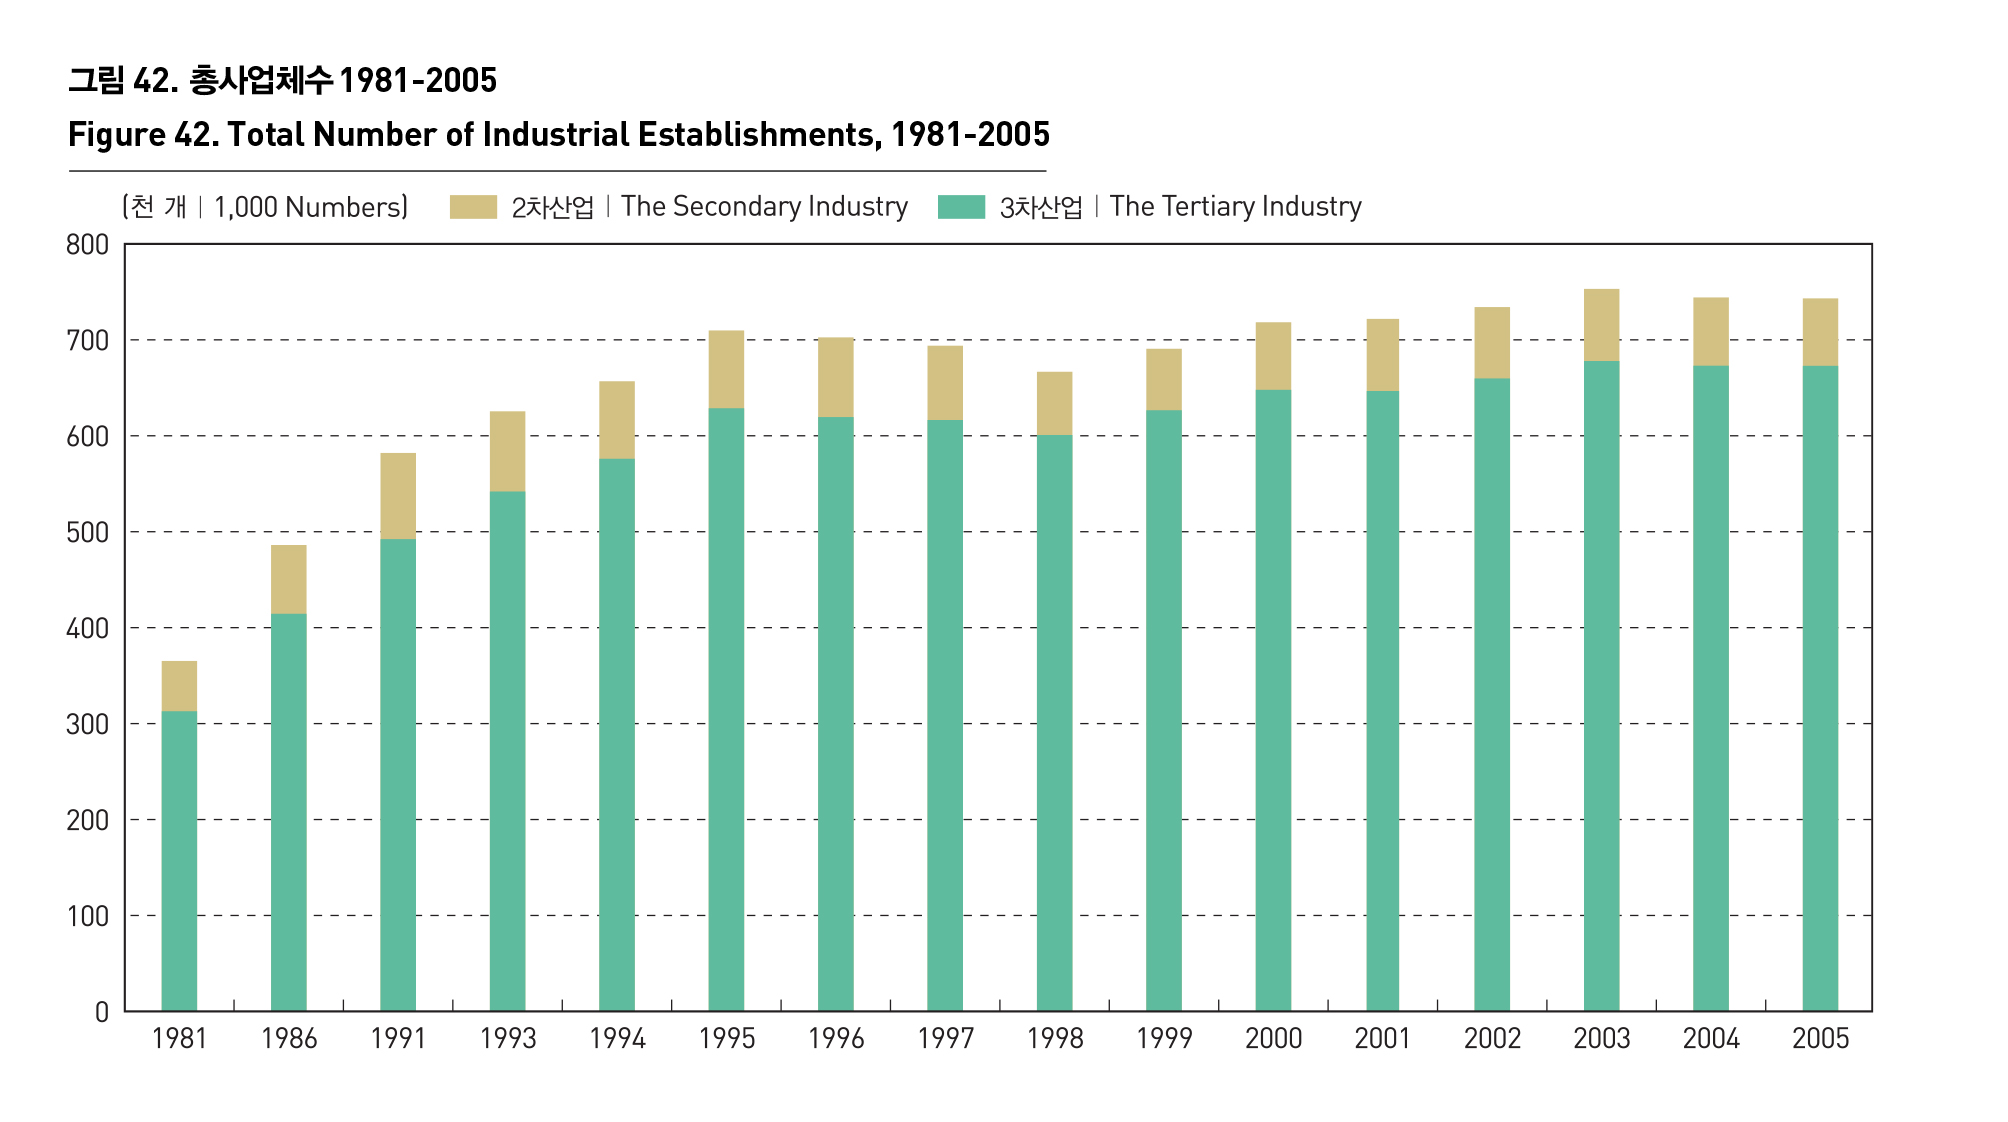
2005년 현재 서울의 총사업체는 약 74만여개로, 지난 1981년 약 36만여개를 기록한 이래로 무려 두 배에 달하는 성장을 보였다. 비록 1995년 70만개로 정점에 도달한 이후 1998년까지 일시적인 감소세를 경험하기는 했으나, 1999년이후부터 꾸준한 성장세를 지속한 것이다.
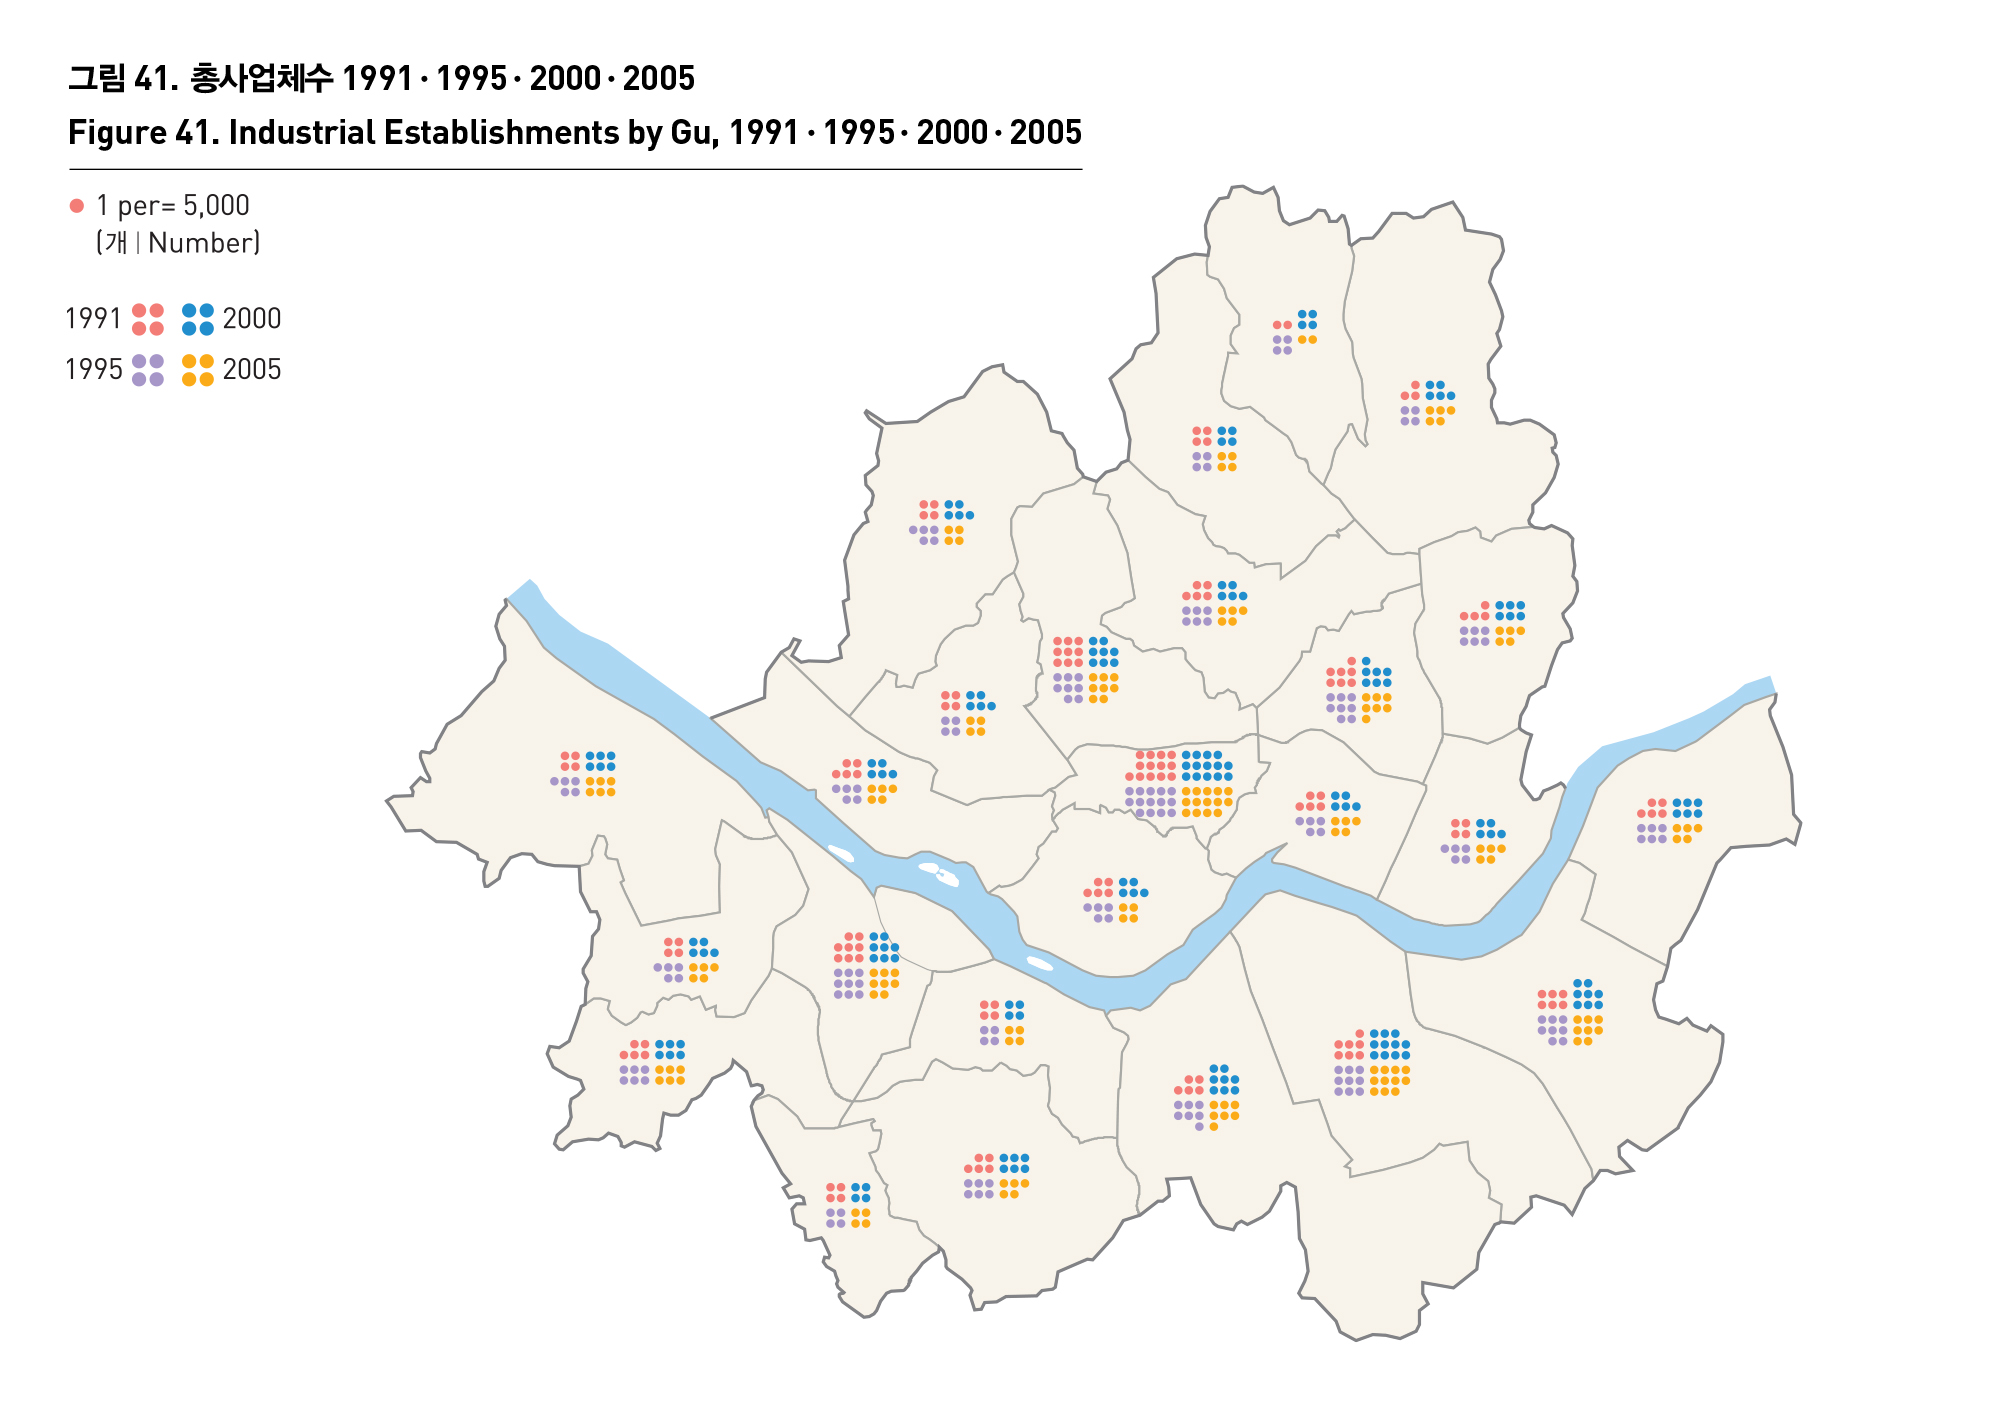
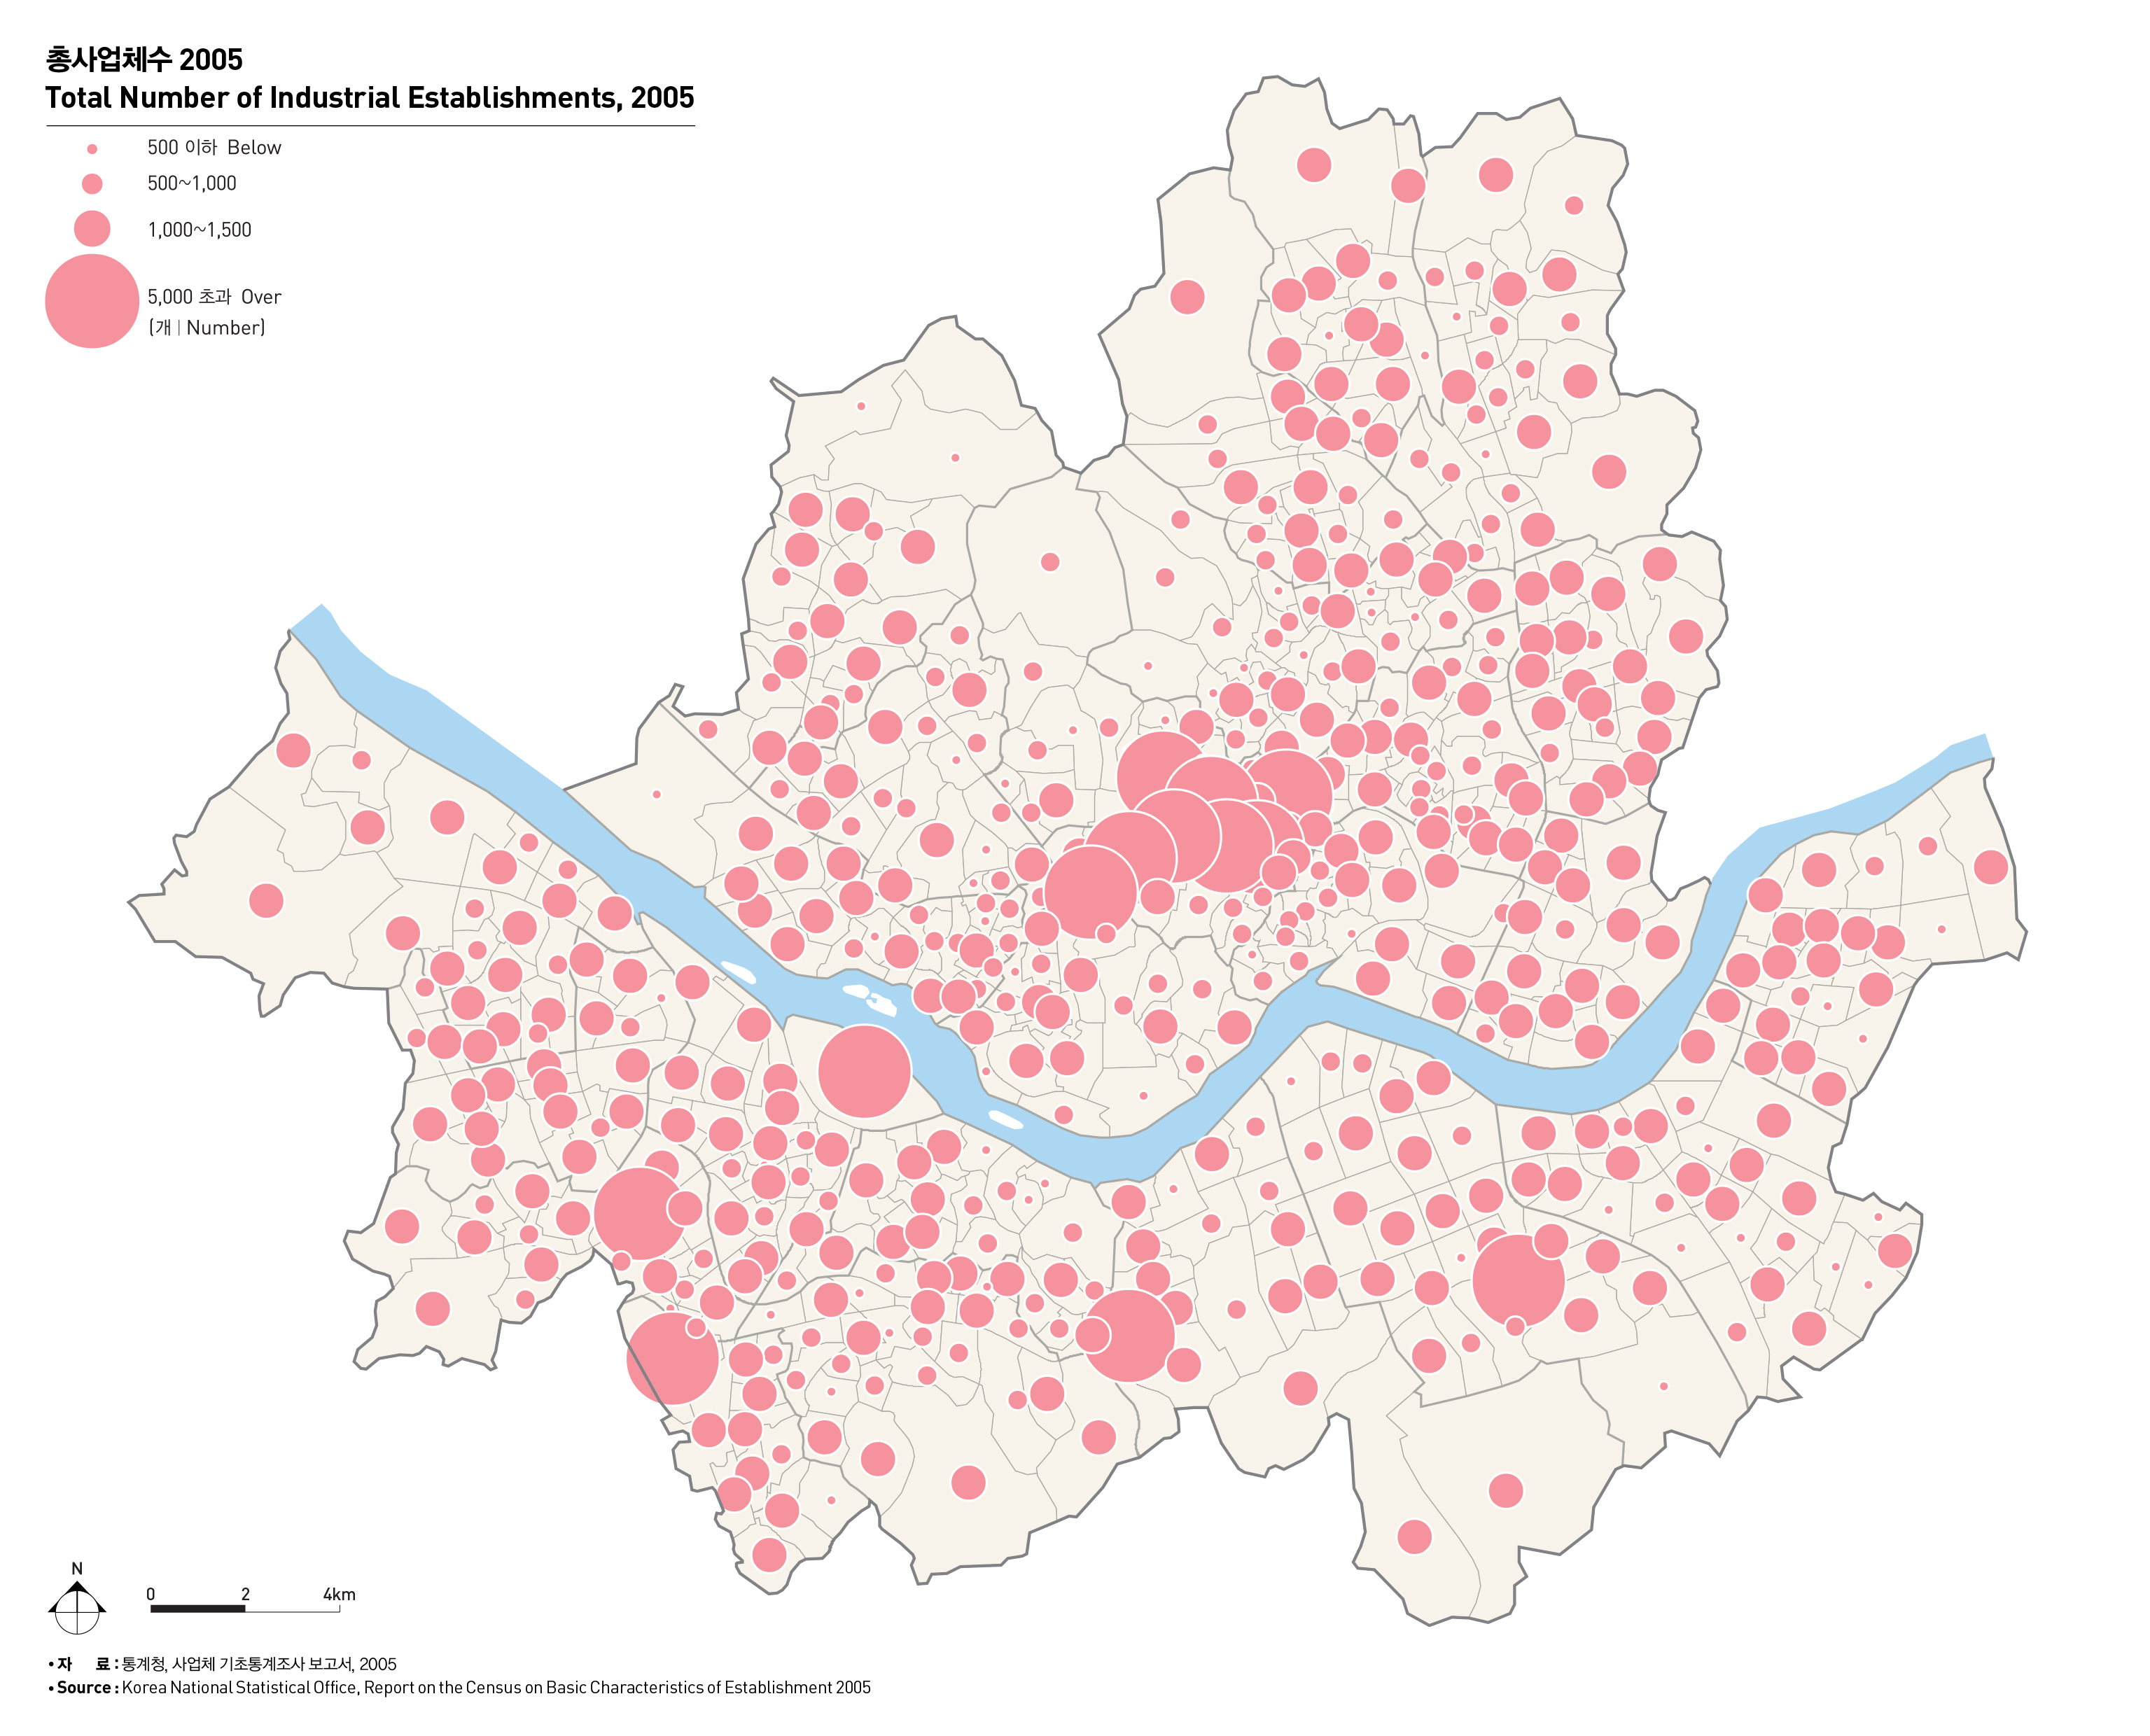
업종별로는 1차 산업이 주기적 증감 속에서도 1981~2005년 기간 동안 지속적인 감소세를 보였고, 2차 산업의 경우에도 1991년 9만개를 정점으로 지속적인 감소세를 보이고 있다. 반면, 3차 산업의 경우에만 1981년 31만개에서 2005년 67만개로 두 배를 상회하는 증가를 나타냈다. 사업체의 공간적 분포 또한 상당한 변화가 있었다. 1991년을 기준으로 사업체가 가장 많이 집적하고 있는 지역으로는 중구, 종로구, 영등포구, 동대문구, 강남구 등이었다. 그러던 것이 종로구, 영등포구, 동대문구 등이 정체한 대신 강남구, 송파구가 급성장을 보여, 2005년 현재 중구, 강남구 송파구, 종로구, 영등포구의 순서를 보이고 있다. 즉, 경제활동의 공간적 분포가 과거 도심권과 서남권에서 동남권과 도심권, 서남권으로 변모되고 있음을 알 수 있다.
INDUSTRIAL ESTABLISHMENTS
There were 360,000 industrial establishments in Seoul in 1981, which doubled to 740,000 in 2005. The number of establishments reached the peak of 700,000 in 1995, and temporarily decreased until 1998, but has steadily climbed since 1999. The primary industry showed a steady decrease from 1981 to 2005 amid cyclical fluctuation. The second industry has also continued to shrink after reaching the highest level of 90,000 establishments in 1991. On the contrary, the tertiary industry saw a two-fold growth from 310,000 establishments in 1981 to 670,000 establishments in 2005. Most establishments were concentrated in Jung-gu, Jongno-gu, Yeongdeungpo-gu, Dongdaemun-gu and Gangnam-gu in 1991. Over time, the growth of establishments in Jongno-gu, Yeongdeungpo-gu, and Dongdaemungu faltered, but establishments in Kangnam-gu and Songpagu flourished. Jung-gu had the largest number of establishments in Seoul, followed by Gangnam-gu, Songpa-gu, Jongno-gu and Yeongdeungpo-gu in 2005.
출처 : 통계청, 사업체 기초통계조사 보고서, 2005