
-
인구
중위연령
-
중위연령
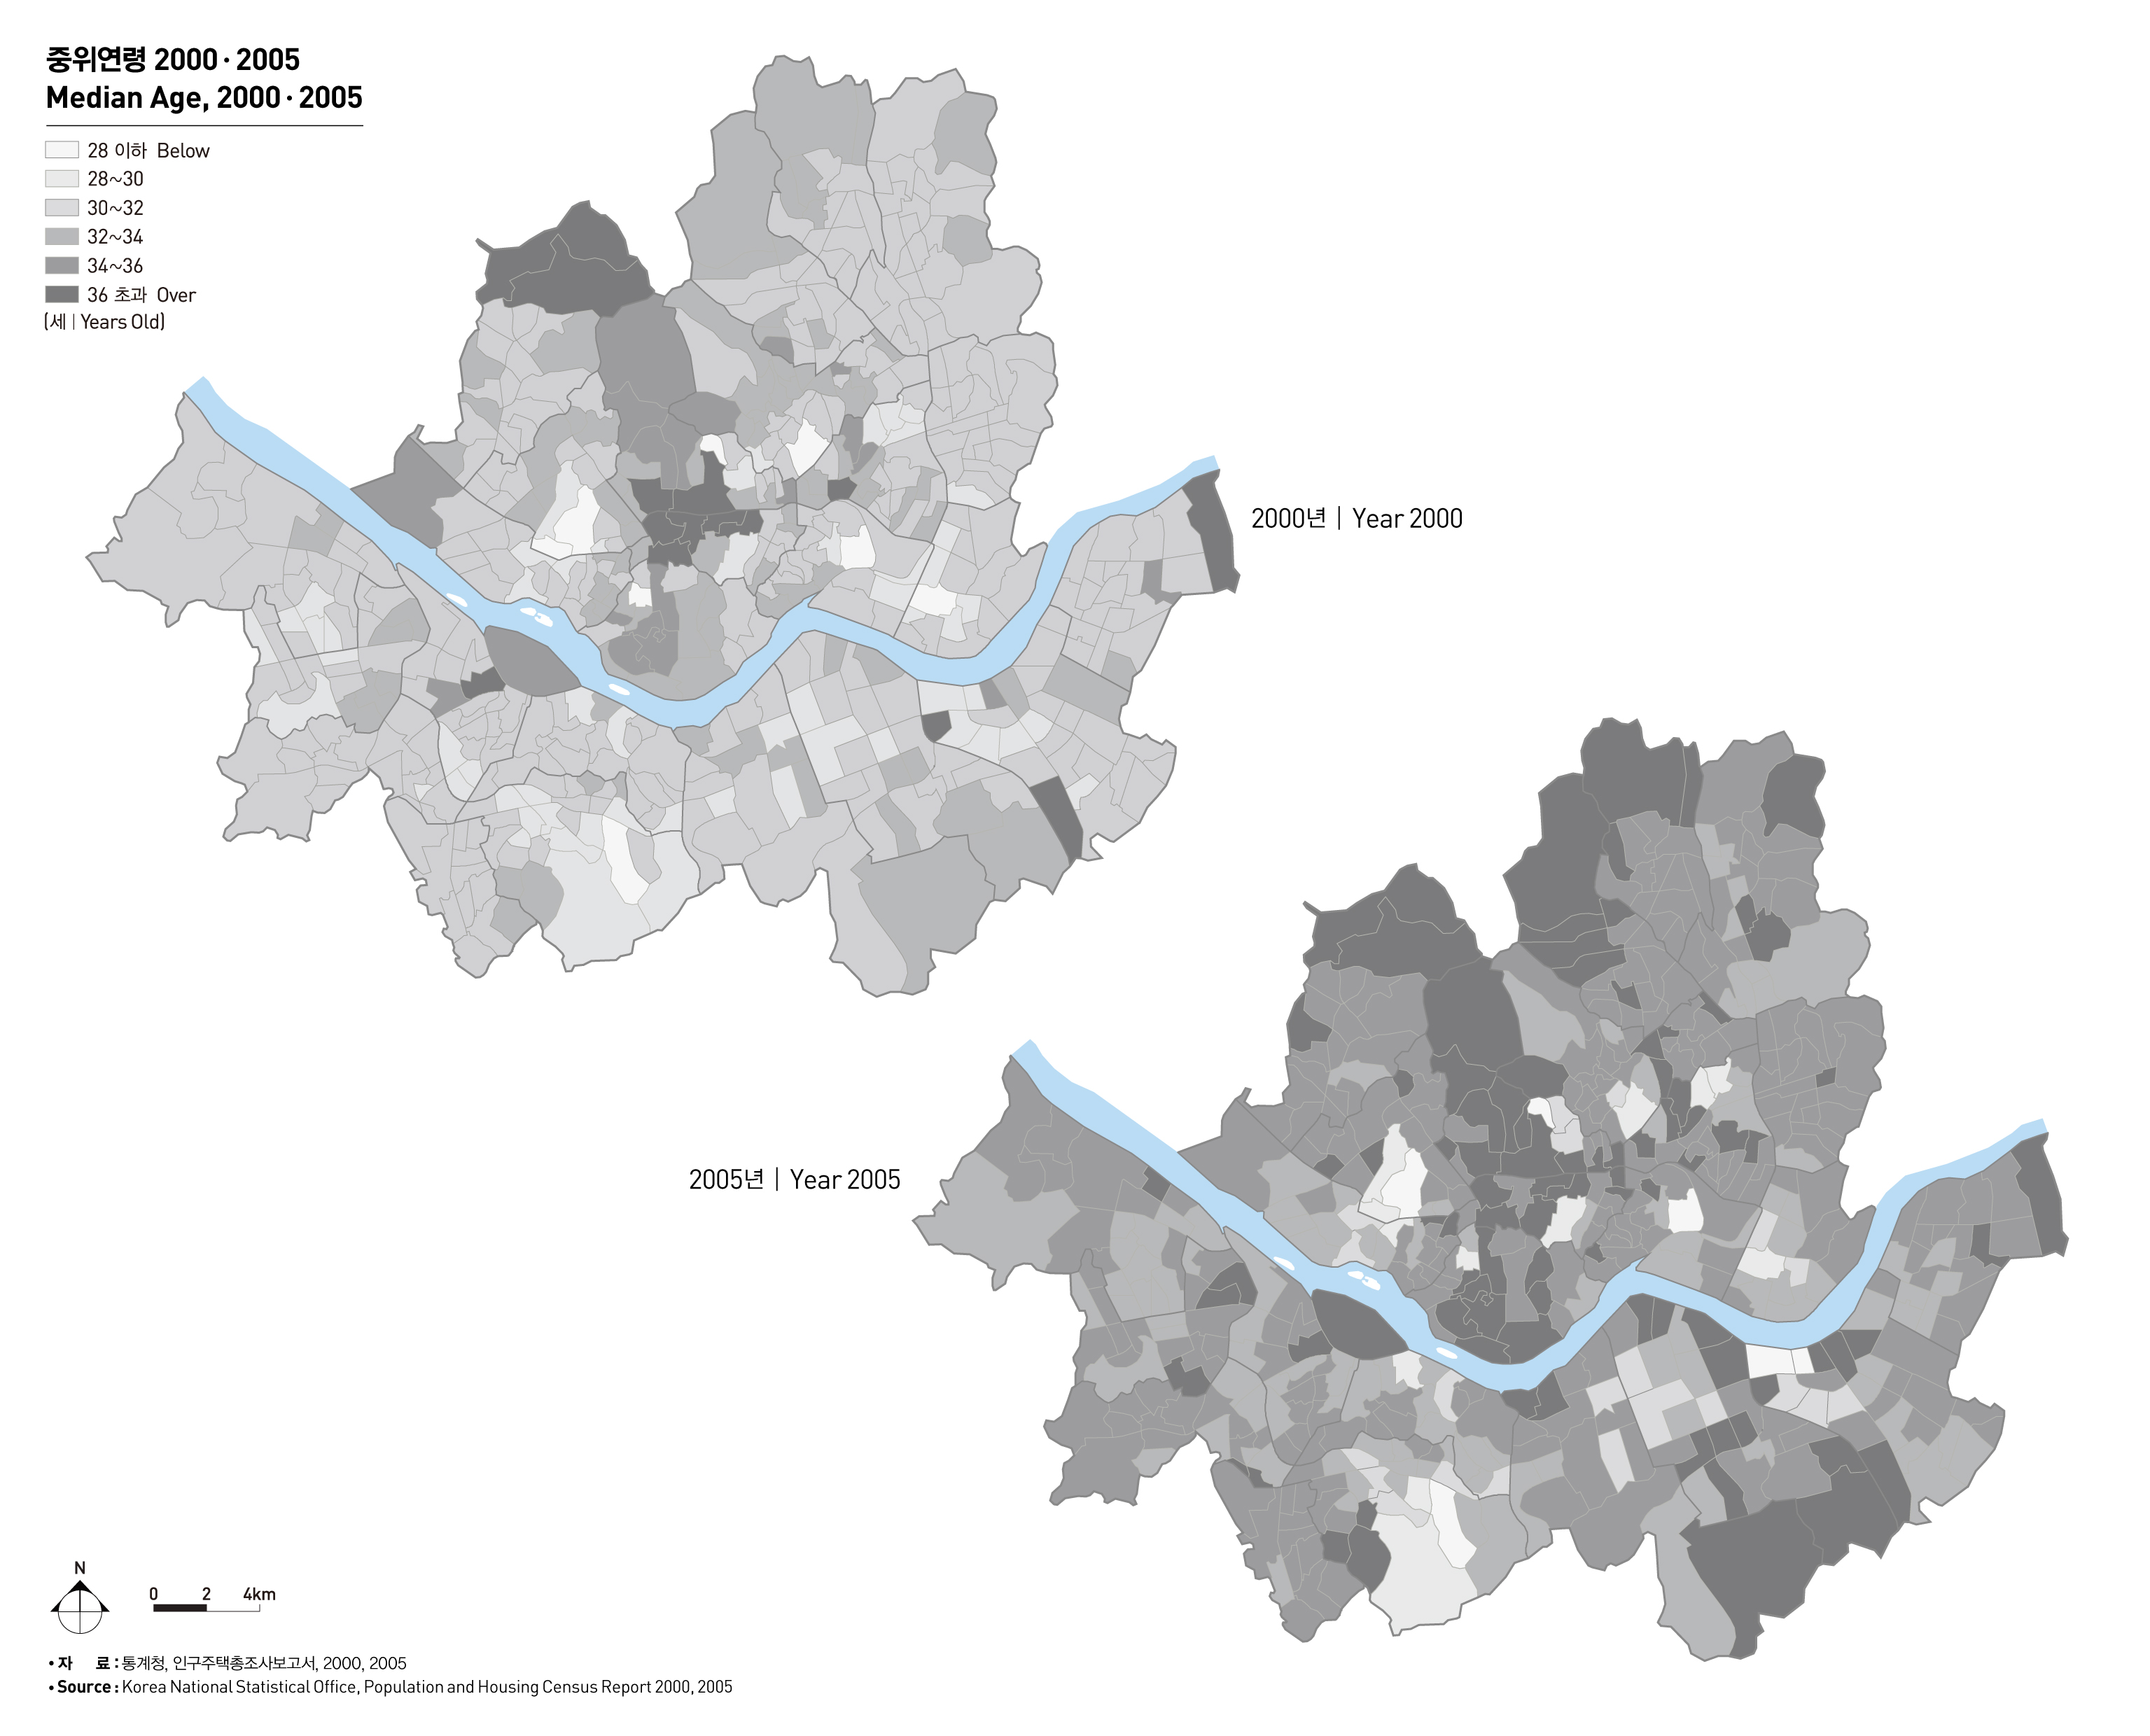
인구의 한 시점에서 여러 부분들 사이의 크기를 비교하여 제시하는 것을 인구구성으로 부른다. 인구를 성, 나이 등으로 나눈 것이 인구학적 구성이며, 주요 사회경제적 배경에 따라 구분한 것이 사회 경제적 인구구성이다. 중위연령이란 한 시점에서 인구의 ‘중앙값’에 따라 인구의 특성을 나타내는 것이다. 대체로 중위연령이 25세 이하인 인구를 ‘어린 인구’라 하며, 중위연령이 대개 30세 이상인 인구를 ‘나이 든 인구’라고 부른다. 서울의 중위연령은 1975년 21.4세에서 10년 단위로 3-4세 정도 늘어나서 2005년 34.3세의‘나이든 인구’구조로 변화하였다. 이러한 변화는 인구의 성구조와 연령구조를 동시에 나타내면서 한 사회의 발전단계와 성격을 보여주는 인구 피라미드에서 더욱 잘 확인할 수 있다. 서울의 인구피라미드는 1975년 근대화 초기 단계의 모습인‘완전 피라미드’형태에서 점차 급격하게 사망률과 출생률이 동시에 떨어지면서 젊은 인구들이 노동시장에 대거 유입되는 종형구조로의 변화를 보여주고 있다. 한편 중위연령의 공간적 분포를 보면 2000년 대비 2005년 시점에서 34세를 초과하는 공간지역이 확연하게 증가하였음을 알 수 있다.
MEDIAN AGE
The median age indicates the characteristics of population, focusing on the median at a certain time. The population whose median age is lower than 25 is called younger population’ and the population whose median age is older than 30 is called 'older population'.
Seoul’s median age grew by 3 to 4 years a decade from 21.4 in 1975 to 34.3 in 2005, showing the structure of ‘older population.’ This change is more clearly seen in the population pyramids indicating population's gender and age structures, as well as a society’s developmental stage and characteristics. Seoul’s population pyramids shifted from ‘perfect pyramid shape’ usually seen in the early modernization in 1975 to the ‘bell shape’, which means a rapid drop in the death rates and birth rates as well as massive inflow of young people into the labor market. The spatial distribution of the median age shows that there was a remarkable growth of spaces where the median age is higher than 34 as of 2005, compared with 2000.
출처 : 통계청, 인구주택총조사보고서, 2000, 2005
