-
인구
인구밀도
-
인구밀도
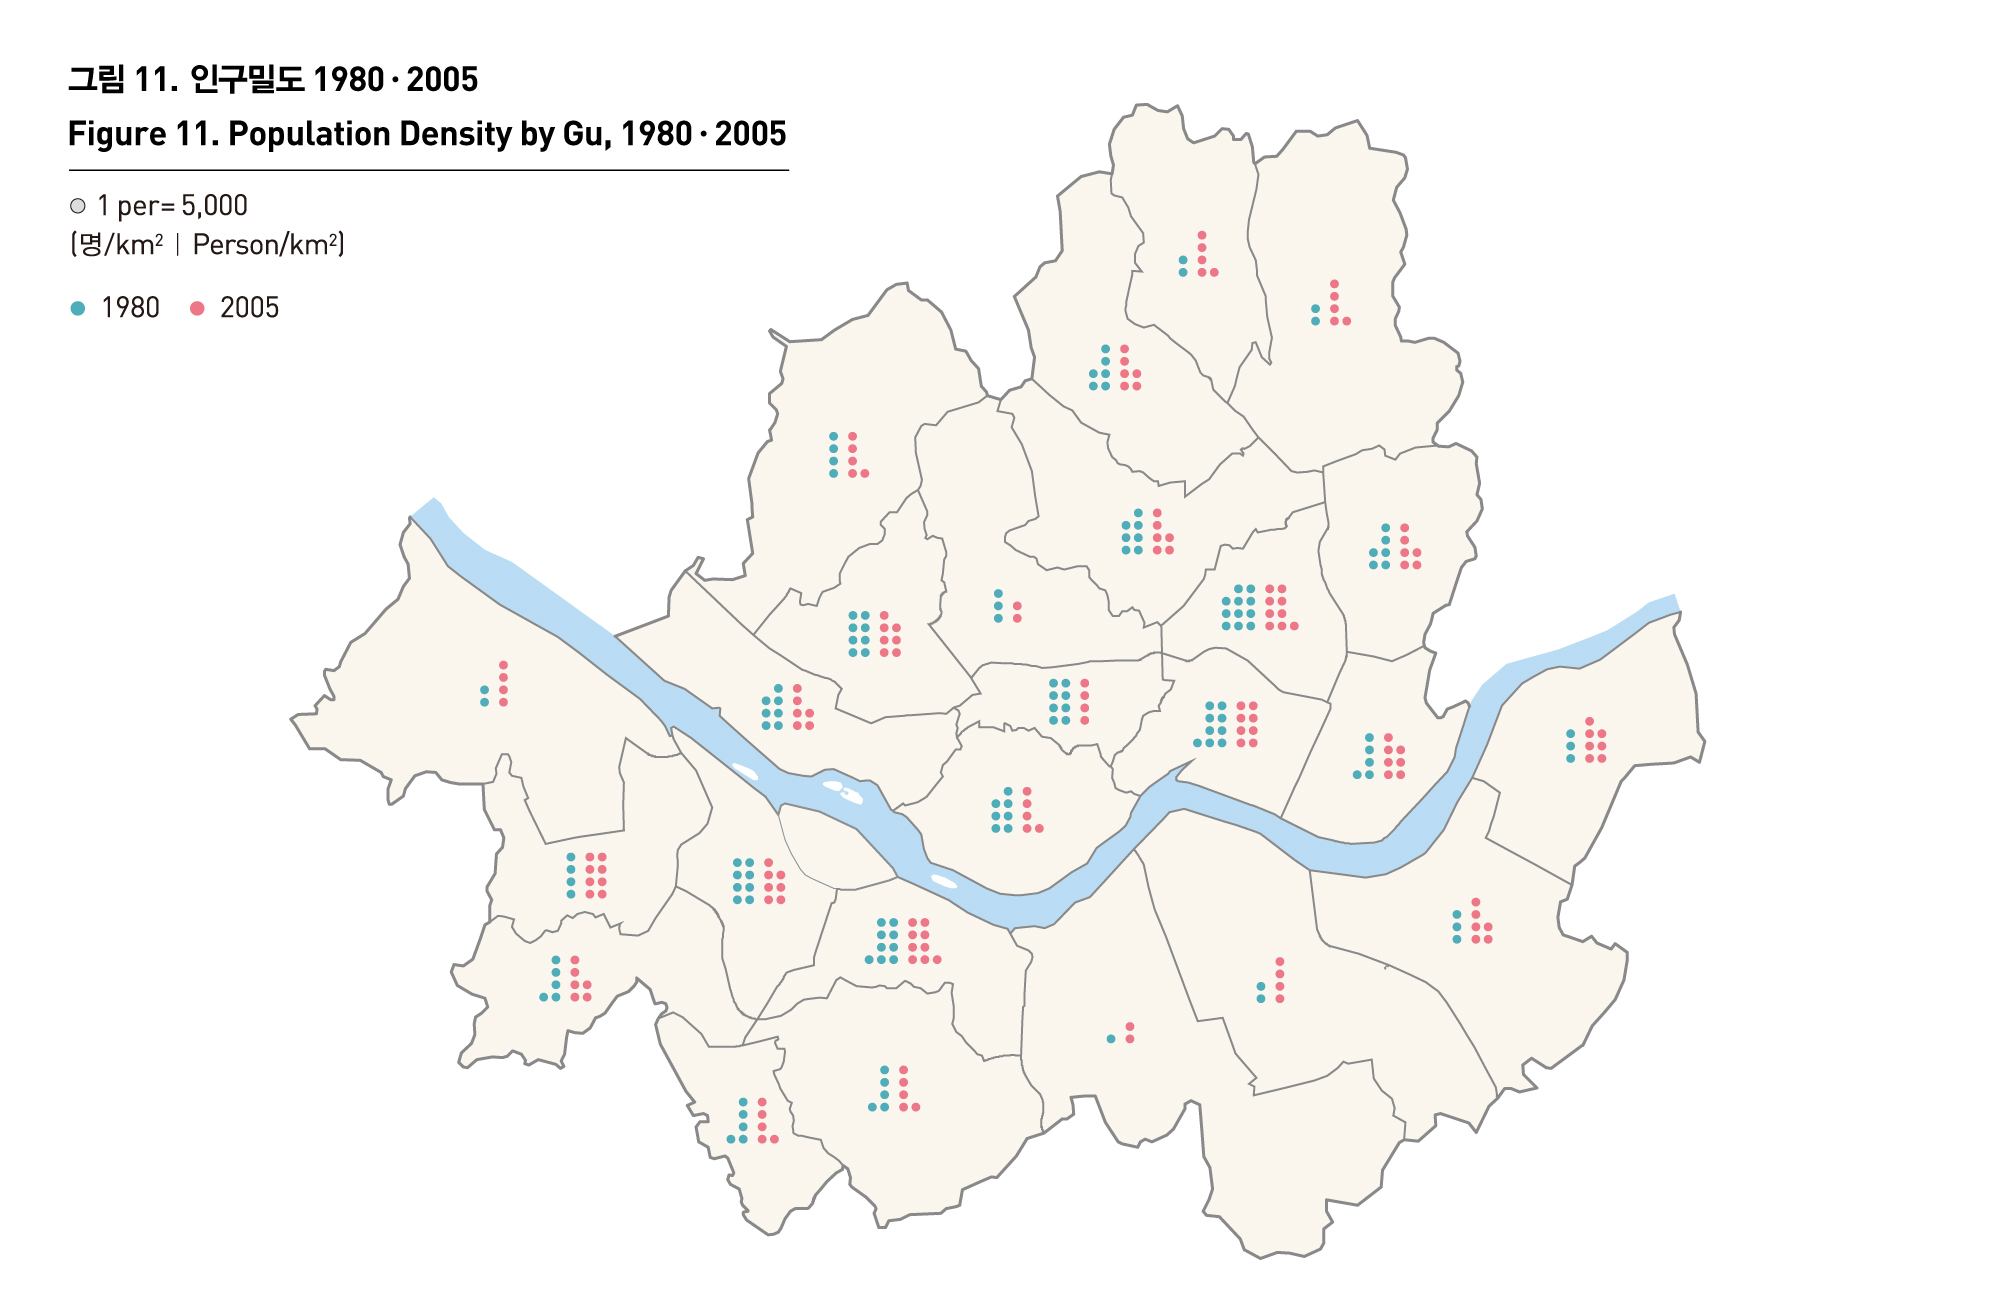
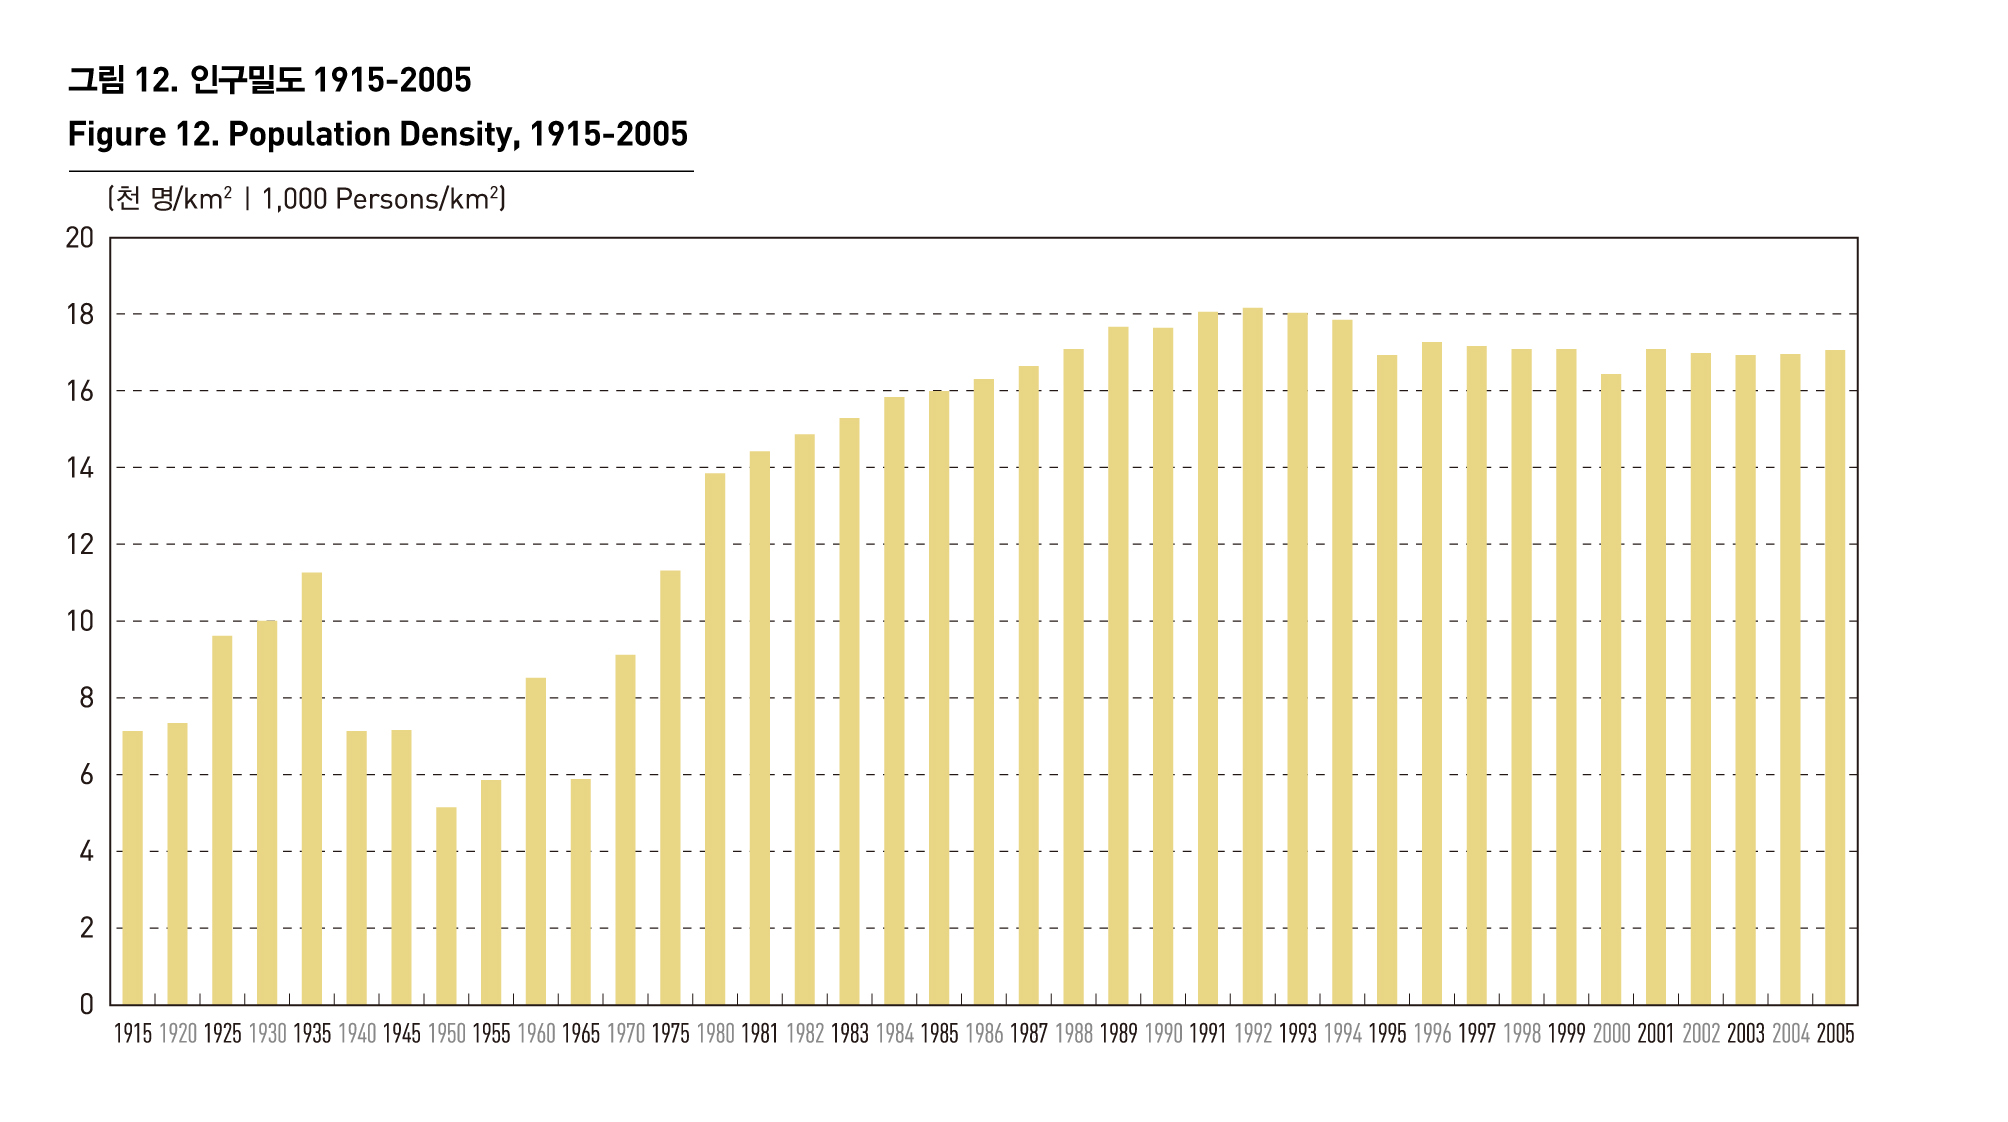
인구밀도란 사람이 거주할 수 있는 공간(시가화지역)에 얼마만큼의 인구가 분포하느냐를 나타내는 기준이다. 서울의 인구밀도는 도시근대화가 시작된 1970년대 이후 1990년까지 지속적인 증가를 보이다가 1995년 이후 본격적으로 감소추세에 들어갔다. 서울의 인구밀도의 런던의 4배, 파리의 2배, 뉴욕의 1.7배 정도의 규모로 인구밀집도가 높은 대도시이다.
이러한 서울의 인구밀도는 공간분포에서 다양하게 나타나는데, 도심지역은 주거기능보다 상업기능이 강하므로 인구의 도심공동화로, 서울 외곽지역은 개발제한구역의 설정으로 낮은 인구밀도를 보이며, 인구밀도가 높은 고밀도 지역은 연속적이라기 보다는 서남권과 동북권, 그리고 서북권 일부 동에서 군집적으로 나타나고 있다. 이러한 인구밀도의 공간적 다양성은 서울의 성장과정에서 택지개발과 주택공급정책, 버스 및 지하철 등 대중교통 수단의 보급 등 여러 가지 요소들이 결합된 결과이다.
POPULATION DENSITY
Population density is a standard indicating how much population is distributed in a living space (urbanization promotion area). As urban modernization began in 1970s, Seoul’s population density steadily increased from 1970s to 1990s, but began to decrease after 1995. Seoul has a relatively high population density, which is 4 times that of London, 2 times that of Paris and 1.7 times that of New York.
Seoul’s population density greatly depends on its spacial distribution. For example, downtown area has stronger commercial function than residential function, so the outflow of urban population leads to low population density. The outskirts of Seoul see low population density due to the establishment of restricted development districts. Regions with high population density gather together in some southwestern, northeastern and northwestern regions. The regional diversity of population density is a result of a combination of several factors including housing development, housing supply policy and distribution of public transportation system such as buses and subways.
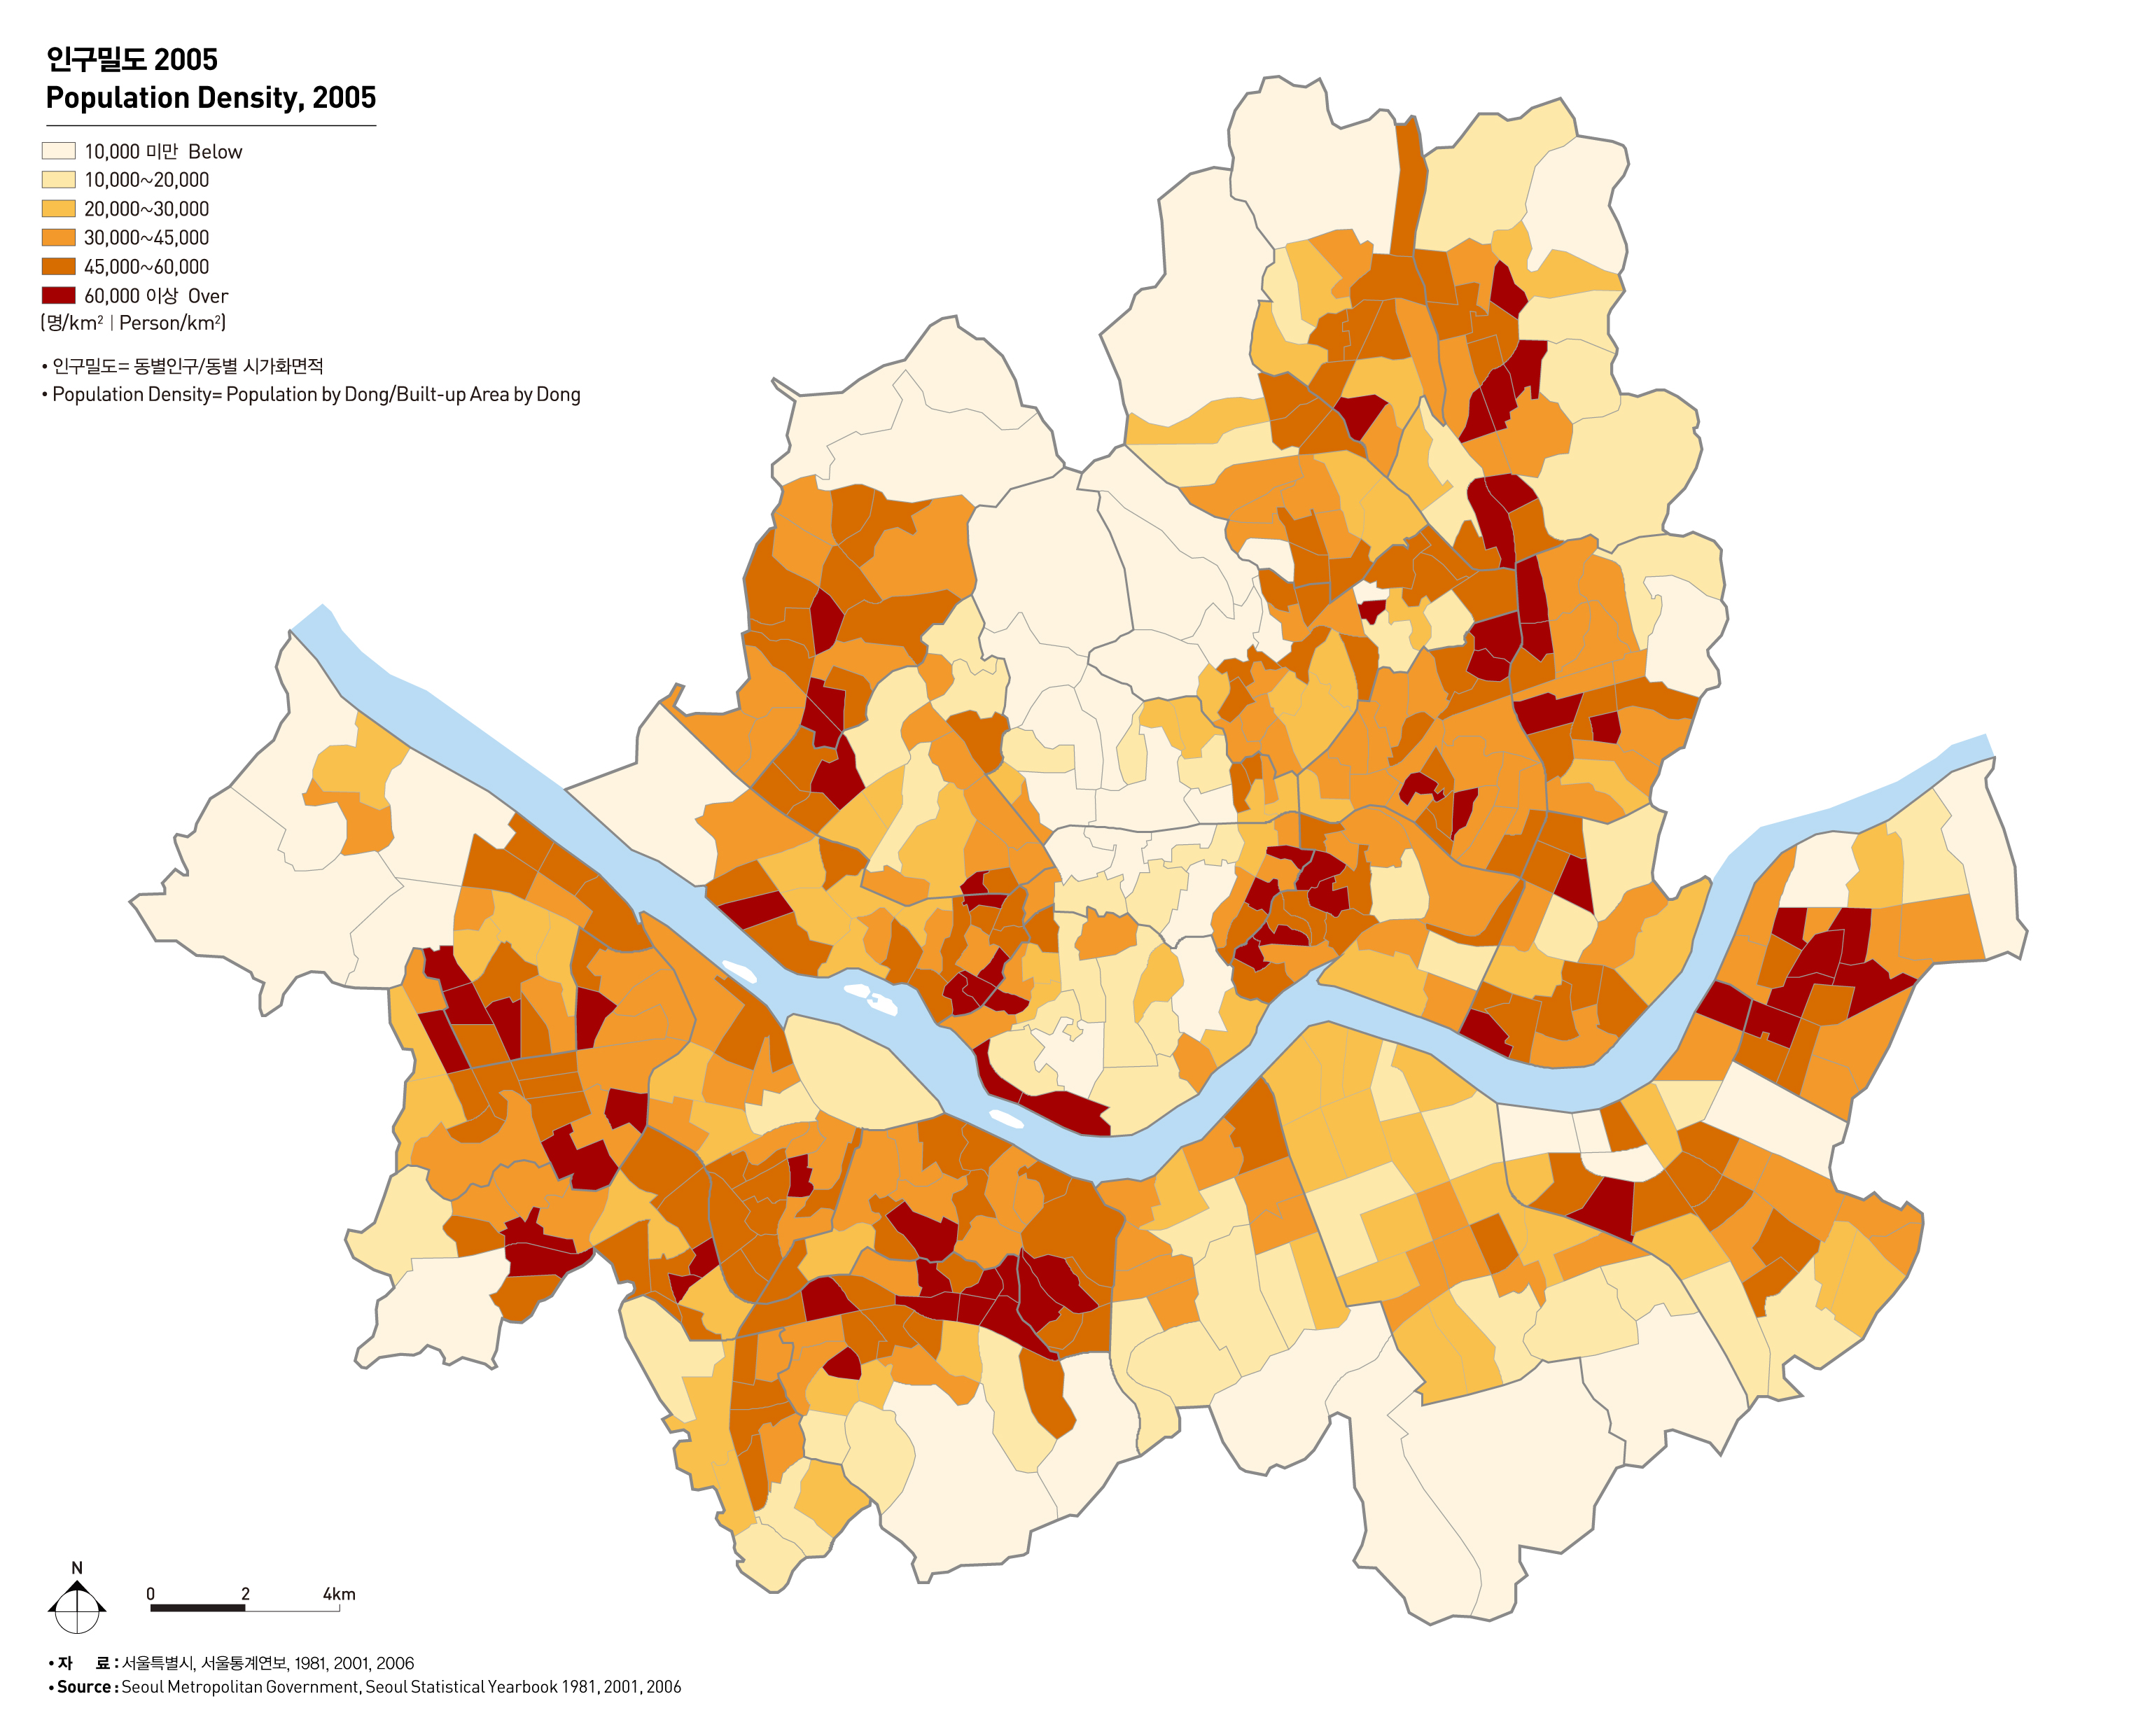
출처 : 서울특별시, 서울통계연보, 1981, 2001, 2006