-
인구
인구변화
-
인구변화
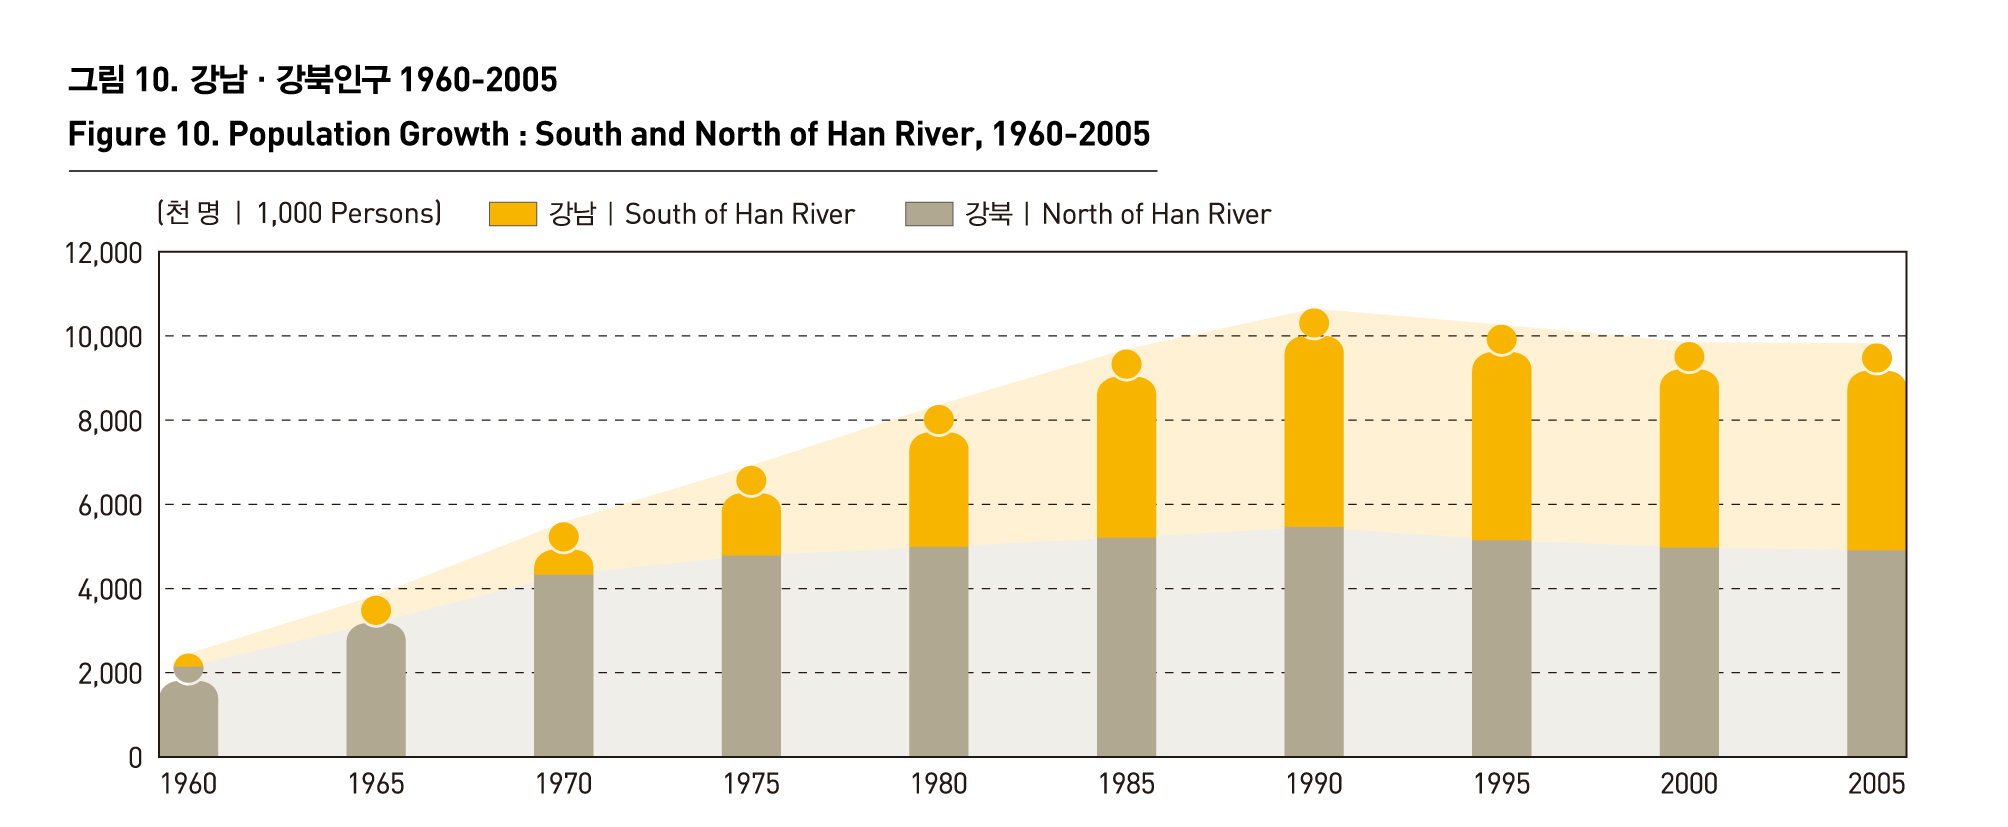
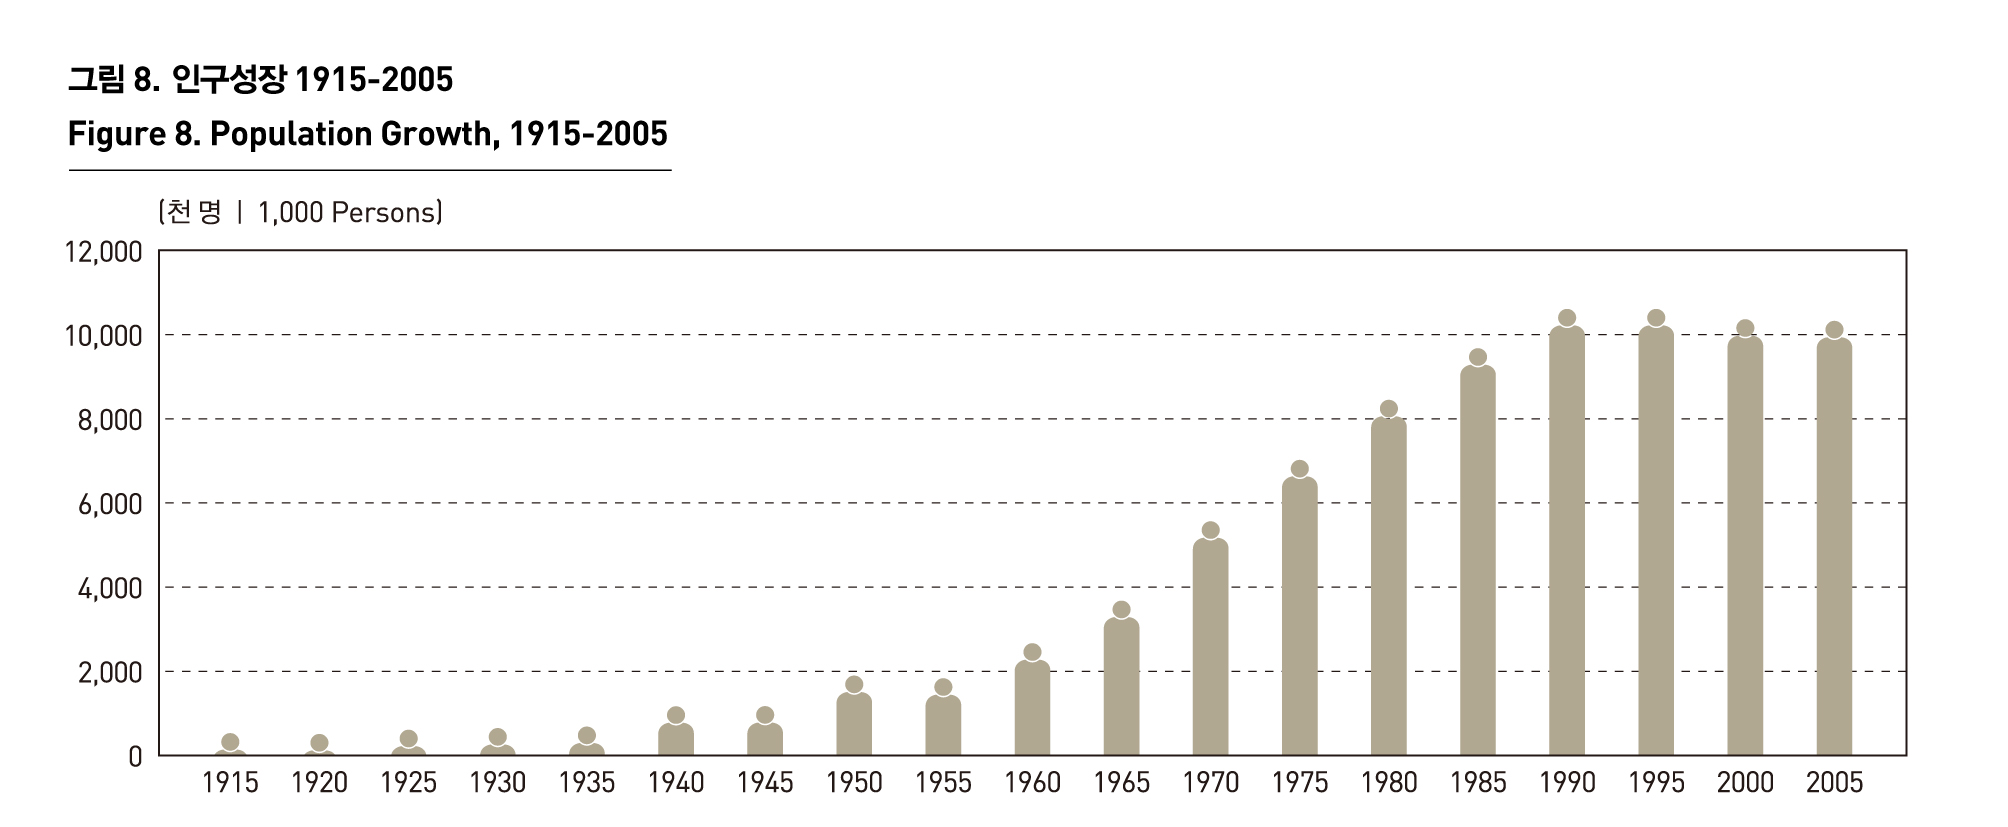
지역별 인구변화를 의미하는 인구성장은 출생, 사망, 인구이동에 의해 결정된다. 이 가운데 출생과 사망을 합해 자연적 성장, 전입자와 전출자에 의한 인구이동을 사회적 성장으로 부른다. 서울의 전체 인구는 1936년 행정구역 확장에 따른 인구증가, 1950년 한국전쟁으로 인한 급격한 인구 감소 이후 1990년까지 증가하다가 1990년을 기점으로 정체 혹은 감소추세에 있는 가운데, 2000년 대비 2005년 인구는 미세하게 감소한 정도이다. 서울의 인구유형은 인구변천을 끝낸 5단계 유형에 속하는데, 이는 서울의 인구가 안정단계에 들어섰다는 의미이다.
이러한 전반적인 인구 안정화 추세 가운데 일부 지역에서는 지역개발정책에 따른 인구 증가 현상을 보이고 있다. 도심지역은 1980년대 이후 상업기능 강화로 상주인구 감소로 인구가 줄어들고 있으나, 1980년대 강남 개발 이후 강남의 인구가 급격하게 늘어났으며 서북권과 동북권 일부 지역의 재개발에 따른 인구증가 현상을 확인할 수 있다. 그러나 2005년 기준 지난 5년 동안 서울의 인구변화의 공간적 분포를 살펴보면 거의 모든 지역에서 인구감소가 나타나는 가운데 특정 몇몇 재개발이 이뤄지고 있는 지역에서만 인구증가 현상이 나타난다.
POPULATION CHANGE
The expansion of administrative districts in 1936 resulted in population growth, and the Korean War led to a dramatic decrease in population in 1950. Seoul's population continued to increase until 1990, but the population stayed unchanged or even shrank. Seoul’s population type falls under the 5th category that completed population transformation, indicating the growth trend of Seoul’s population has stabilized.
Amid the stabilization of Seoul’s population, some regions saw population growth thanks to their regional development policies. Strengthened commercial function of the downtown has led to a drop in the number of its settled population since 1980s. Development in the South of Han river in the 1980s resulted in a remarkable population growth, and redevelopment project led to population growth in northwestern and northeastern regions. Spacial distribution of population change from 2000 to 2005 shows that most regions show population decline, except in some redeveloped regions.
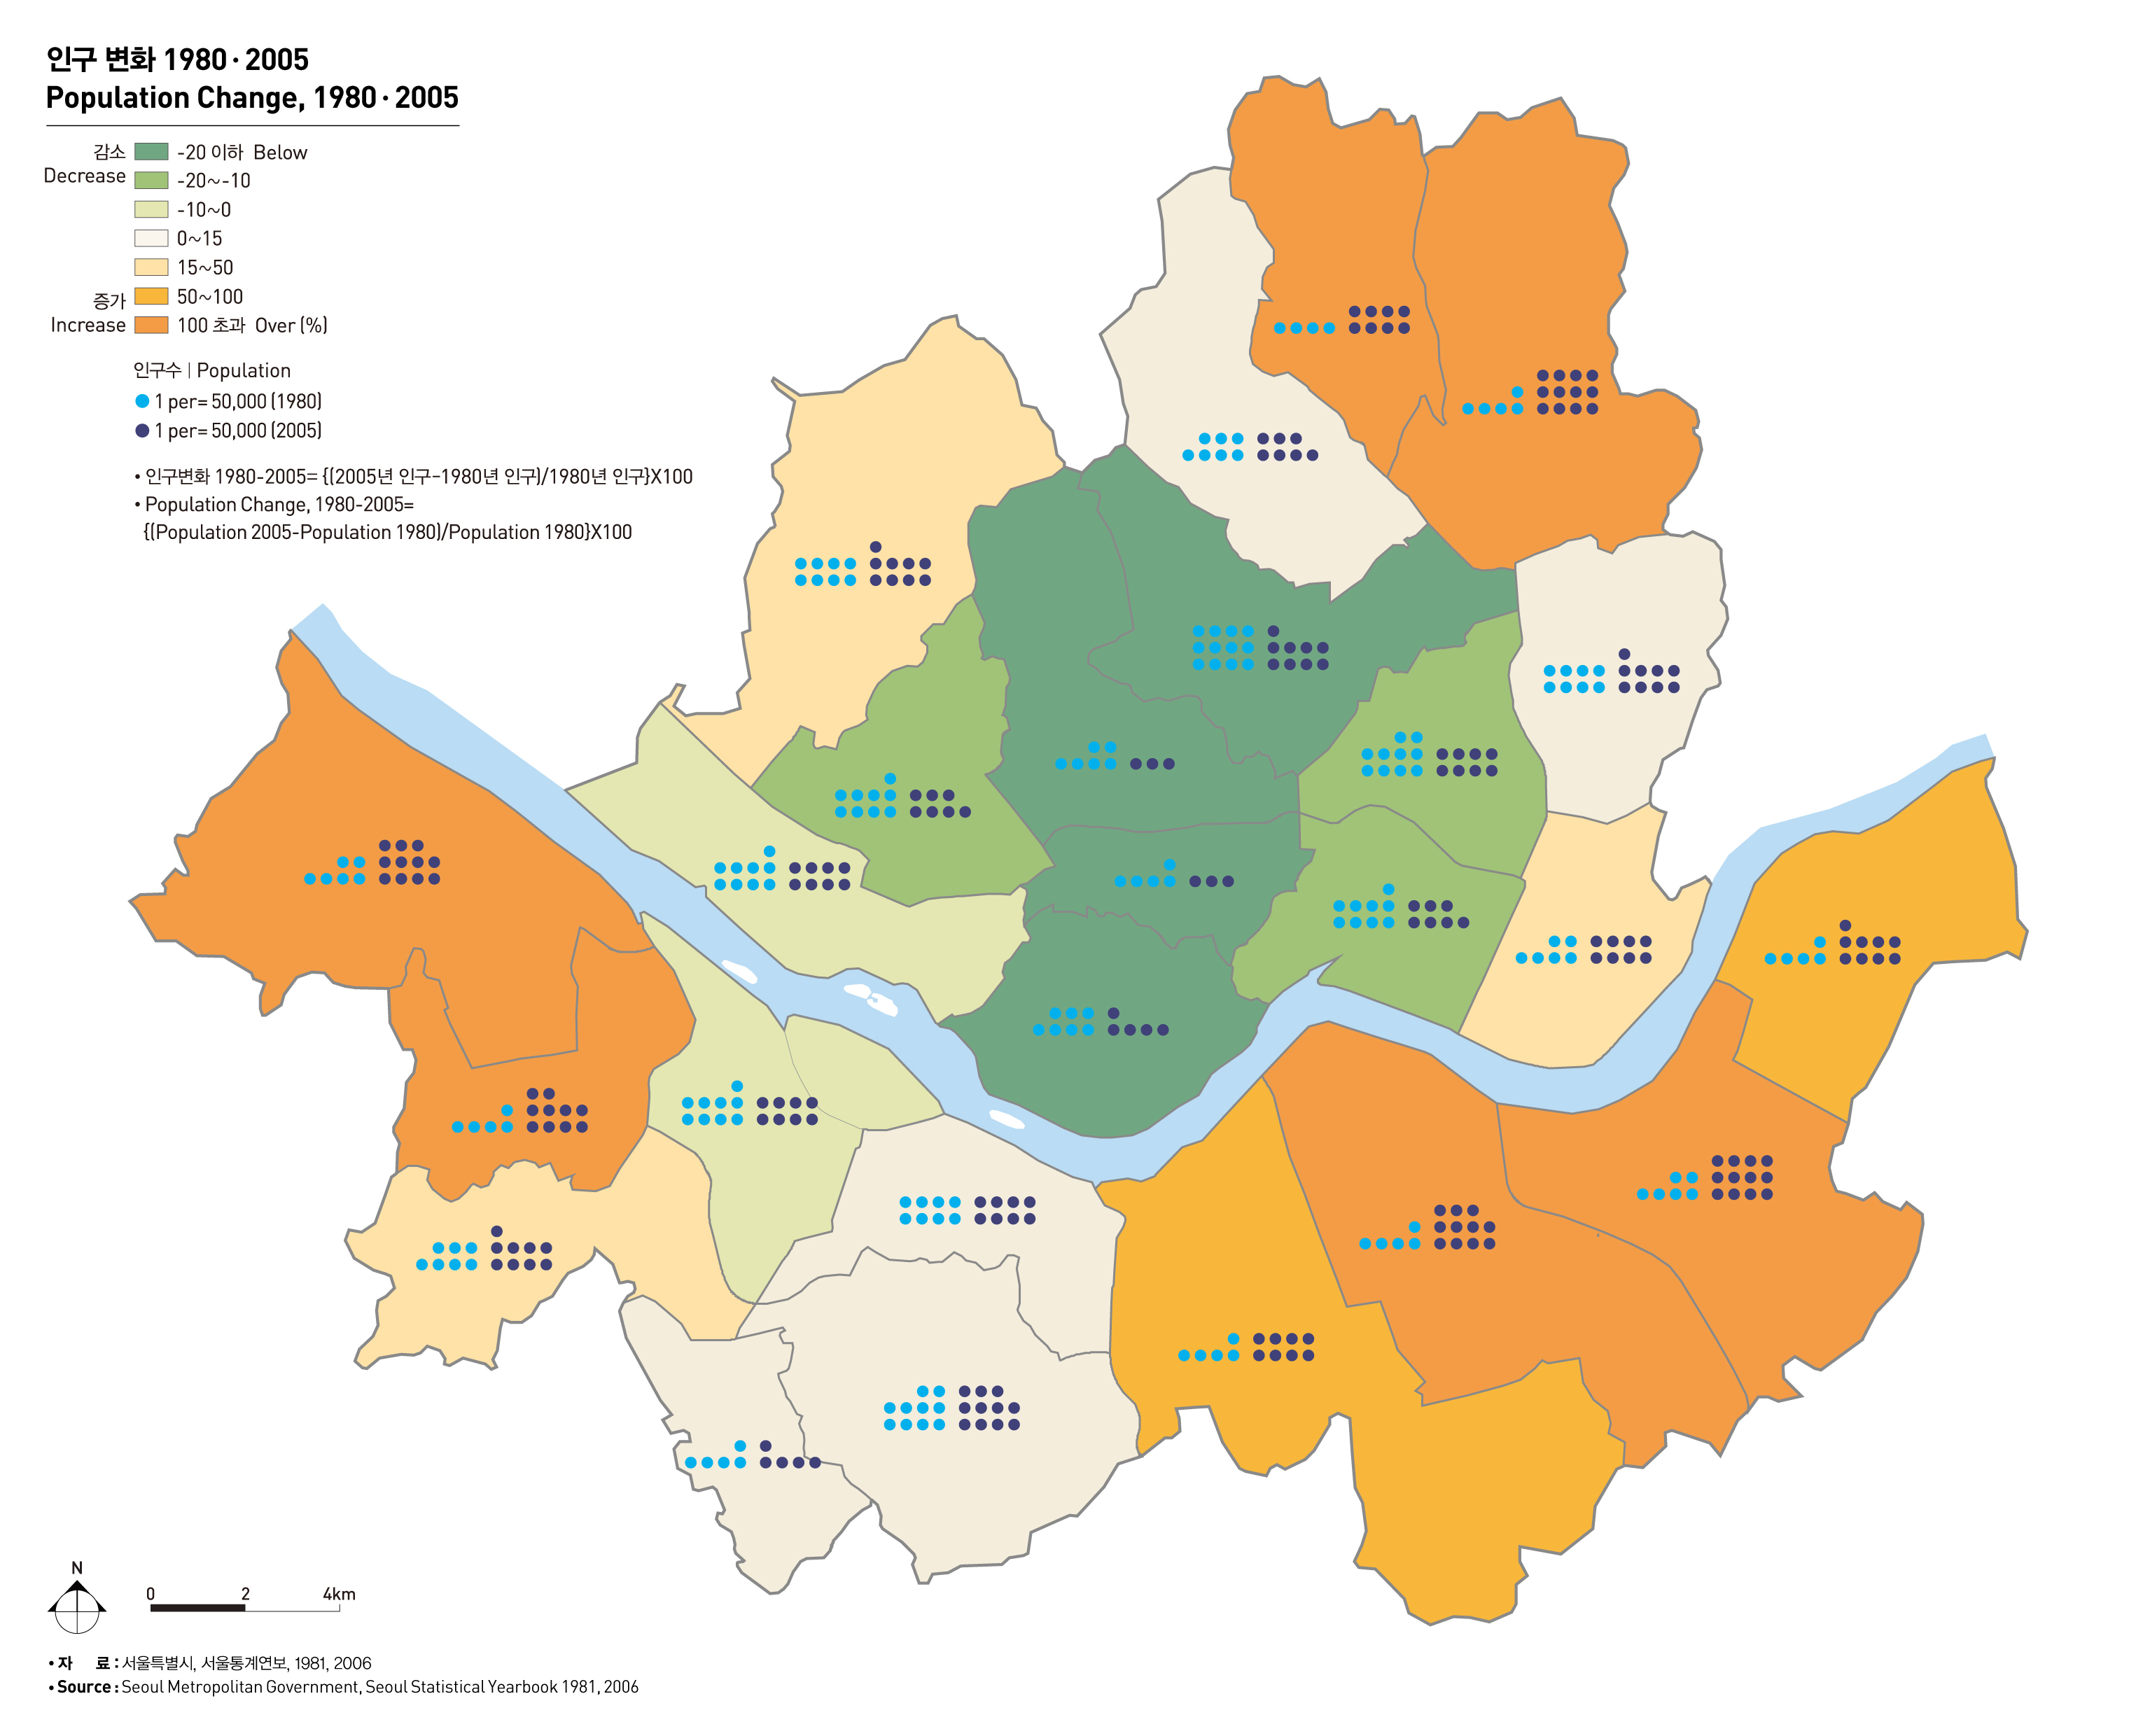
출처 : 서울특별시, 서울통계연보, 1981, 2006
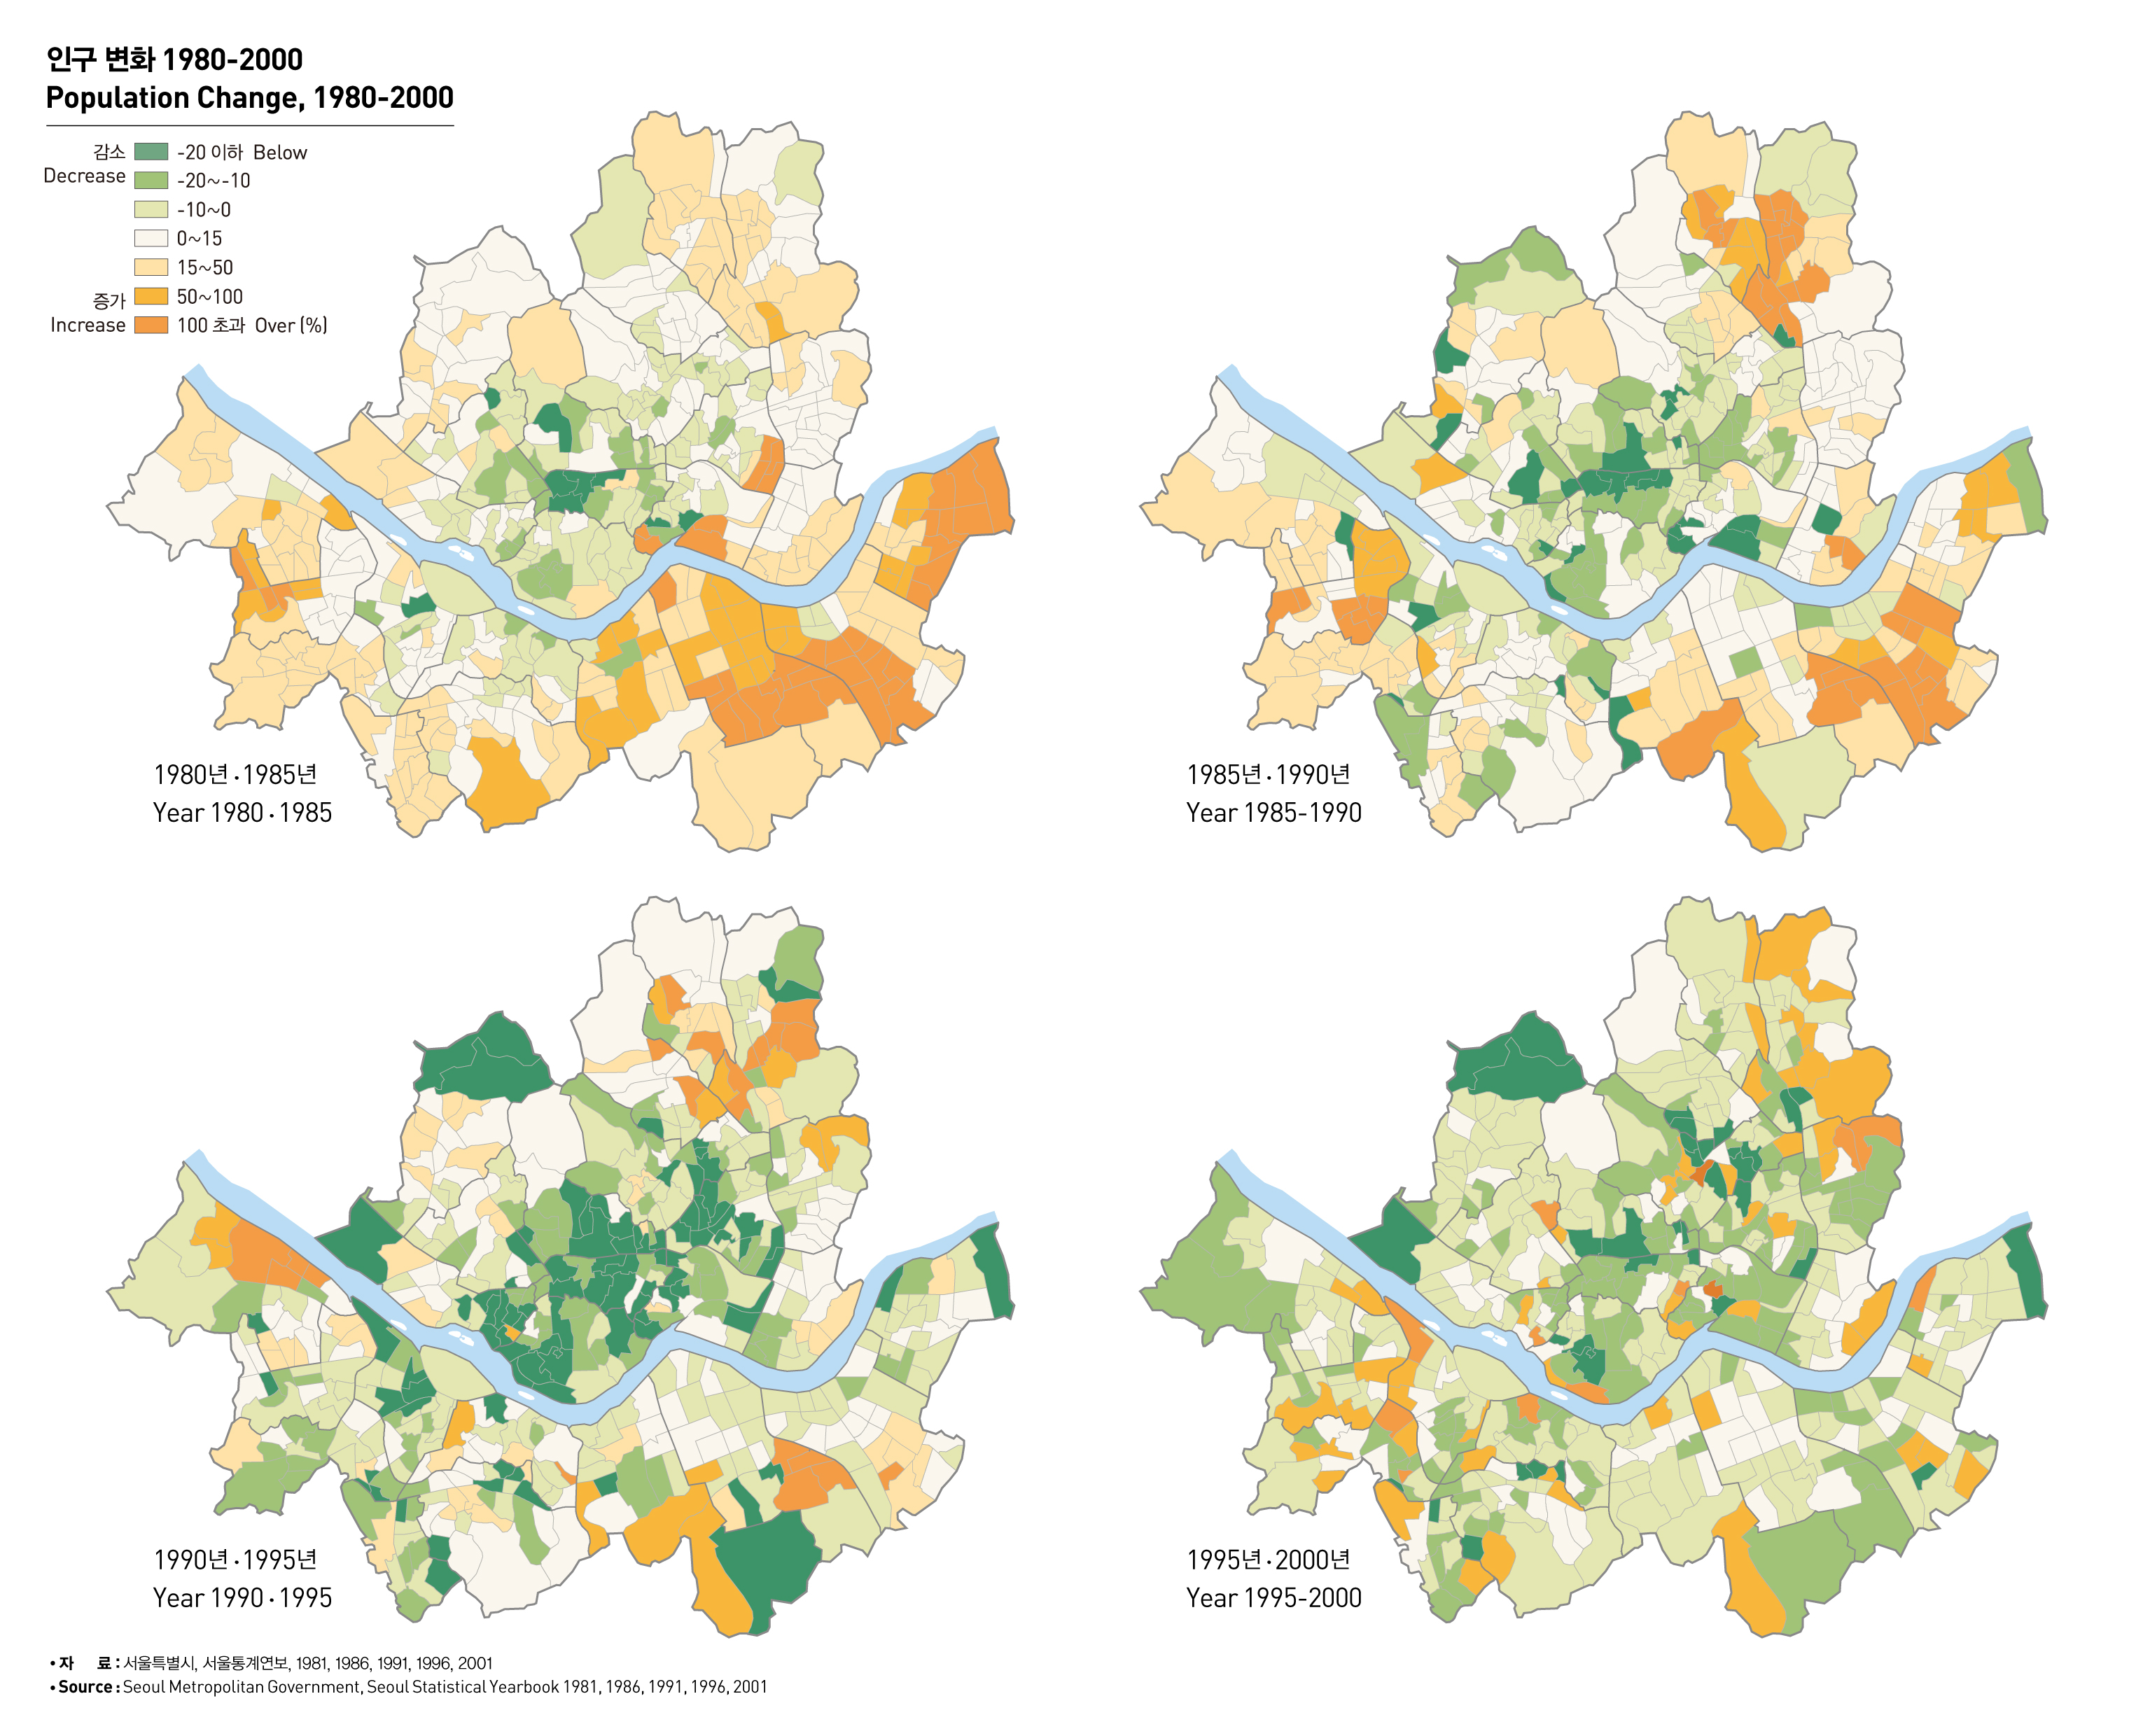
출처 : 서울특별시, 서울통계연보, 1981, 1986, 1991, 1996, 2001

출처 : 서울특별시, 서울통계연보, 2001, 2006
 1915-2005.jpg)