-
환경
대기
-
대기
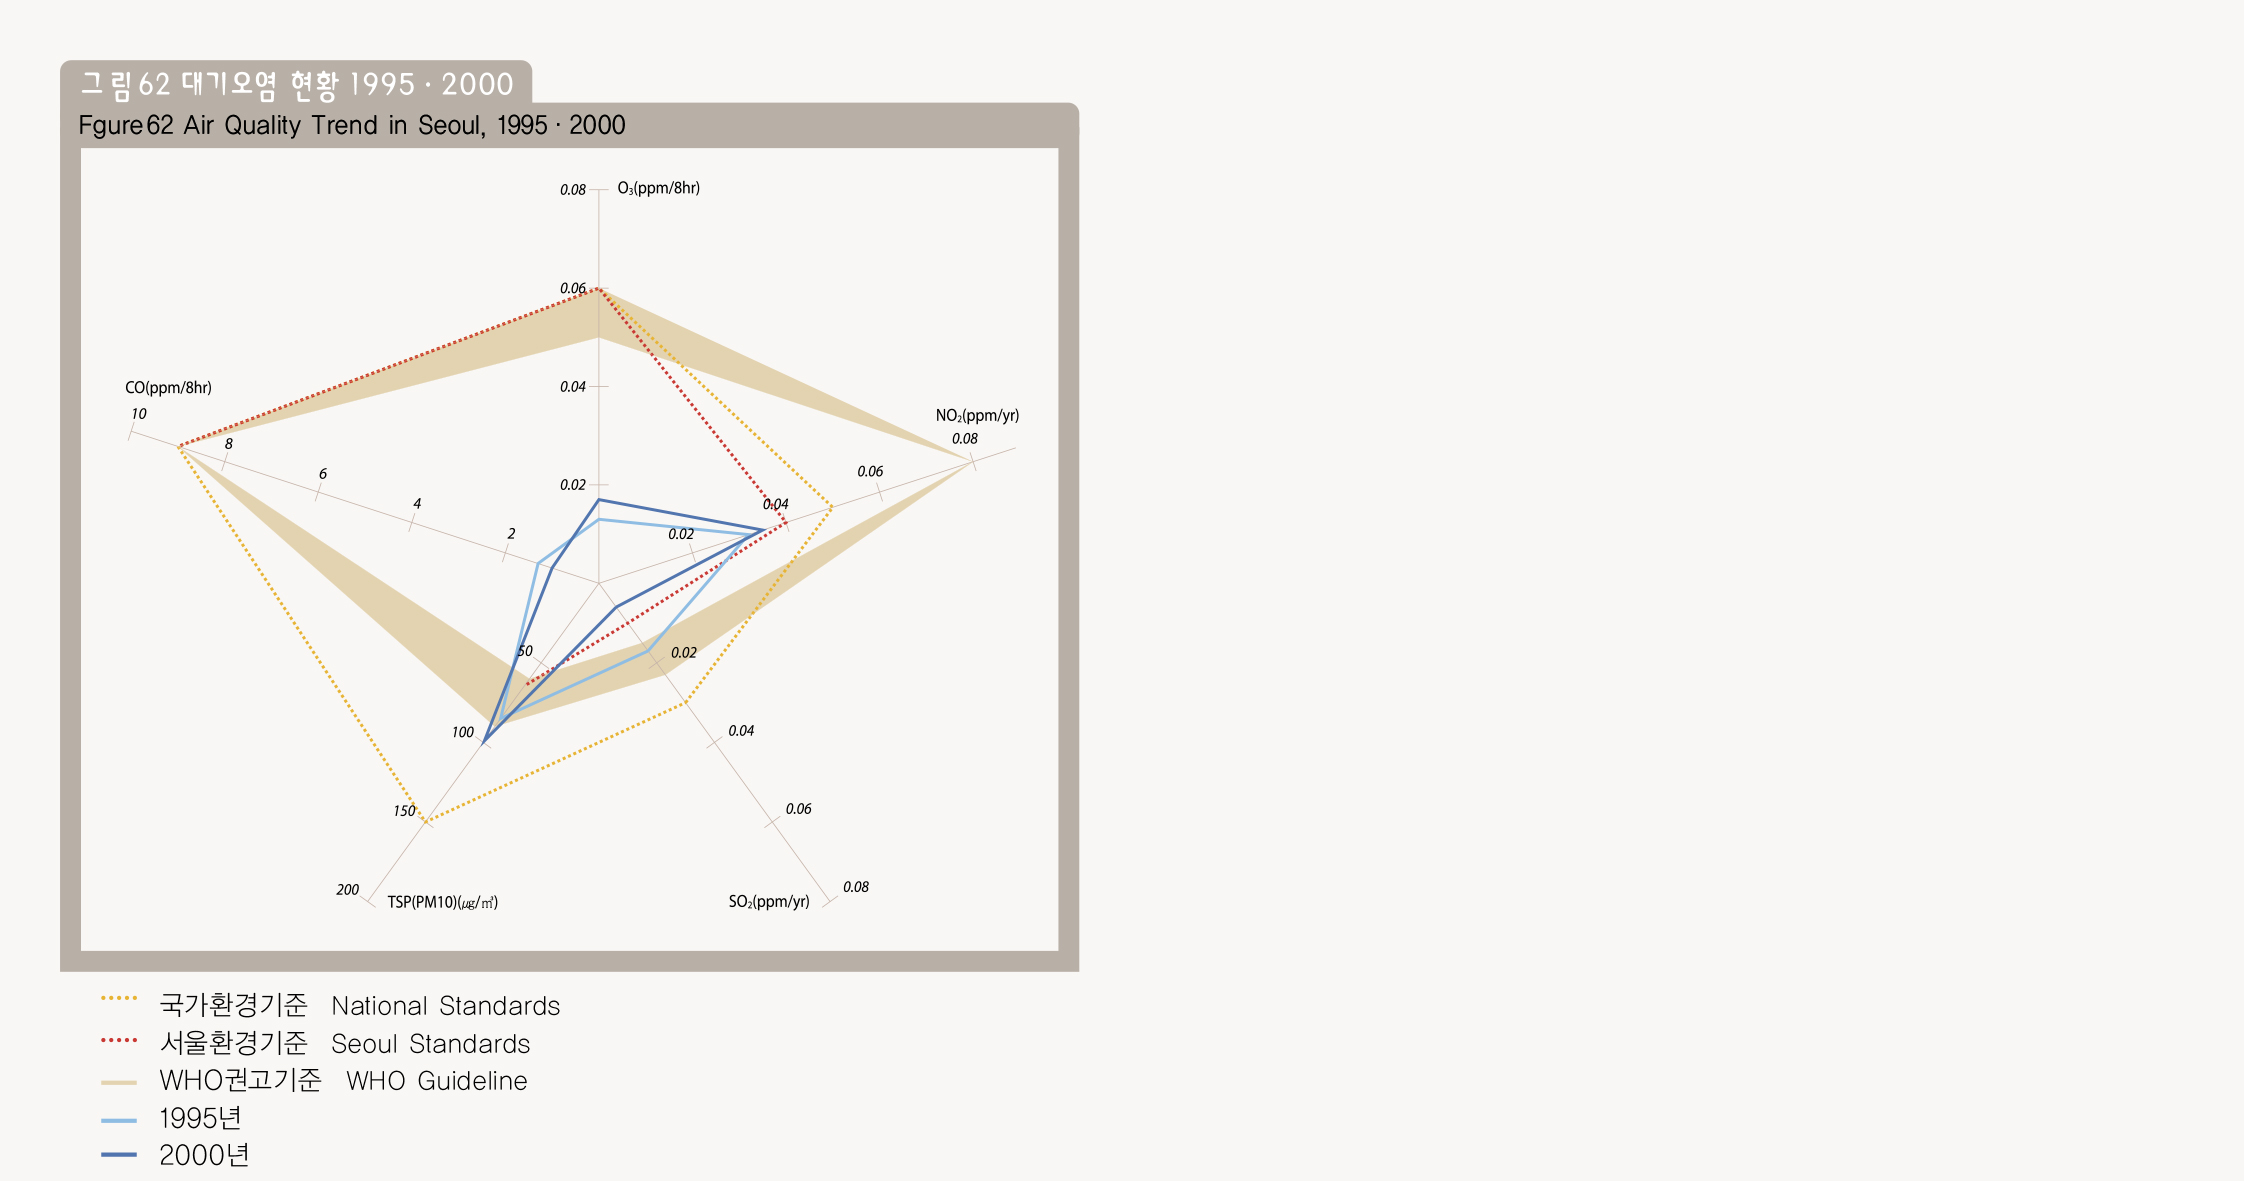
대기의 오염상태는 이산화황(SO2), 오존(O3), 이산화질소(NO2), 분진(TSP, PM10), 일산화탄소(CO)의 농도로 나타낸다.
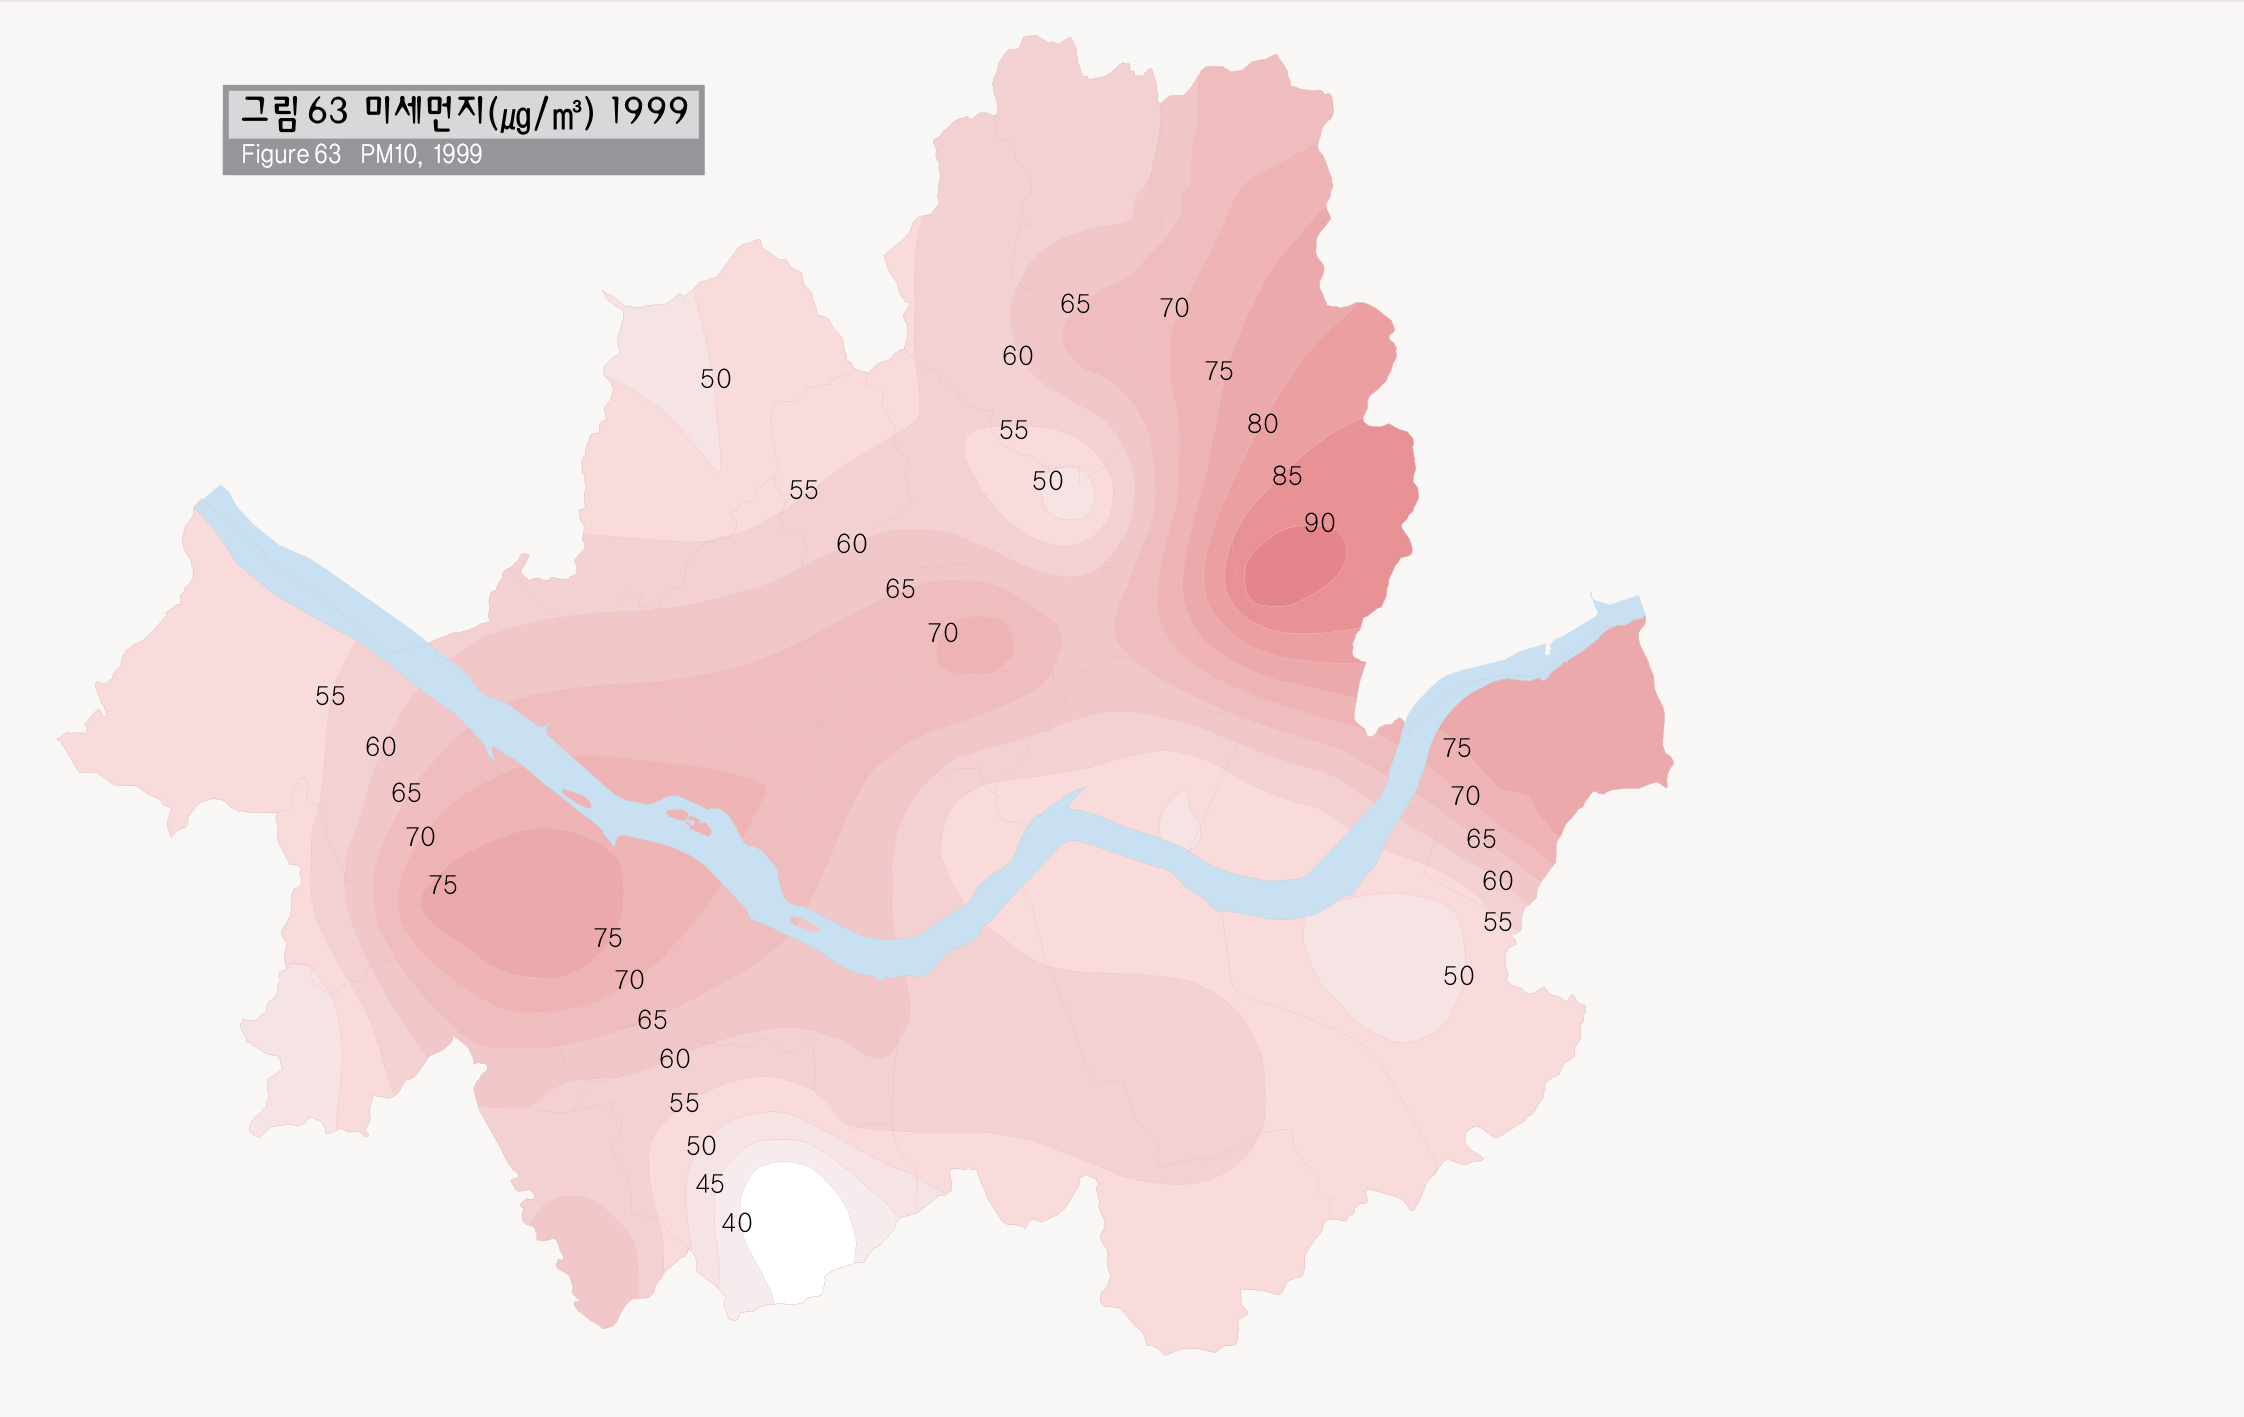
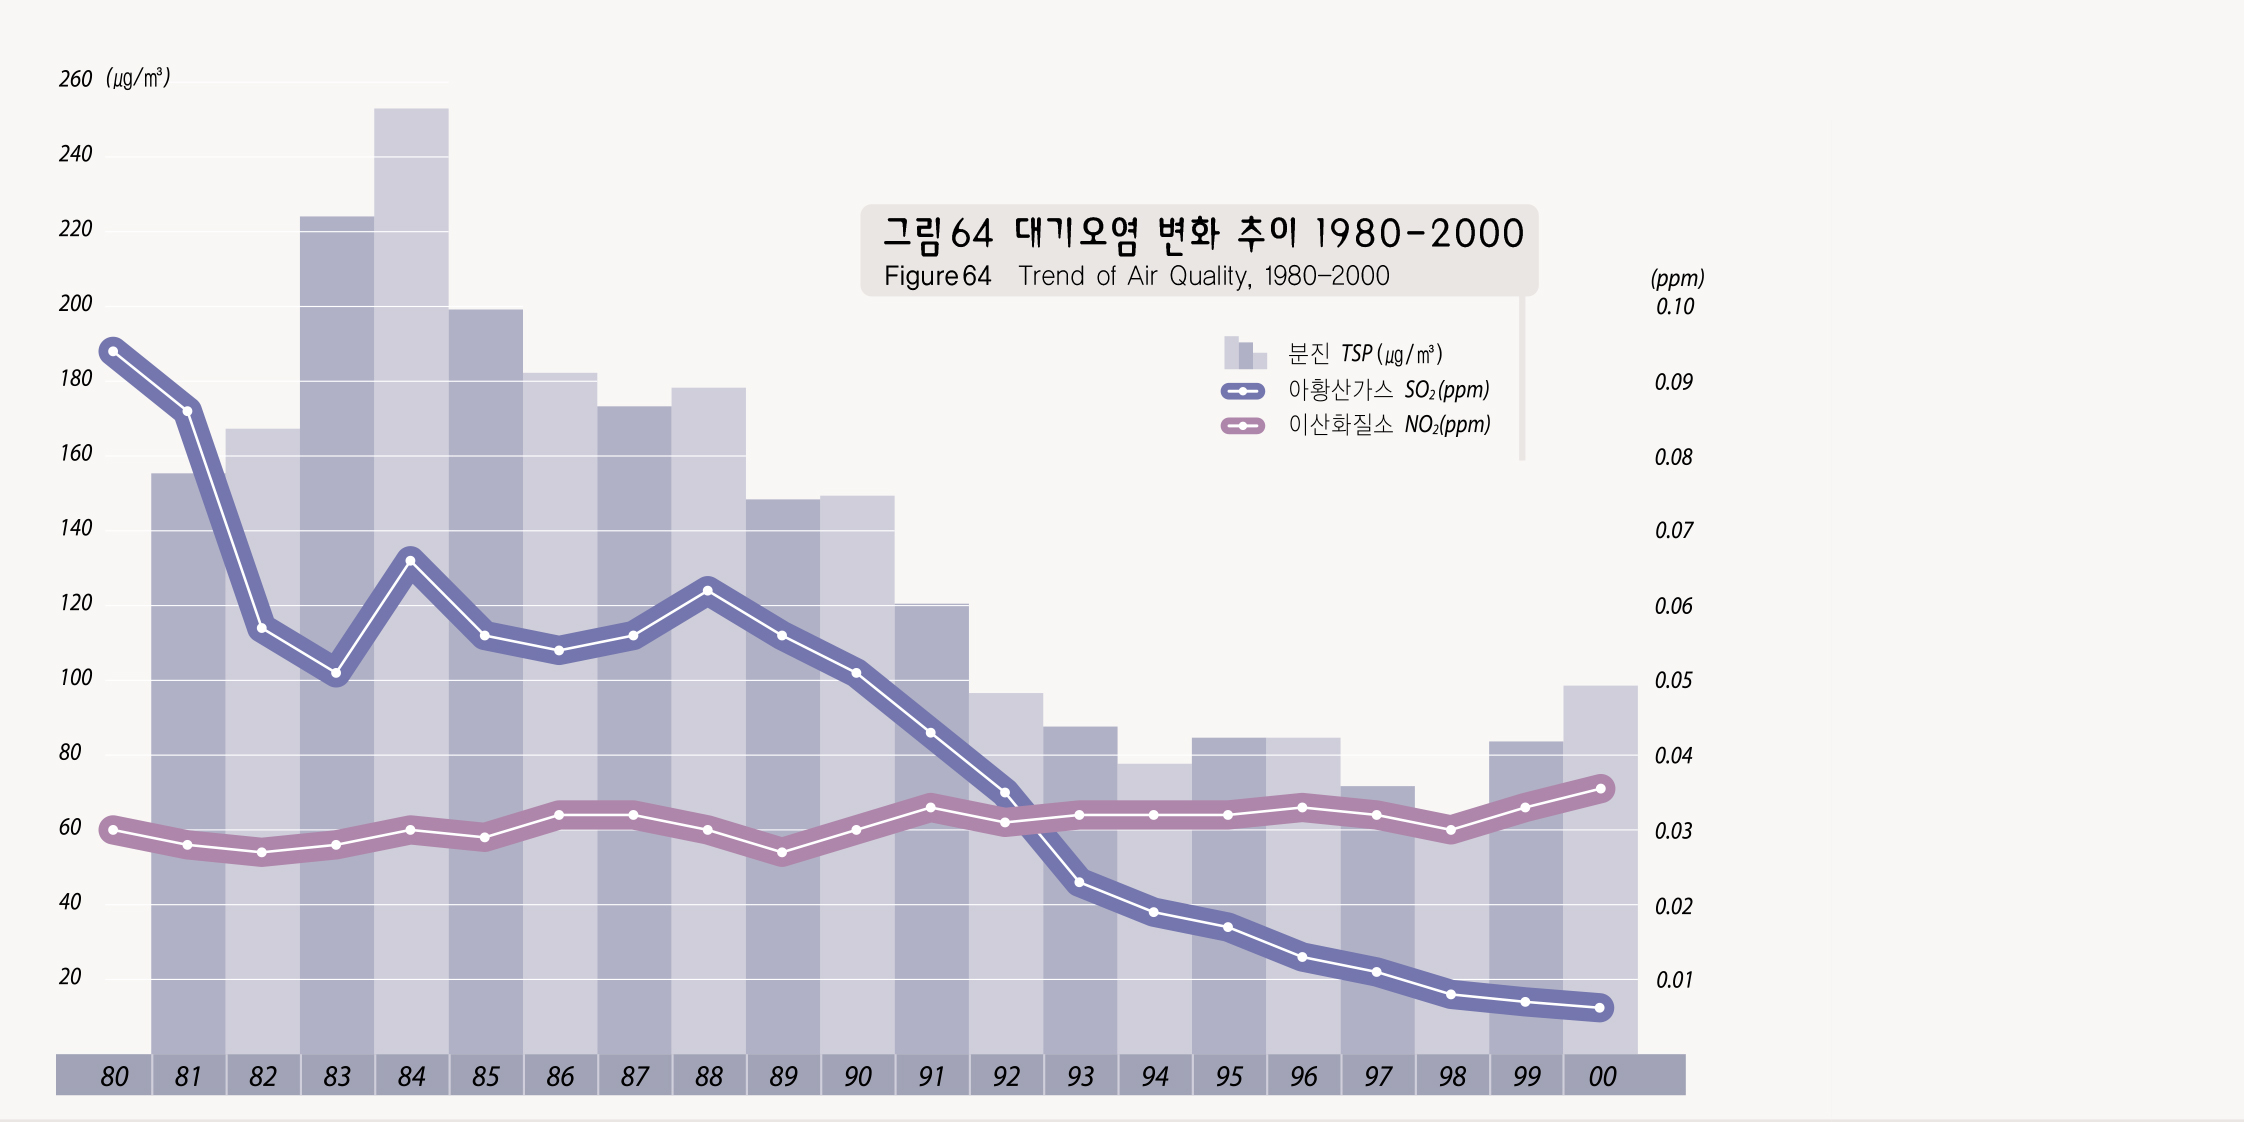
1980년 이후 서울의 이산화황 및 일산화탄소 대기오염도는 전반적으로 개선되고 있으나, 미세먼지(PM10)와 이산화질소 오염도는 그다지 개선되지 못하고 있는 실정이다. 특히 자동차 등에서 발생하는 입경 10μg이하의 미세먼지 오염도는 편서풍의 영향으로 동북권역에서 상대적으로 높게 나타나고 있다.
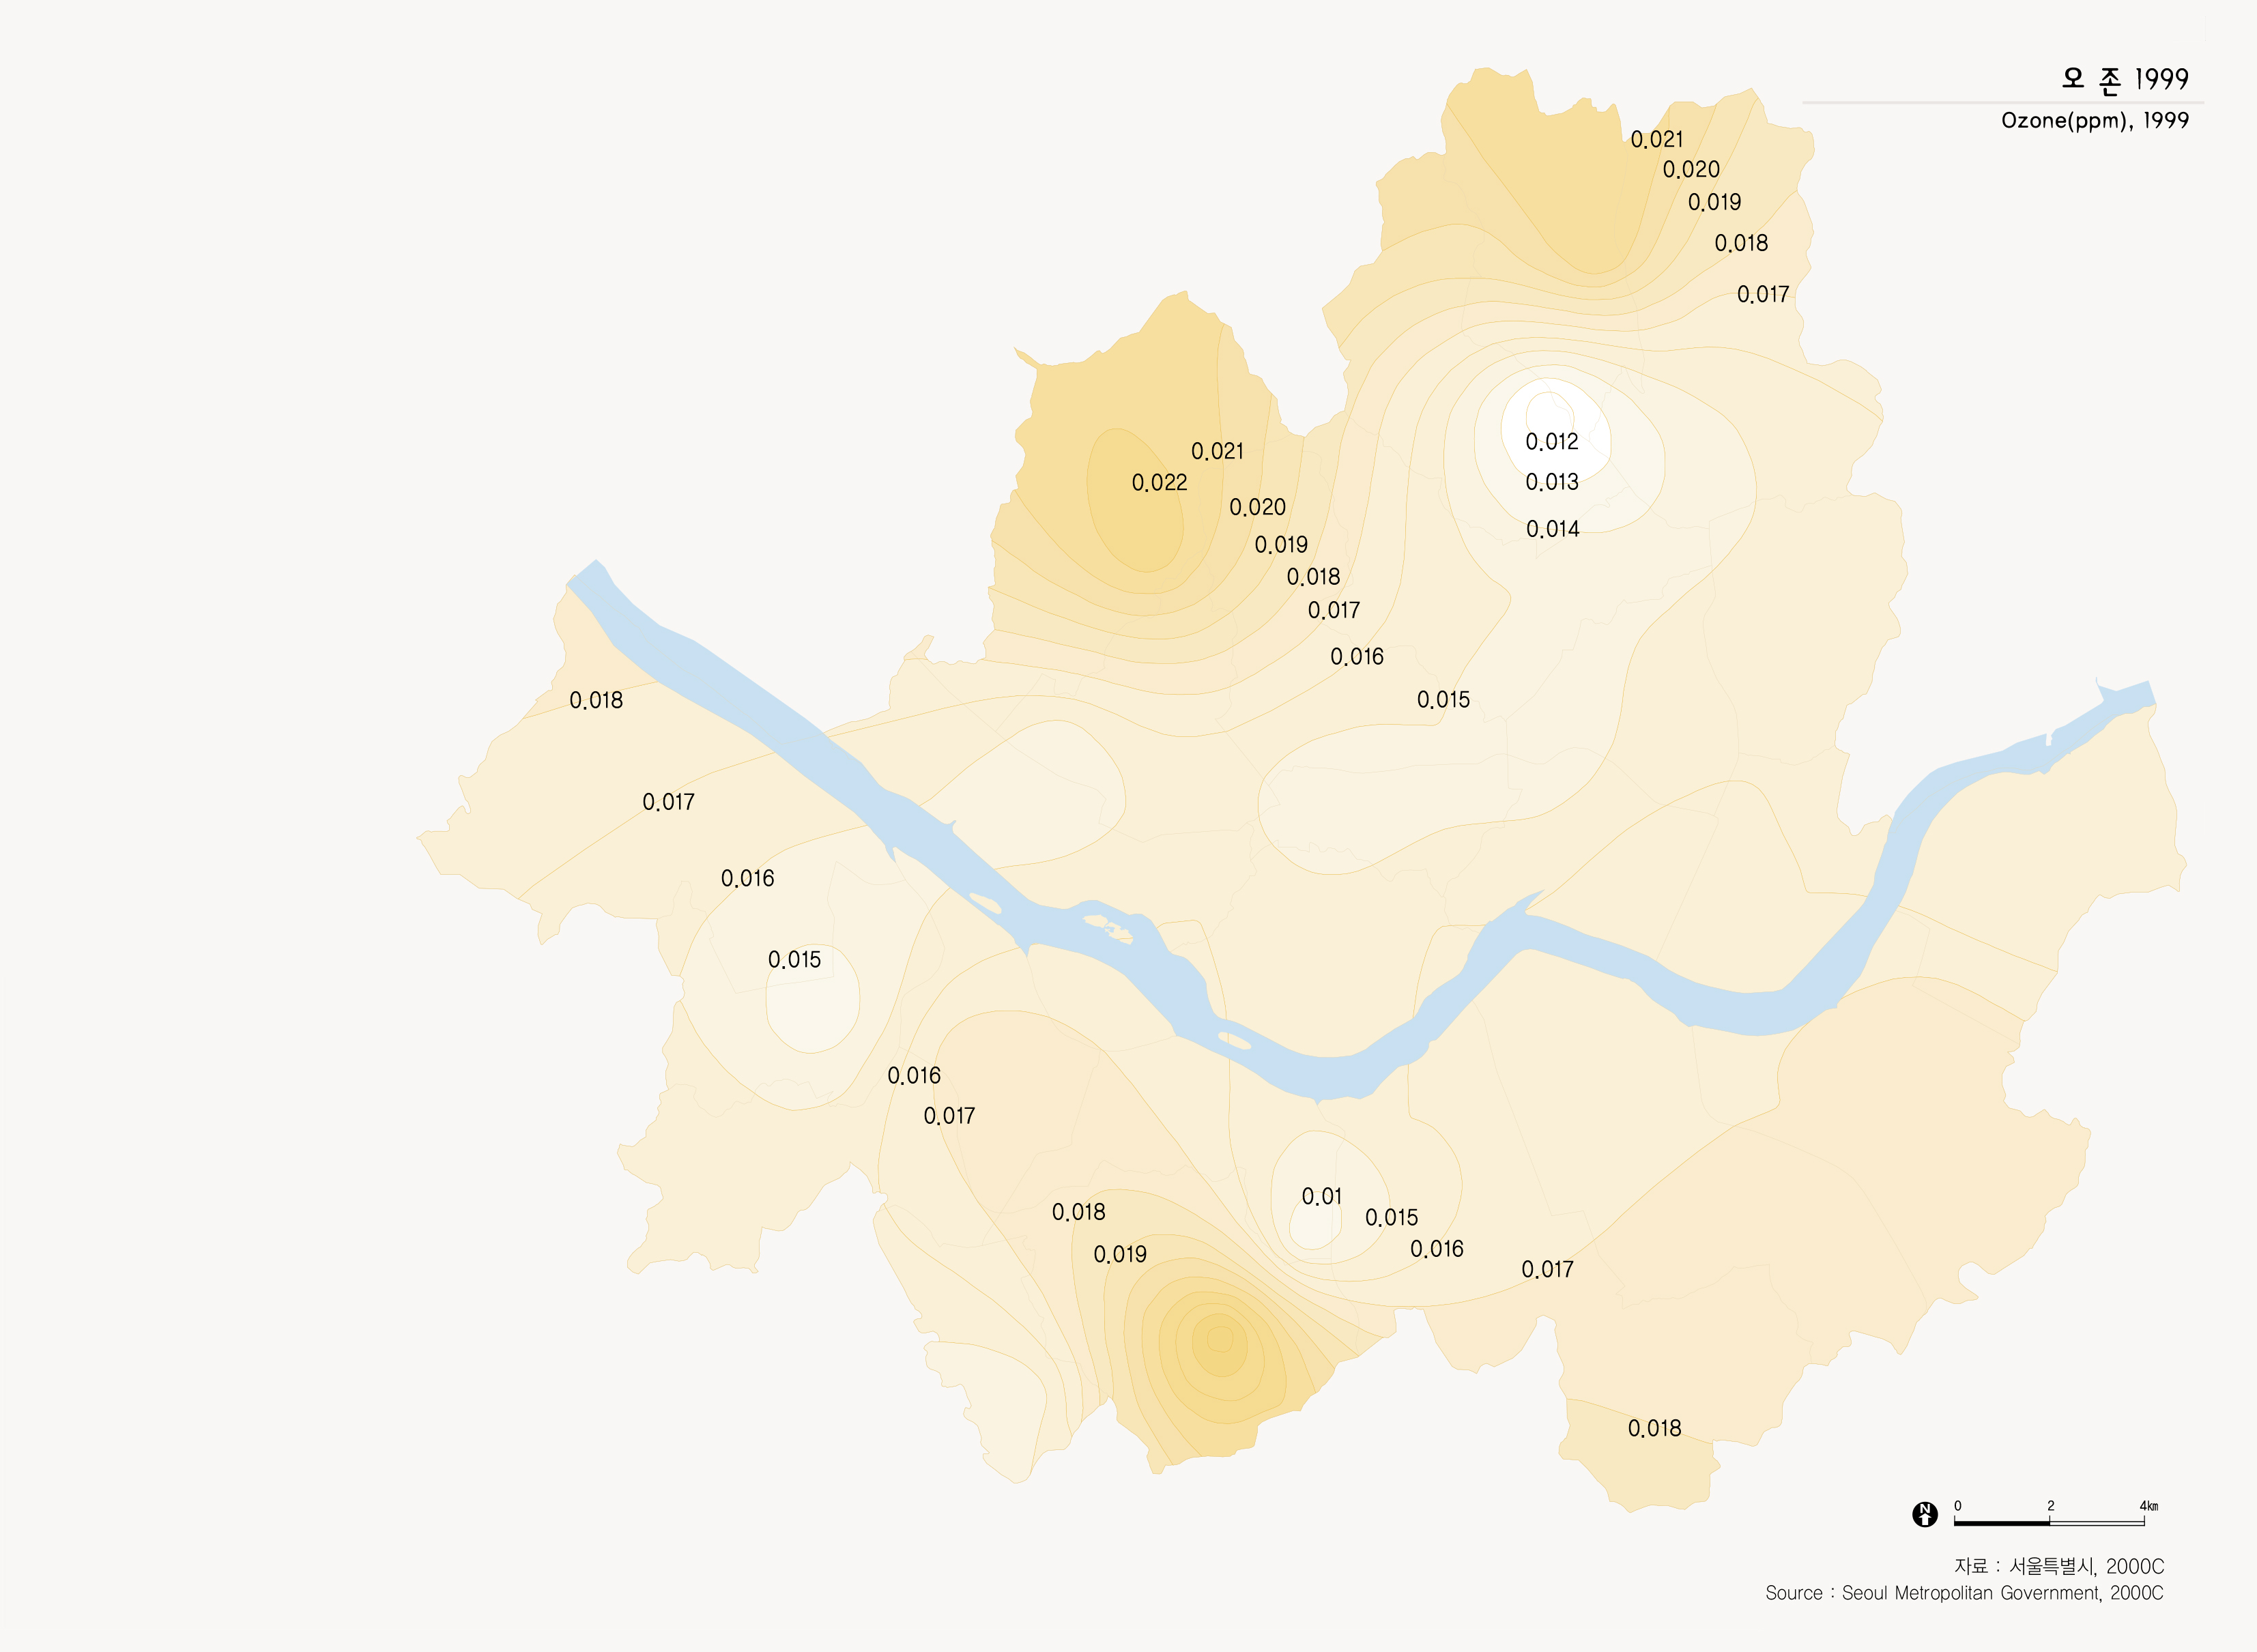
광화학 스모그현상인 오존오염도는 북부, 남부 산악지역과동북지역에서 상대적으로 높게 나타나는데, 산악지역의 오존오염은 식물 등의 광합성작용에 의한 자연배출원(VOC:휘발성유기화합물질)에 의한 것이며, 동북지역의 오존오염은 자동차 등 인위적 배출원의 2차합성에 의한 것이다.
Air Quality
Air pollution is measured by the density of sulfur dioxide(SO2), ozon(O3), nitrogen dioxide (NO2), dust(TSP, PM10), and carbon monoxide (CO) in the air.
Since 1980, the air pollution of sulfur dioxide and carbon monoxide improved on the whole, however, the pollution from dust (PM10) and nitrogen dioxide shows little improvement. In particular, exhaust from cars under the size of 10 μg is prevalent in northeast Asian region due to the westerly wind. Ozone pollution, a photochemistry smog phenomenon, tends to be higher in the north and south mountain regions and northeast region.
The ozone pollution in mountain regions is due to the volatile organic compound(VOC) from the photosynthesis action of plants and the ozone pollution in the northeast region of Seoul is the result of the 2nd synthesis of the pollution from cars and other vehicles.
출처 : 서울특별시, 2000C