-
주택유형
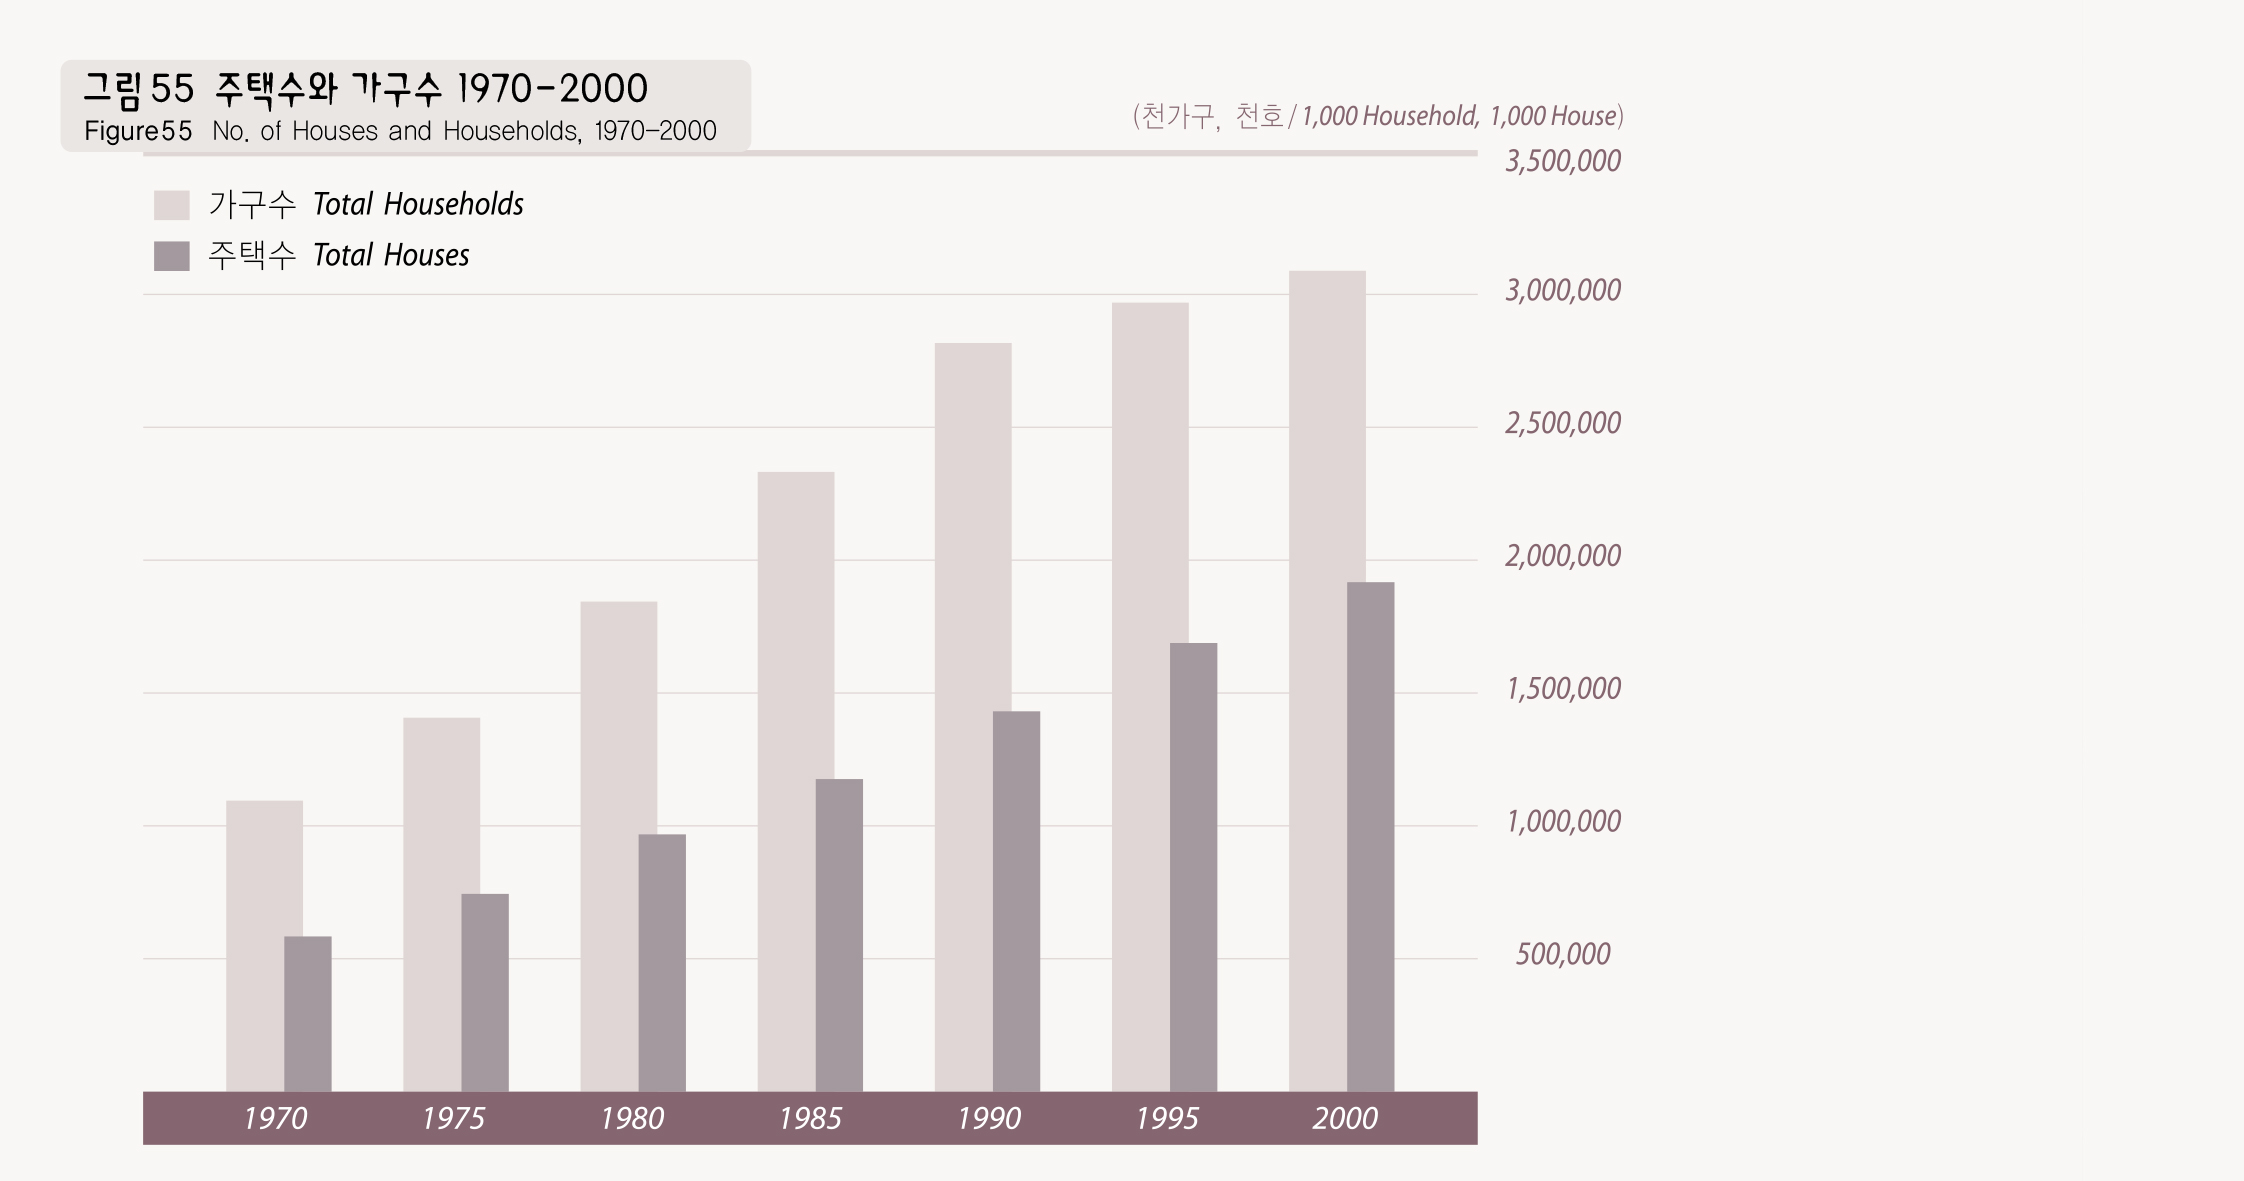
주택보급률
-
주택보급률
서울시의 주택보급률은 80년대 중반 58% 수준에서 2000년 현재 72%로서 지속적으로 올라가고 있다. 이는 특히 80년대 말 주택 200만호 공급정책, 재개발 활성화 및 다세대∙다가구∙연립주택 건립 활성화 등에 기인한다. 공간적 분포를 살펴보면 강남, 여의도 및 목동, 성북동, 상계동 등 자가가구 비율이 높은 곳이 주택보급률도 높게 나타나며, 관악구, 영등포구, 성동구 지역에서 주택보급률이 낮게 나타나는데 이는 전∙월세가 우세한 지역과 유사한 분포를 나타낸다. 주택수의 계속적 증가와 수치로 나타나는 주택보급률의 계속적 증가에도 불구하고 실질적으로 자기 집에서 살고 있는 비율은 계속 감소하고 있는데 이는 높은 주택가격으로 내집 장만이 어렵기도 하지만 내집이 있어도 직장이나 자녀교육 문제로 이사를 자주하기 때문이다.
Tenure Type
The housing supply ratio of Seoul has increased from 58% in the mid 1980s to 72% in 2000 and is still increasing. It was due in particular to the 2 million-house construction policy in late 1980s and increased construction of multi-households houses, tenement houses and redevelopment of old housing areas. In terms of spatial distribution, Gangnam, Yeouido, Mok-dong, Seongbuk-dong, Sanggye-dong show a high rate of housing supply and private owned houses, while Gwanak-gu, Yeongdeungpo-gu, Songdong-gu regions show lower housing supply ratio which more or less duplicates the areas of rented houses on a deposit basis or monthly payment basis. Despite the increasing number of houses and housing supply rates, the percentage of people living in their privately owned houses decreased. It is because high housing prices denies ordinary people from the ownership of a house and even those who own their houses frequently change their residences for children's education or to be close to work.

출처 : 통계청, 인구주택총조사잠정보고서 2000