-
산업활동과 재정
사업체종사자수
-
사업체 종사자
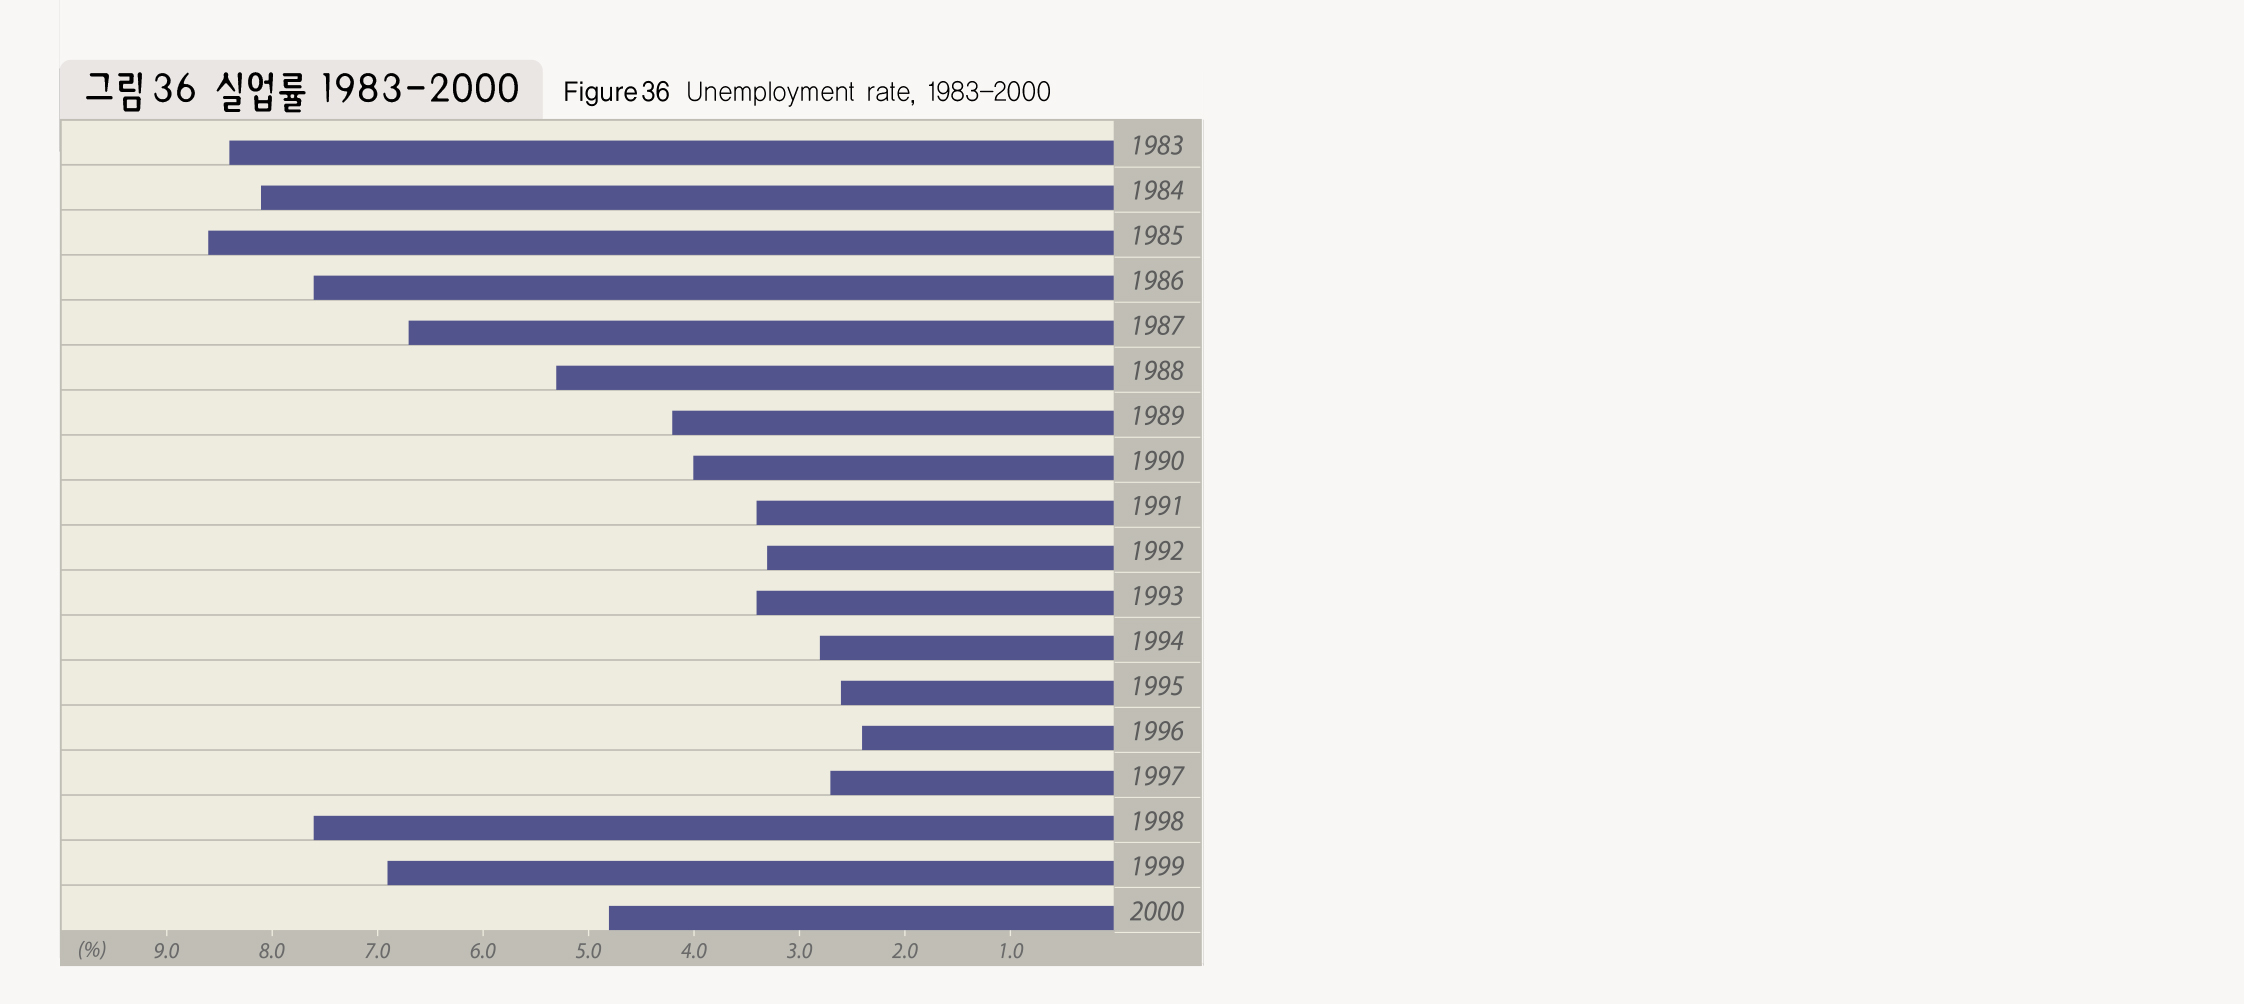
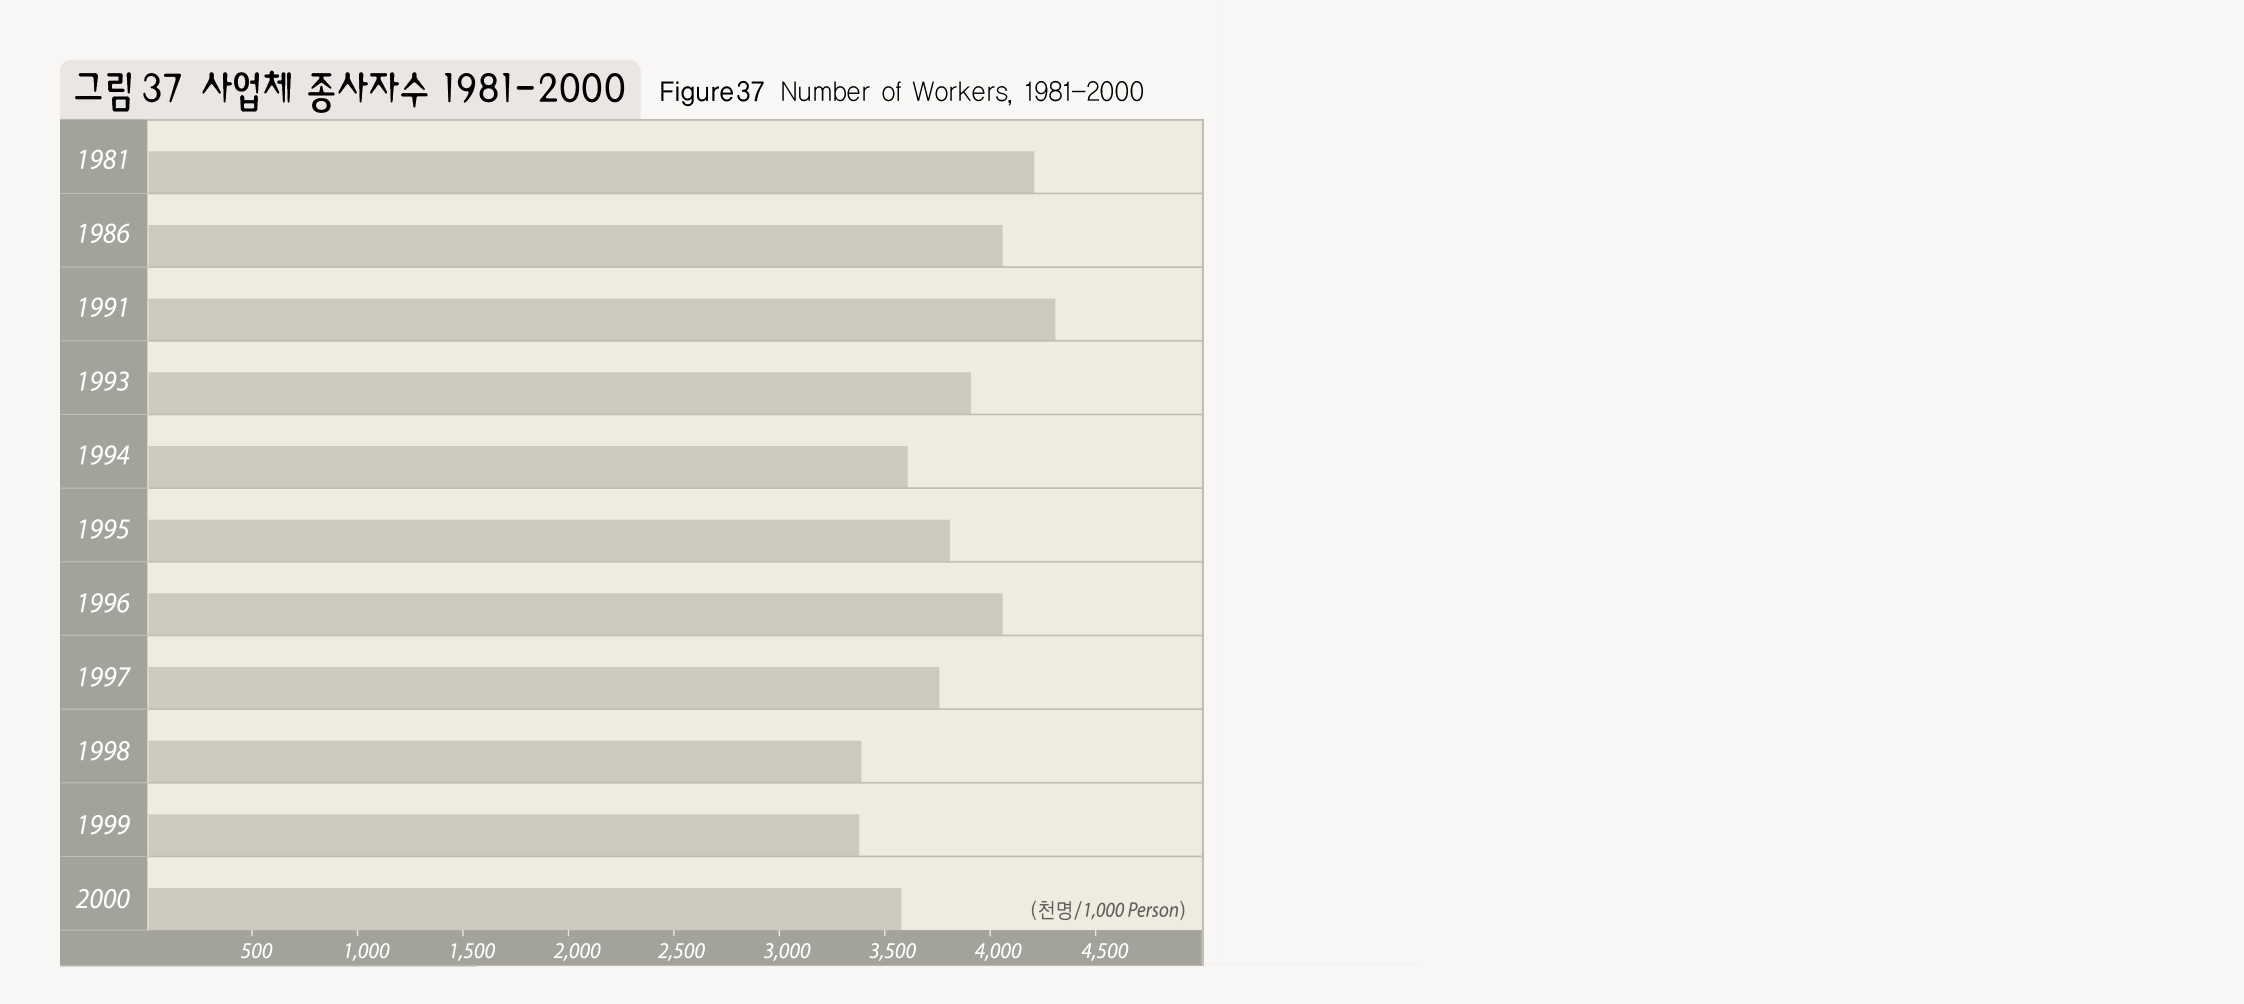
사업체에 종사하고 있는 종사자 수는 1981년 238만명에서 2000년 376만명으로, 1996년 406만명을 정점으로 감소고 있다. 1996년 이후 종사자의 감소는 IMF이후 실직자의 증가에 따른 것으로, 실업률 자료에서도 알 수 있듯이 80년대 초 8%정도의 실업율에서 1996년 실업율은 2%대로 낮아졌다가 IMF이후 다시 8%수준까지 증가하고 있다.
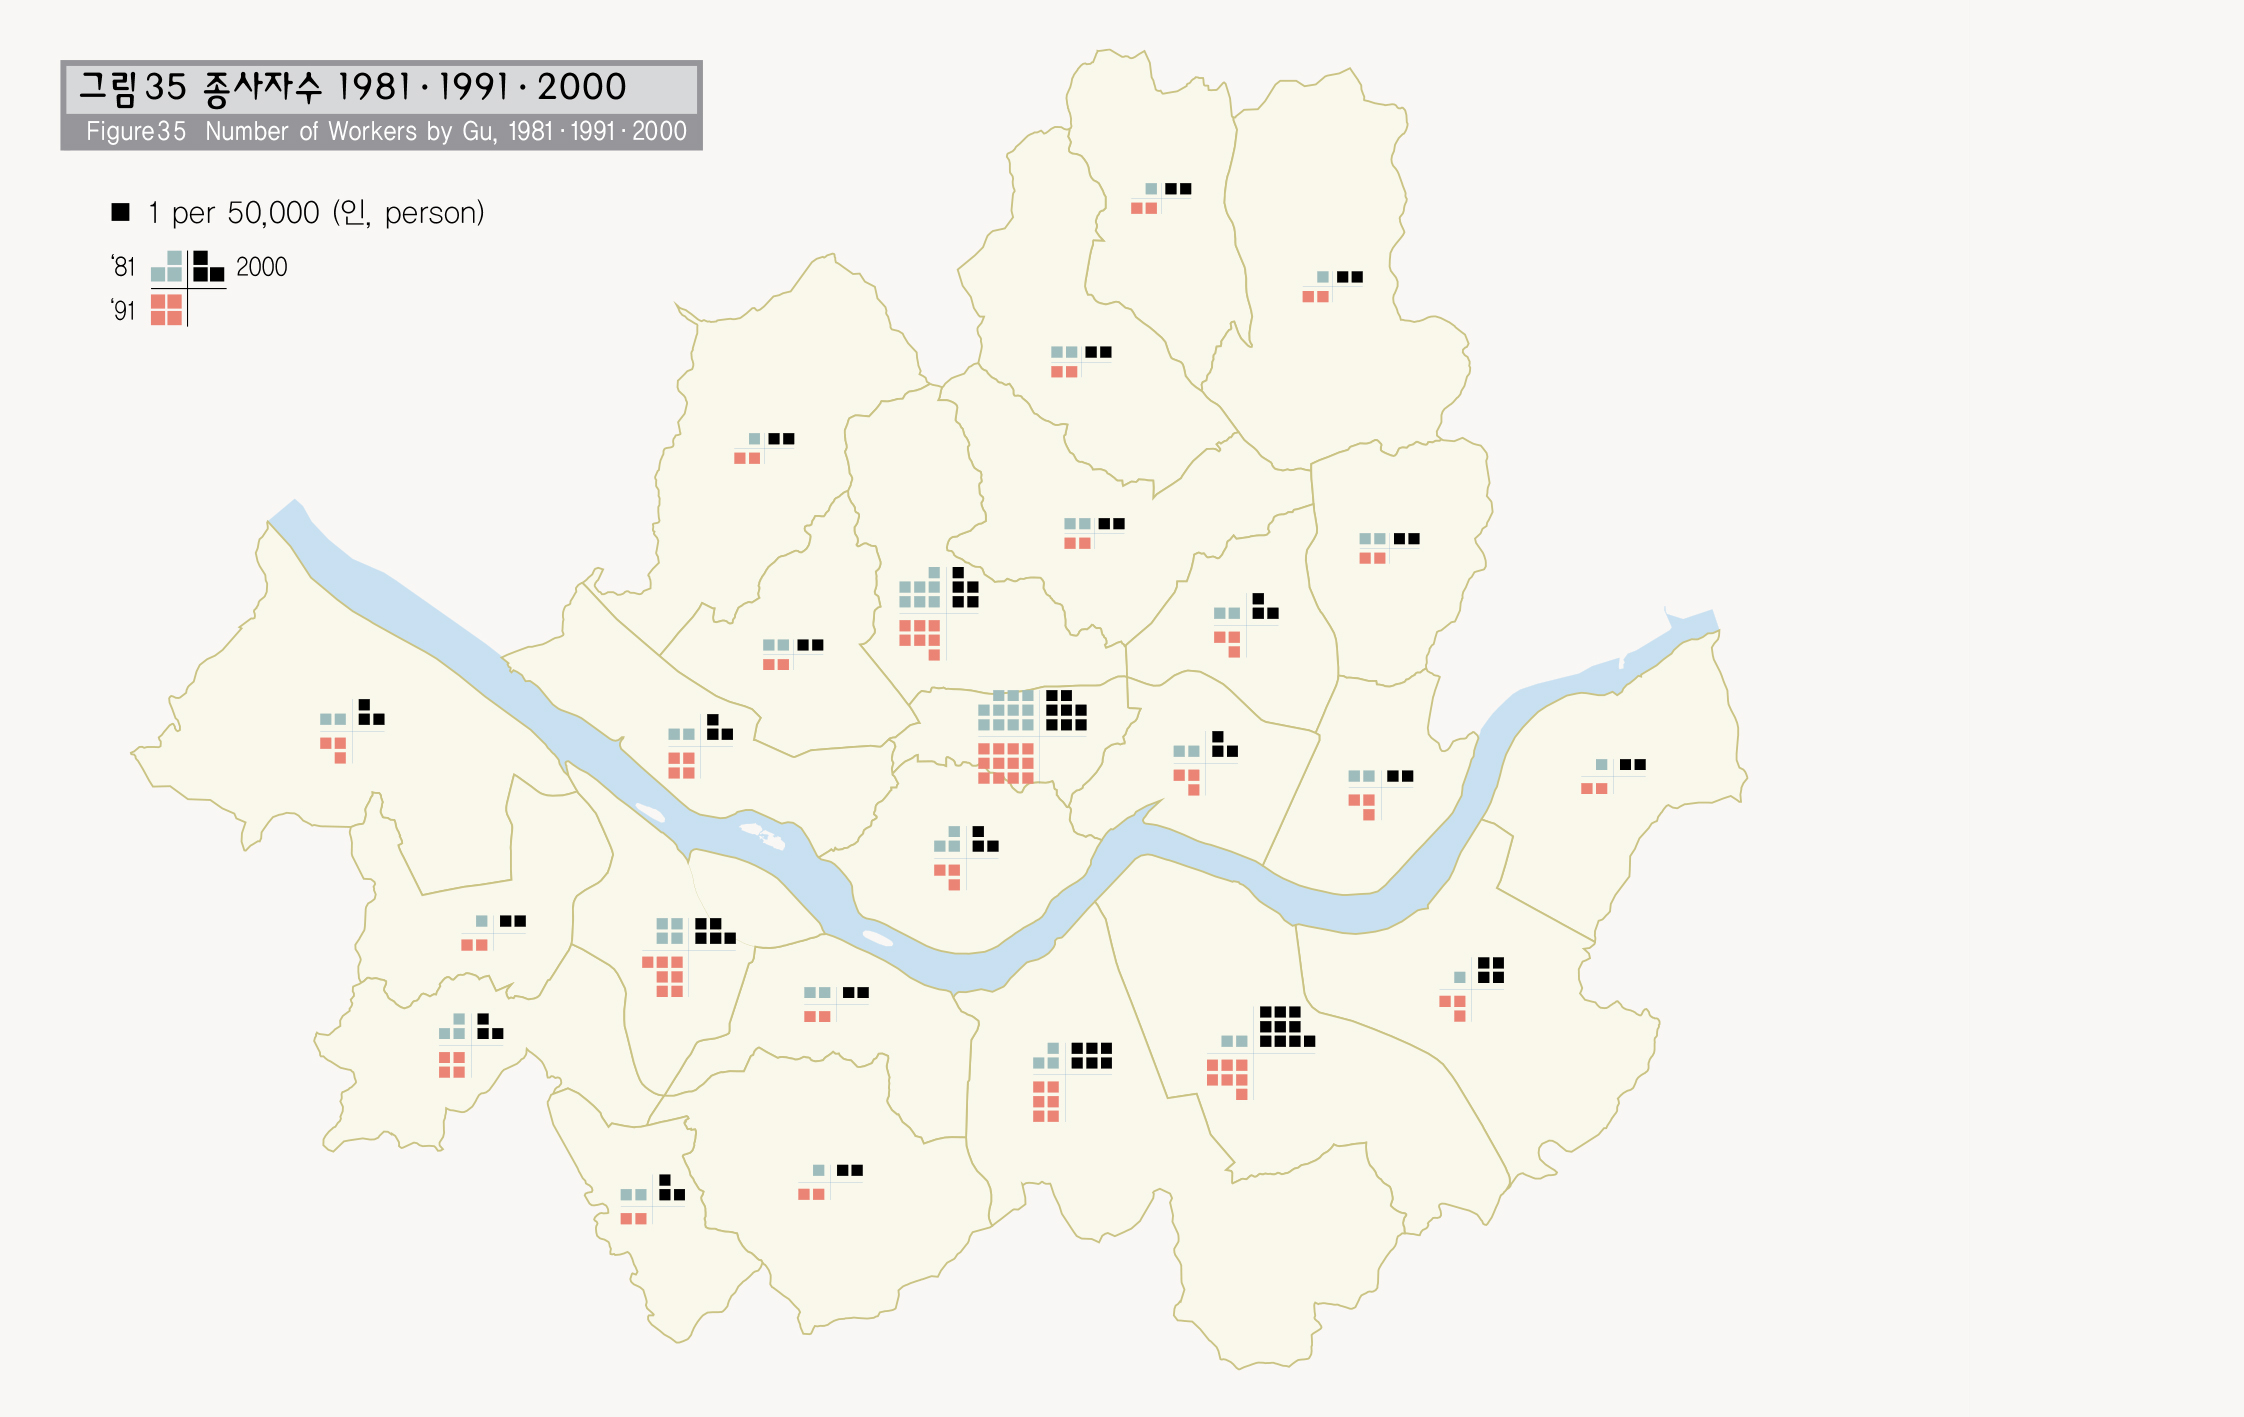
종사자수의 분포를 살펴보면 서울의 대표적인 업무 생산활동 지역인 중구, 종로구, 영등포구에서 종사자 수가 많으며, 90년대 들어 서초, 강남지역의 종사자 수가 급격히 증가하고 있다. 각 지역별 인구대비 사업체 종사자 비율을 보아도 종로, 중구, 영등포, 서초, 강남지역에서 높게 나타나며, 특히 도심 일부지역에서는 상주인구 대비 종사자율이 500%를 넘고 있다.
Employees
The number of employees increased from 2.38 milion in 1981 to 3.76milion in 2000 and with 1996 when the number of employees reached 4.06 million as a turning point it is on the decrease. The decrease after 1996 reflects the increased unemployment rate after the so called IMF financial crisis. As shown in the statistics, the unemployed stood at 8% in early 1980s, down to 2% in 1996, and shot back up to 8% after the financial crisis.
Composition of employees shows that the majority of employees are in the re-presentative business districts of Seoul such as Jung-gu, Jongno-gu, and Yeongdeungpo-gu and since the 1990s, the number of employees have grown sharply in Seocho-gu and Gangnam-gu. The ratio of employees against total population by region also shows high in Jongno-gu, Jung-gu, Yeongdeungpo-gu, Seocho, and Gangnam and some downtown areas with over 500%.

출처 : 통계청, 사업체 기초통계조사 보고서 2000