-
인구
총부양비
-
총부양비
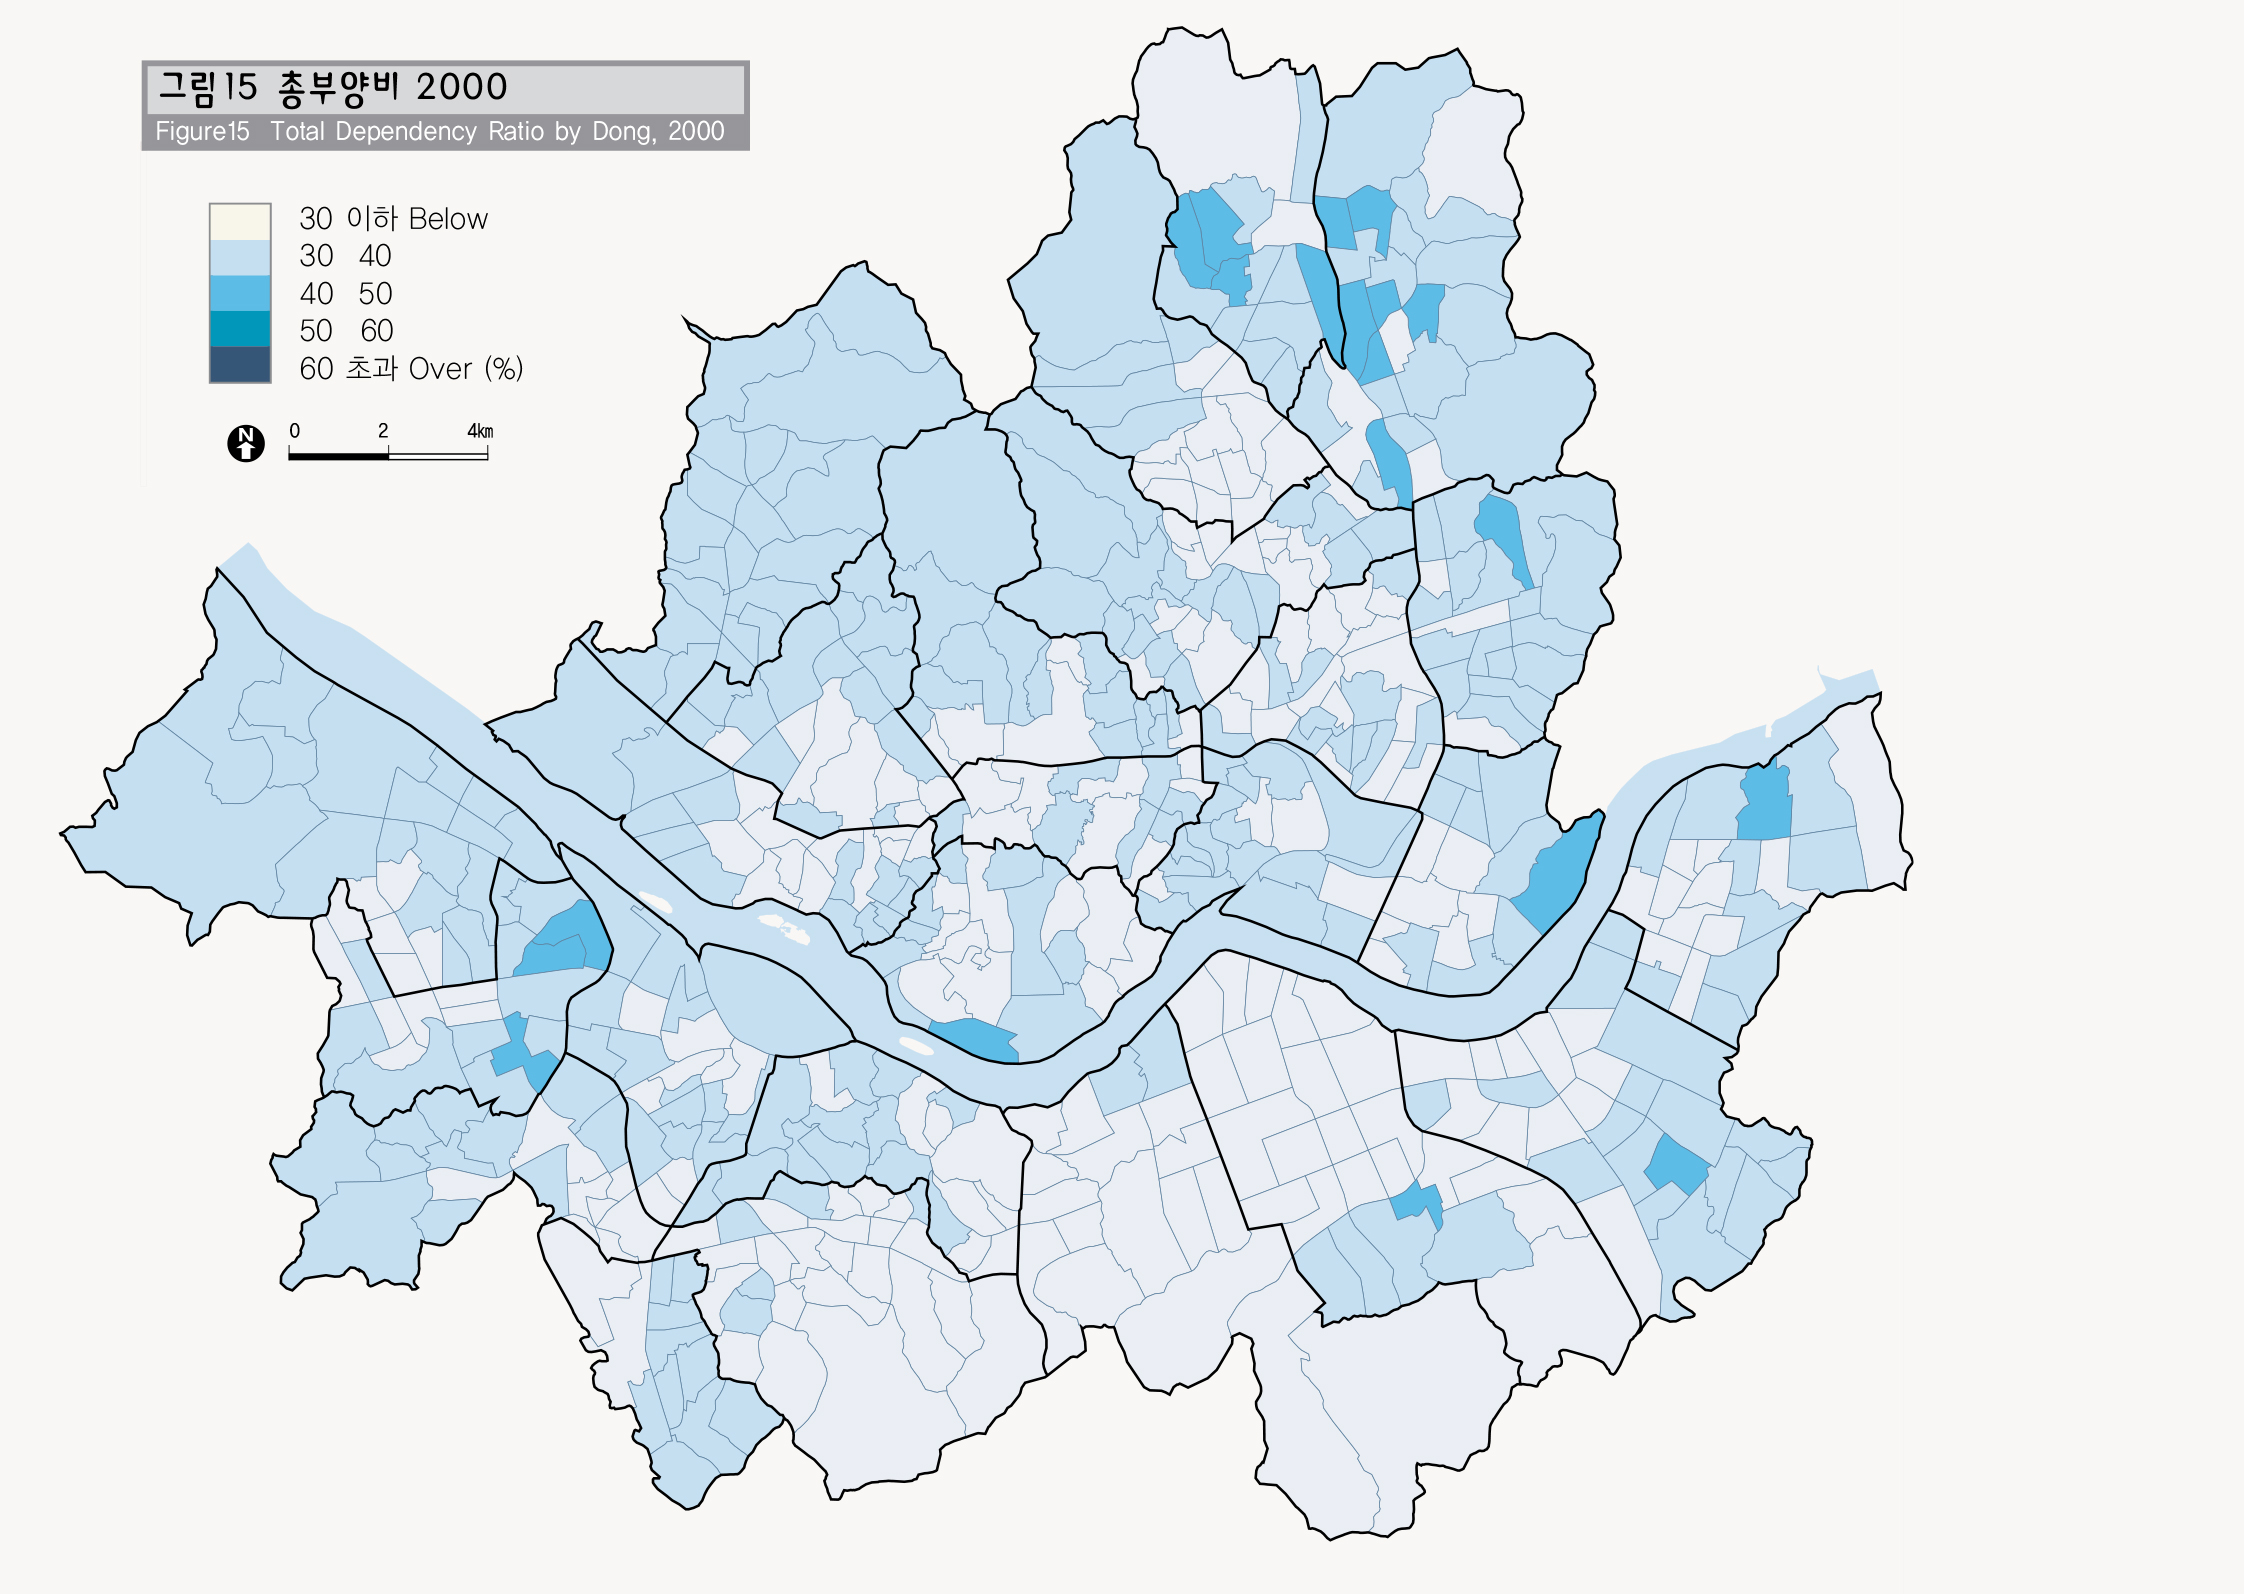
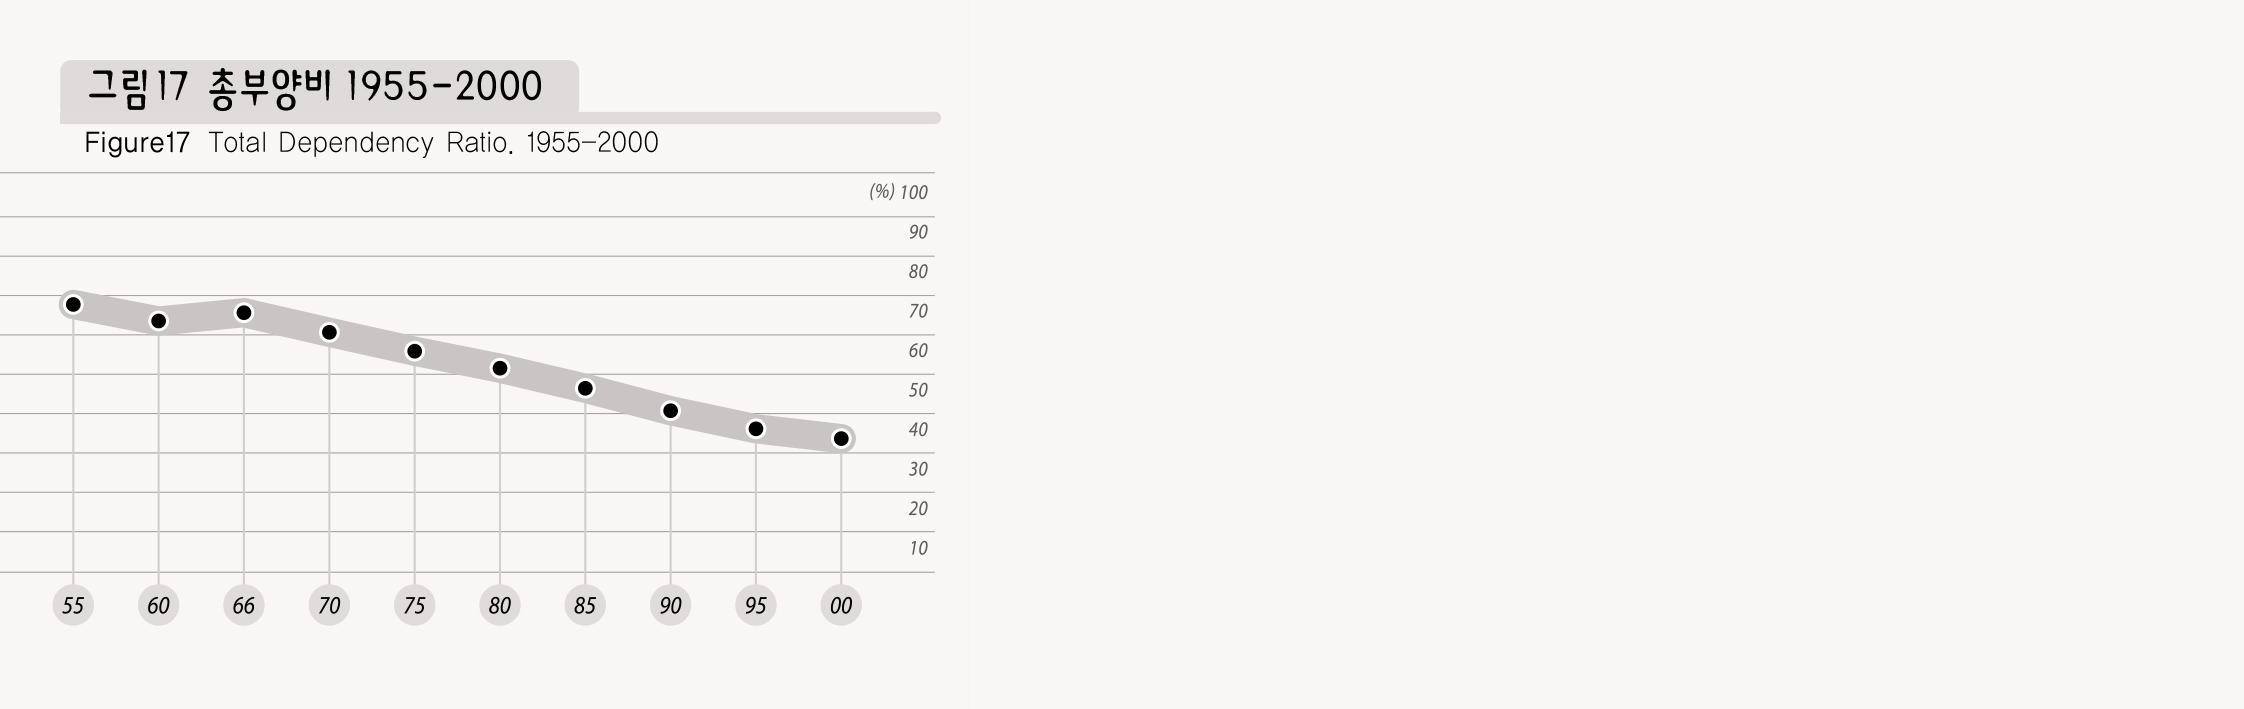
총부양비는 15세~64세 인구 대비 노년층과 청소년층 인구의 비로서, 경제활동 가능인구가 부양해야 할 인구의 비율을 나타낸다. 총부양비에 영향을 주는 주요 요인은 노년층과 청소년층 인구인데, 노년층 인구는 지속적으로 증가하나, 청소년층 인구는 결혼연령 증가와 출산율 저하 등으로 감소하며, 청소년층 감소율이 노년층 인구 증가율을 추월하여 전체적인 총부양비 1960년 67.9에서 2000년 31.6으로 지속적으로 감소하고 있다. 전체적인 총부양비는 감소하나, 총부양비의 공간적 분포패턴을 보면 신개발지역이나 재개발, 재건축이 일어난 곳에서는 총부양비가 급격히 높게 나타나는데 이는 신개발지역에는 대부분 결혼 후 유아 또는 청소년층 자녀를 갖는 가구가 유입되어 상대적으로 총부양비가 높게 나타나는 것으로 분석된다.
Total Dependency Ratio
Total dependency ratio refers to a ratio of the elderly and the youth against a total population age between 15~64 years old. It tells us a population ratio that the young people who are capable of economic activities should support. Total dependency ratio is mainly subject to the population of the elderly and the youth. According to statistics, the elderly continue to increase while the youth population decreases due to the increased marriage age and lower birth rate, and finally a decreased rate of youth exceeded population increases of the elderly, bringing the total dependency ratio down from 67.9 in 1960 to 31.6 in the year 2,000.
Despite the overall decrease of total dependency ratio, the spatial distribution of total dependency ratio varies. Newly developed areas or redevelopment and reconstruction areas show high total dependency ratio because young couples with babies or children or the adolescent comprise the majority of the population of the newly developed areas.
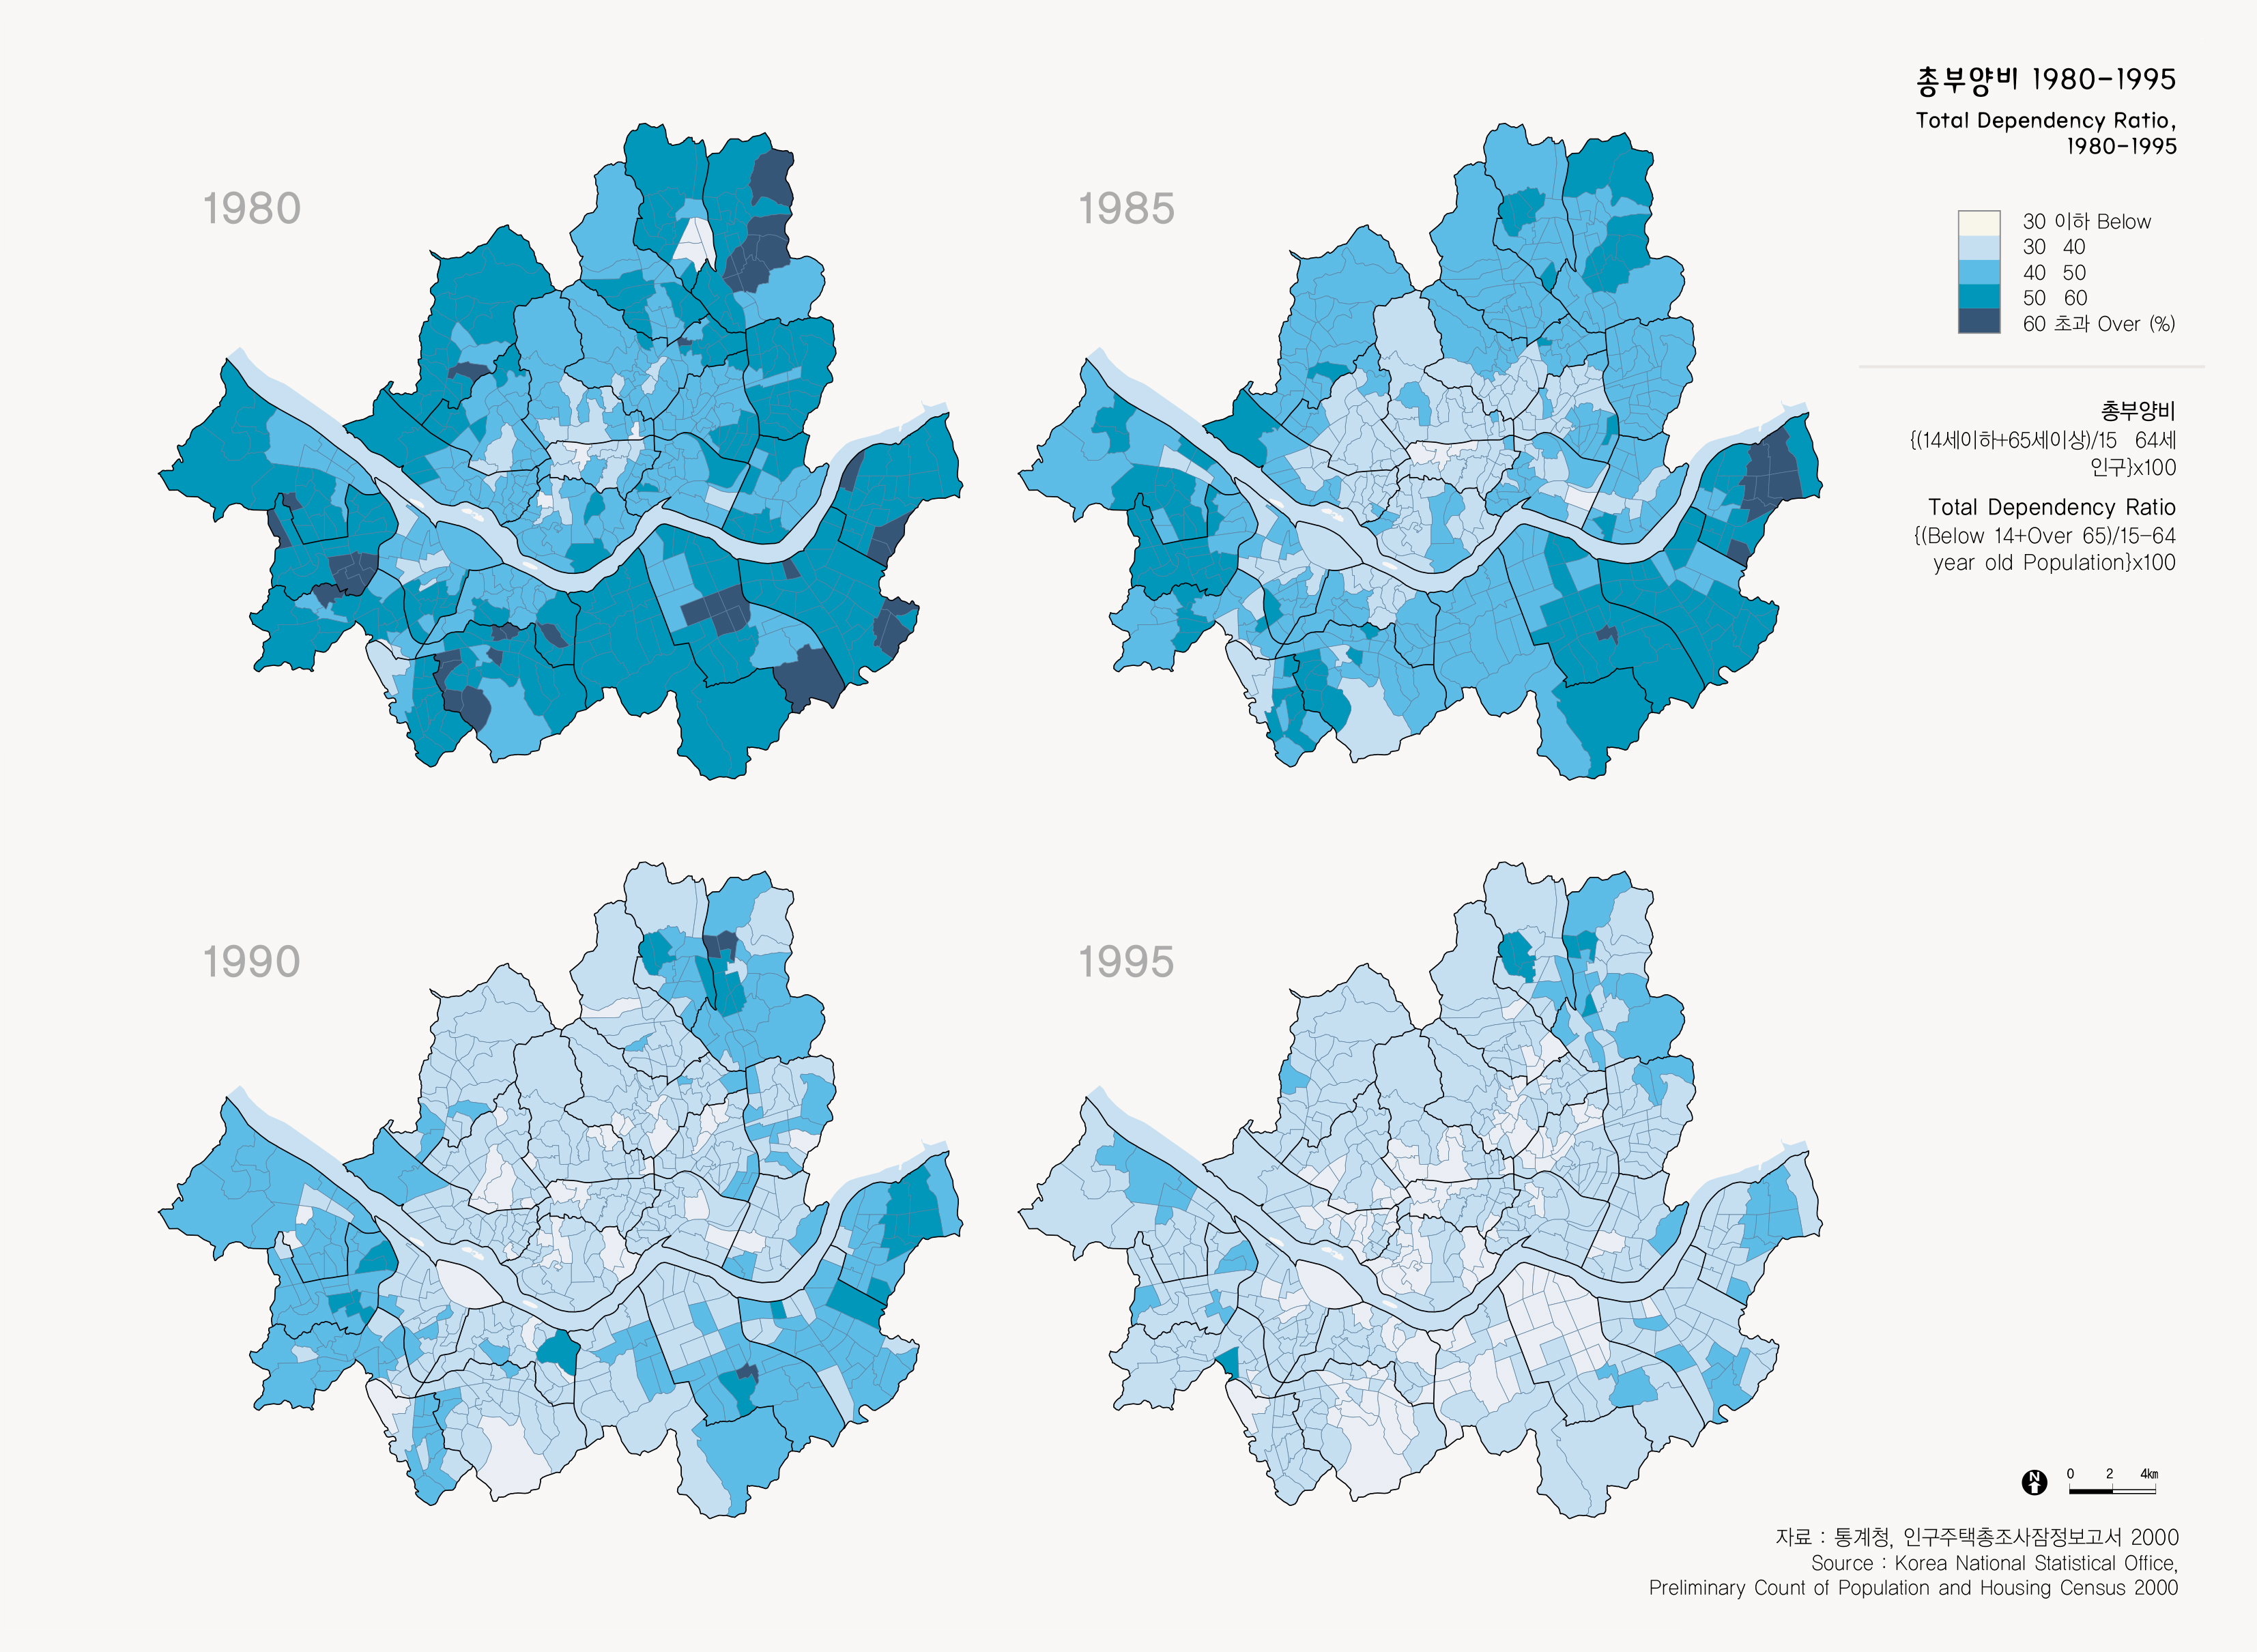
출처 : 통계청, 인구주택총조사잠정보고서 2000