-
인구
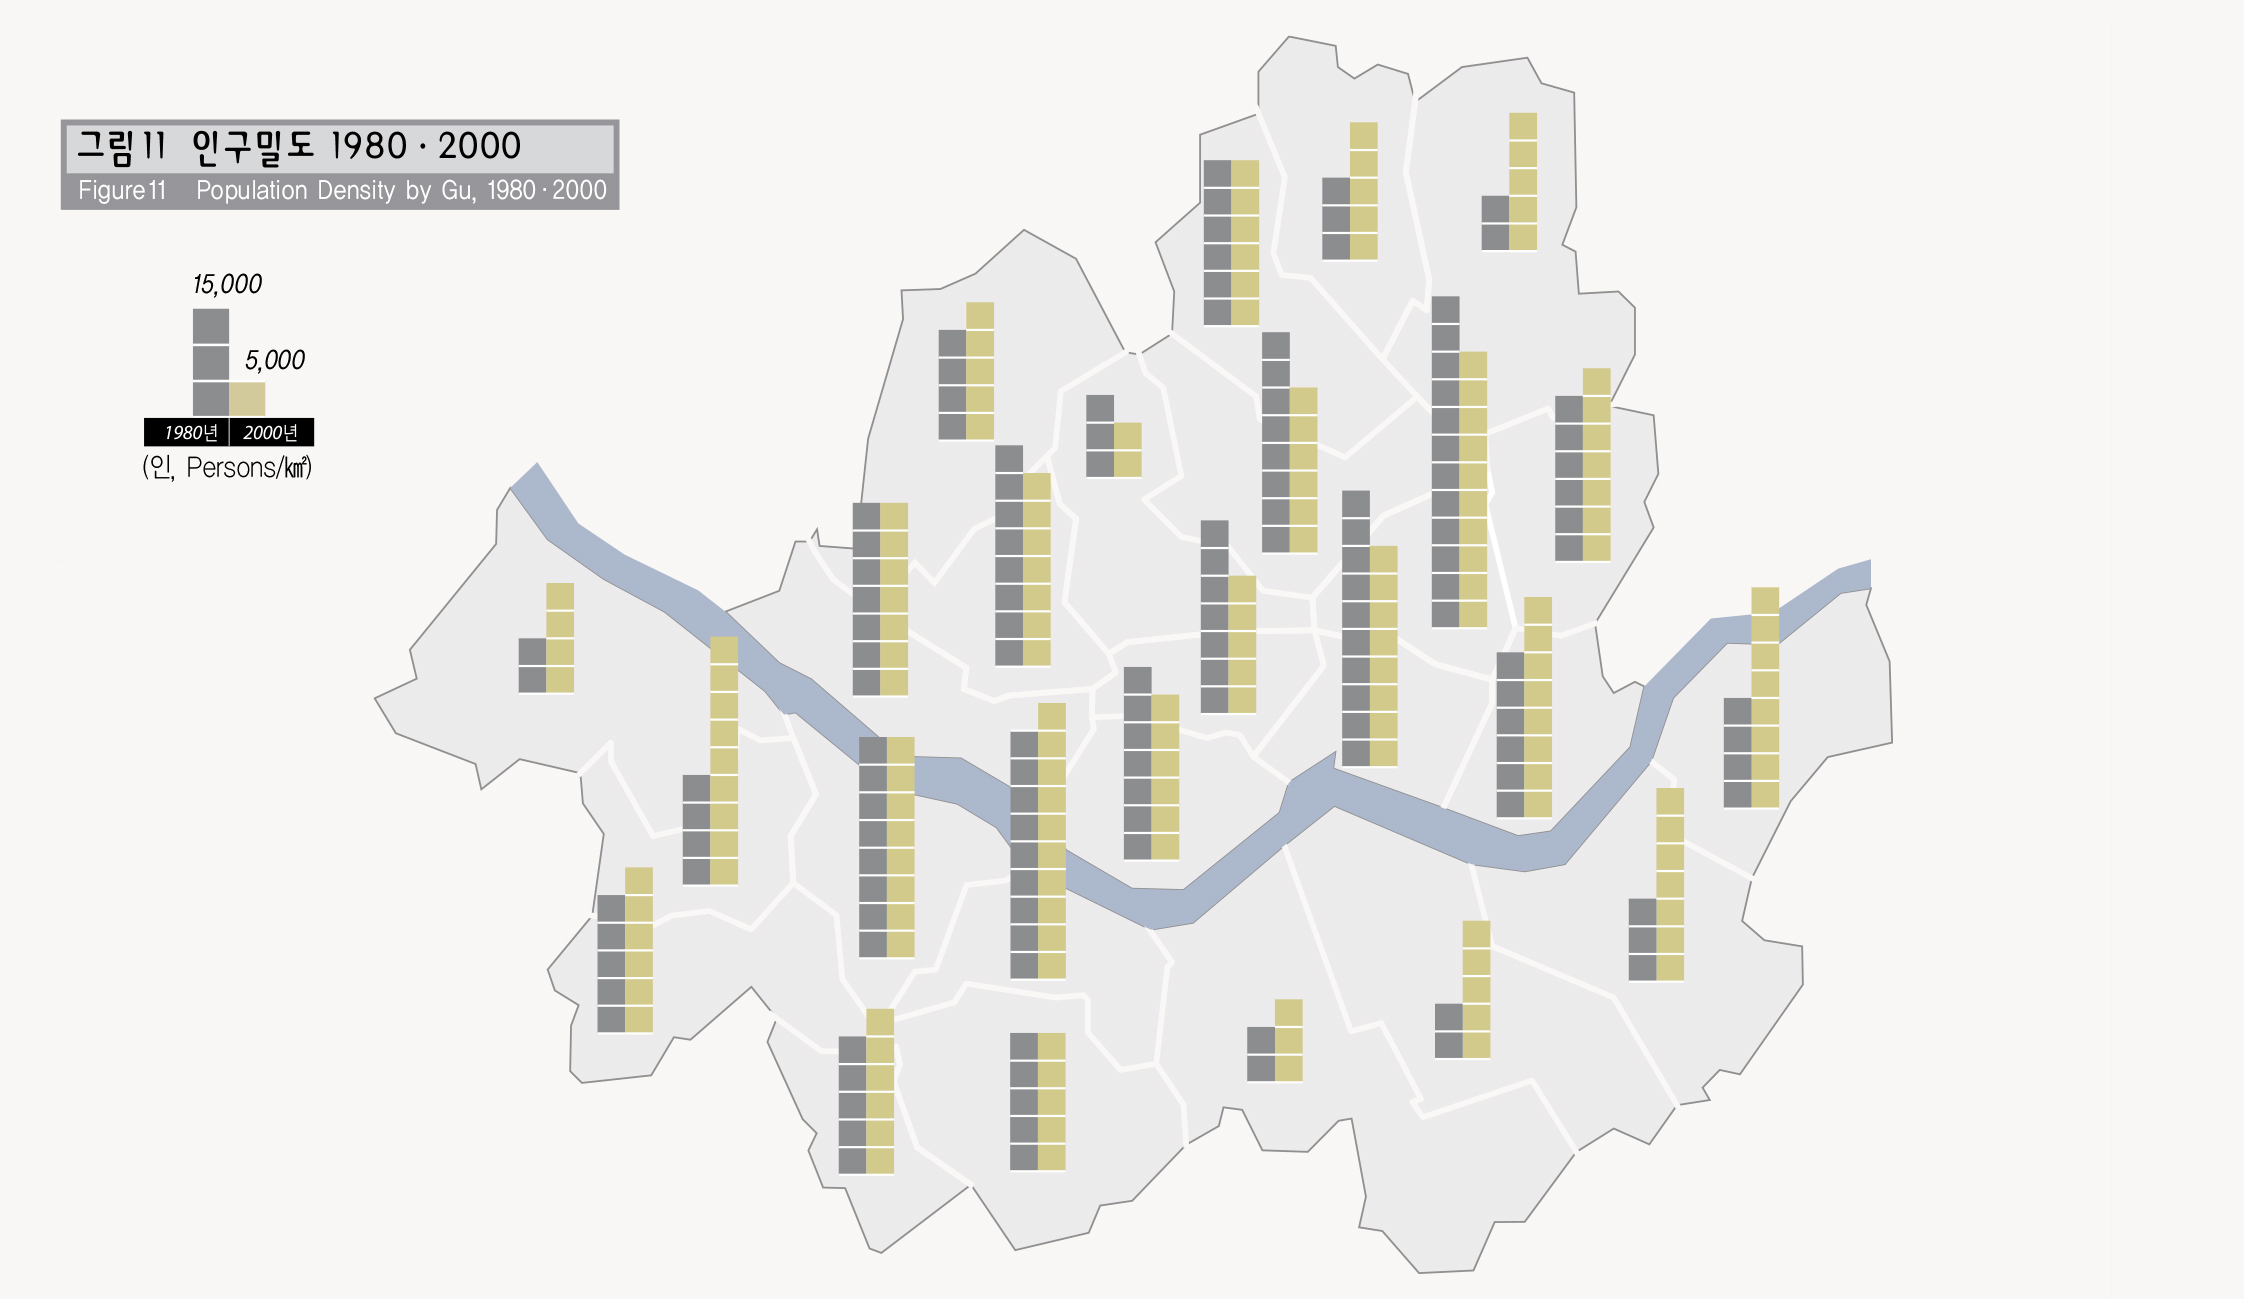
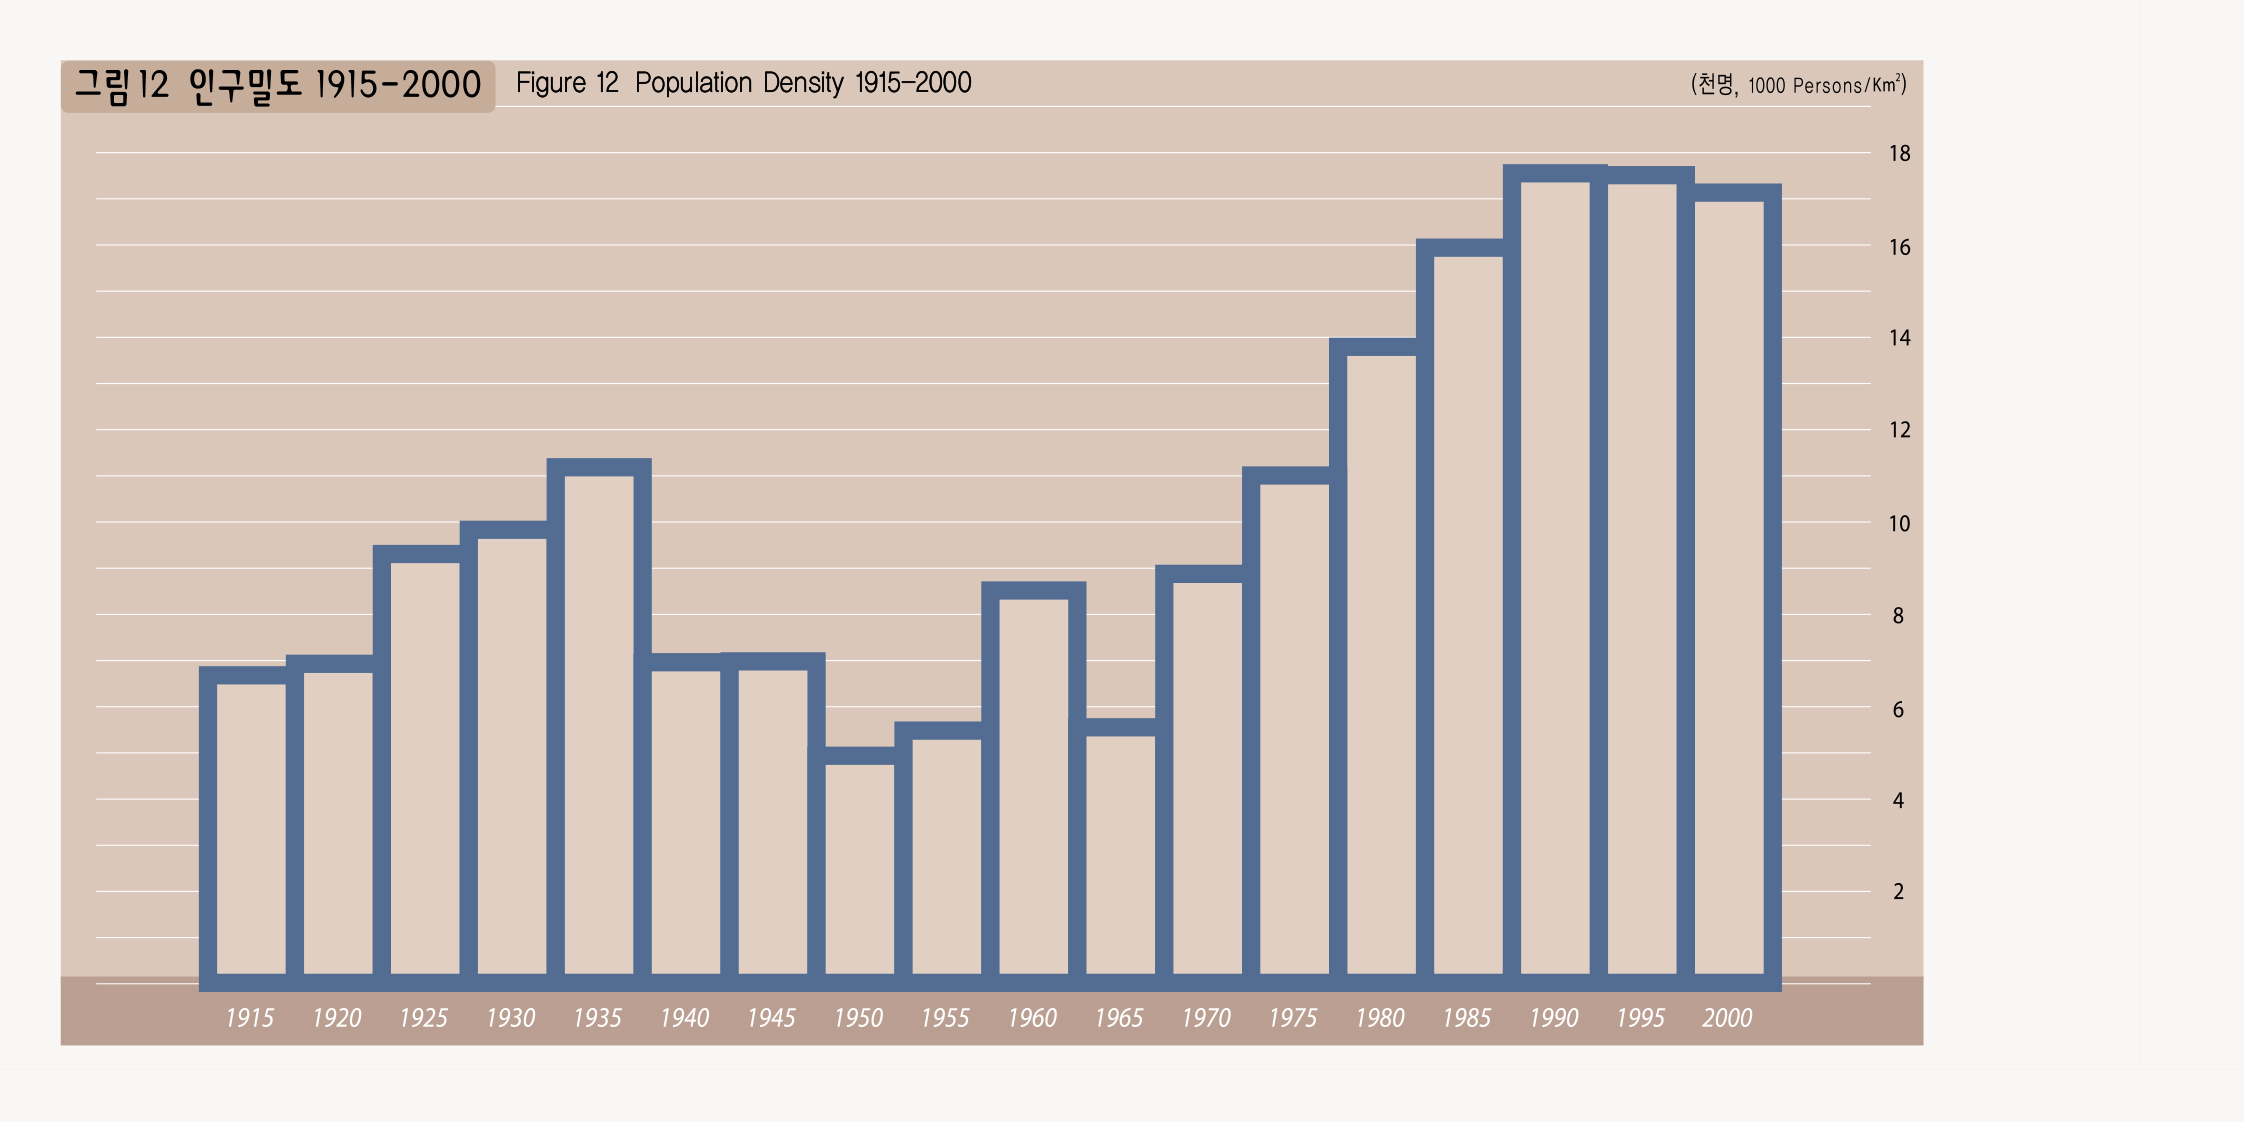
인구밀도
-
인구밀도
서울의 인구밀도는 1936년과 1962년 행정구역 확장에 의한 인구밀도 감소를 제외하고 1990년까지 지속적인 증가를 보이다가 1990년 이후 감소추세를 보이고 있다.
인구밀도는 지역적으로 다양하여 도심지역은 상업기능으로의 전환에 의한 도심공동화, 외곽지역은 개발제한구역 설정에 의한 영향으로 인구밀도가 낮게 나타나고 있으며, 고밀도 지역은 연속적으로 나타나지 않고 군집현상을 나타내고 있다.
이러한 인구밀도의 공간적 다양성은 서울의 성장ㅁ과정에서 택지개발과 주택공급정책, 버스 및 지하철 등 대중교통 수단의 보급 등 여러 가지 요소들이 결합되어 나타난 결과라 할 수 있다.
Population Density
Population densities of Seoul showed a continued growth up until 1990, except for a decrease following the administrative district expansion in 1936 and 1962, and with 1990 as a turning point; it is on a decreasing trend.
Population density varies respective of regions. For example, downtown areas and the outer-ring of Seoul show a low population density; downtown areas due to 'downtown vacuumization' following the areas became strictly commercial and outer-ring regions due to the 'green belt' restricted development zoning. On the other hand, high-density regions appear to not be linear but grow in spots.
Such spatial variety in population density is a result of combined housing and land development, housing construction-expediting policies, expansion of public transportations such as bus and subways in the course of Seoul’s growth.

출처 : 서울특별시, 서울통계연보 2000