
-
Housing
Residential Conditions of Seoul Citizens
-
1. General Conditions
1.1. Occupancy Type
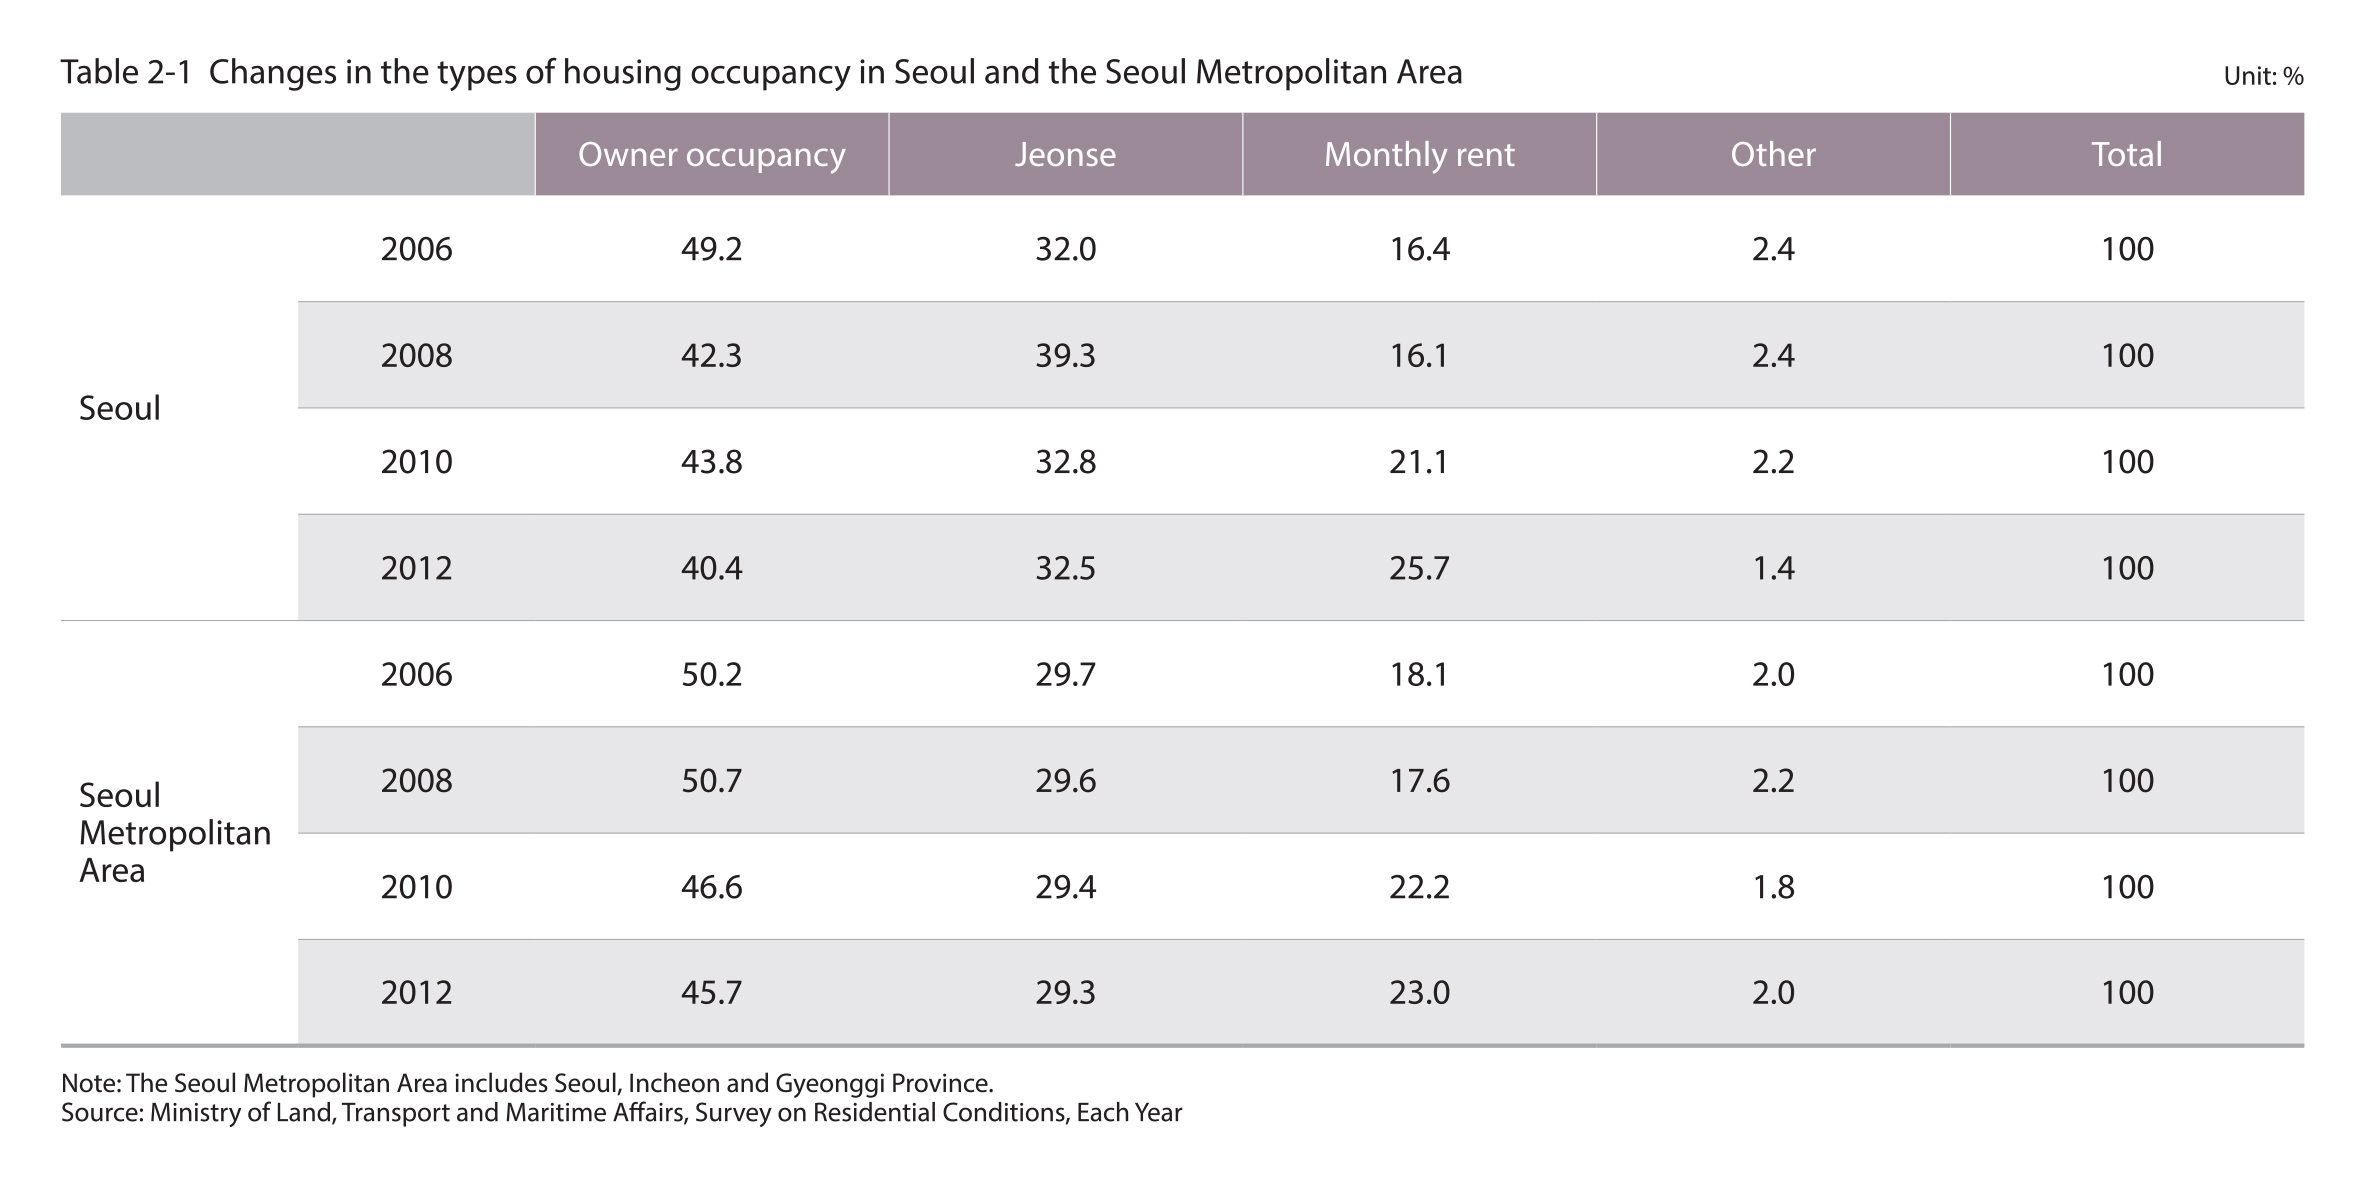
Occupancy by home owner (40.4%) has been decreasing, and there has been reduced availability of Jeonse and increased availability of monthly rentals
As of 2012, the most common type of housing occupancy in Seoul is home ownership, accounting for 40.4%, followed by Jeonse at 32.5% and monthly rental at 25.7%. Between 2006 and 2012, the proportion of owner occupancy in Seoul decreased from 49.2% to 40.4%, while the proportion of monthly rental occupancy increased from 16% to 26%. As of 2012, one out of every four household in Seoul was paying monthly rent.
In the case of the Seoul Metropolitan Area (Seoul, Incheon and Gyeonggi Province), 46% of all housing occupation is owner occupancy, 29% is Jeonse and 23% is monthly rental as of 2012. The proportion of owner occupancy is higher than that of Seoul and those of Jeonse and monthly rental are relatively lower. The proportion of owner occupancy declined and monthly rental occupancy rate increased compared to 2006, and this is somewhat simiIar to the trends observed in Seoul.
Source : Ministry of Land, Transport and Maritime Affairs, Survey on Residentlial Conditions, Each Year
1.2. Housing Size
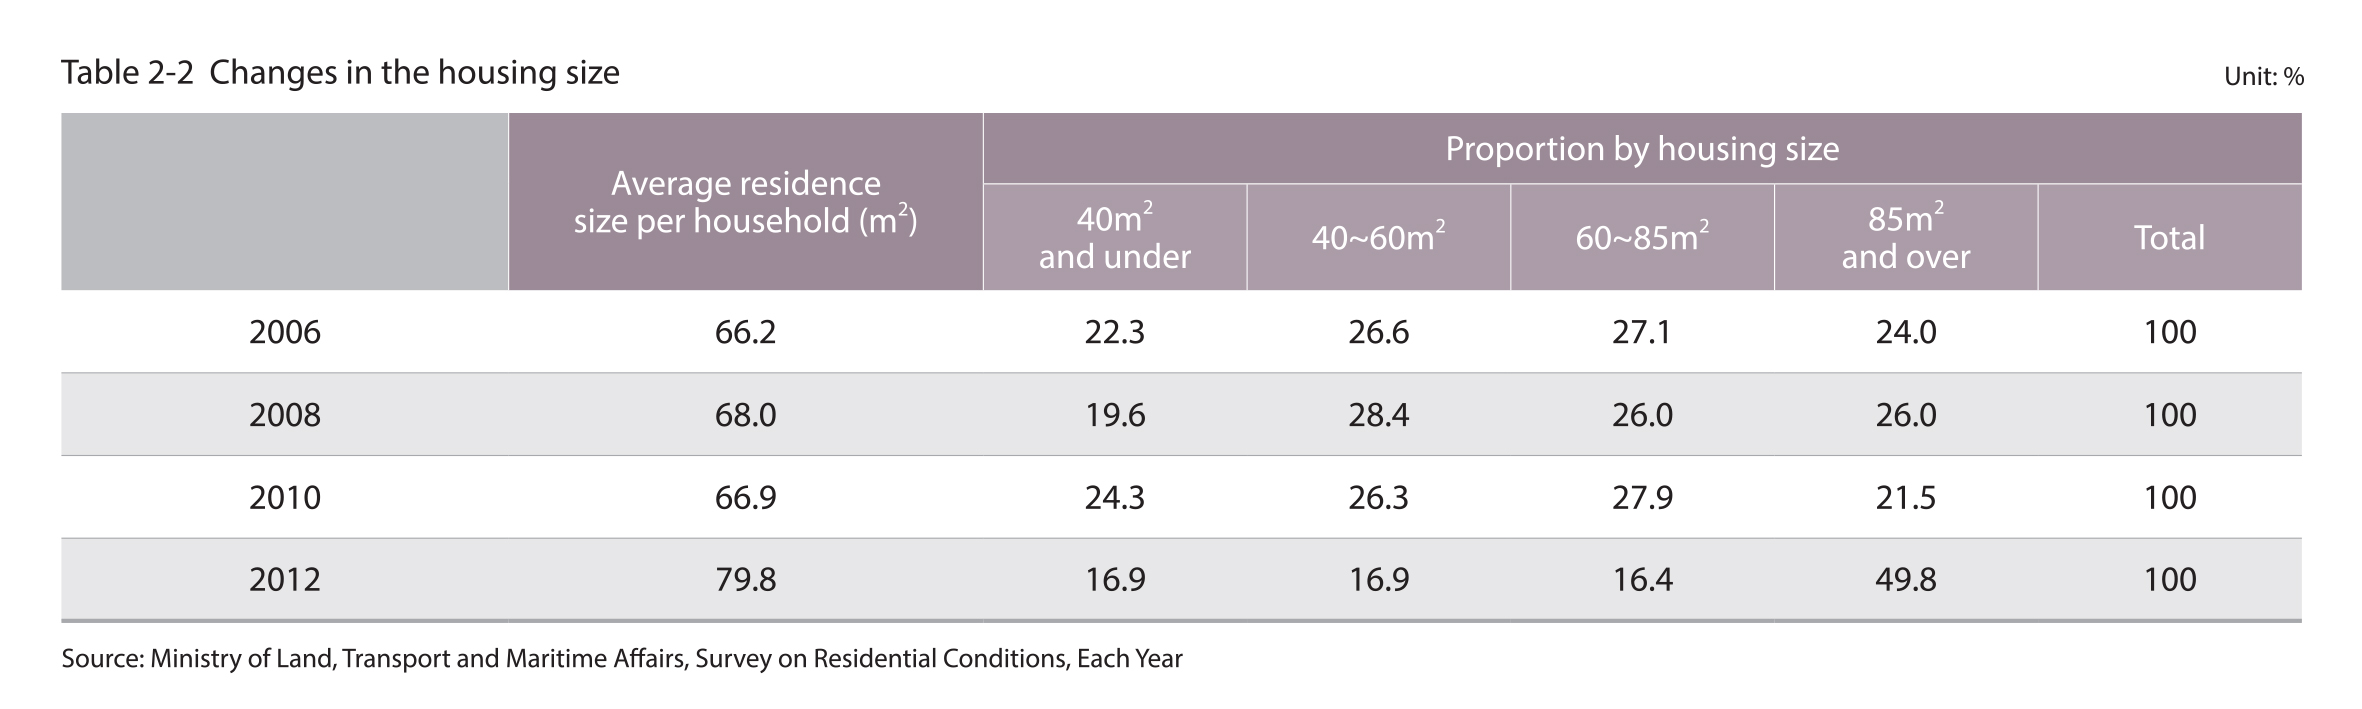
The average size of a residence occupied by a household is 79.8㎡
As of 2012, the average size of a residence occupied by a household in Seoul is 79.8㎡. The average size of a residence for every household in Seoul increased from 65.2㎡ in 2006 to 79.8㎡ in 2012. While there was a decrease in the percentage of residents living in small- and medium-sized housing units with an area of 85㎡ and smaller, there was an increase in the percentage of residents living in medium- and large-sized housing units with an area of 85㎡ and bigger.
8.7% of the households in Seoul do not meet the "minimum housing standards"
As of 2012, there are about 310,000 households that do not meet the minimum housing standards and this is 8.7% of the total number of households in Seoul. As for the Seoul Metropolitan Area, about 6.6% of the 8.5 million households were found not to meet the minimum housing standards.
Source : Ministry of Land, Transport and Maritime Affairs, Survey on Residentlial Conditions, Each Year
.jpg)
Source : Ministry of Land, Transport and Maritime Affairs (2002), Survey on Residentlial Conditions, Each Year; Article 5-2 of the Housing Act and Article 7 of the Enforcement Decree of the Act
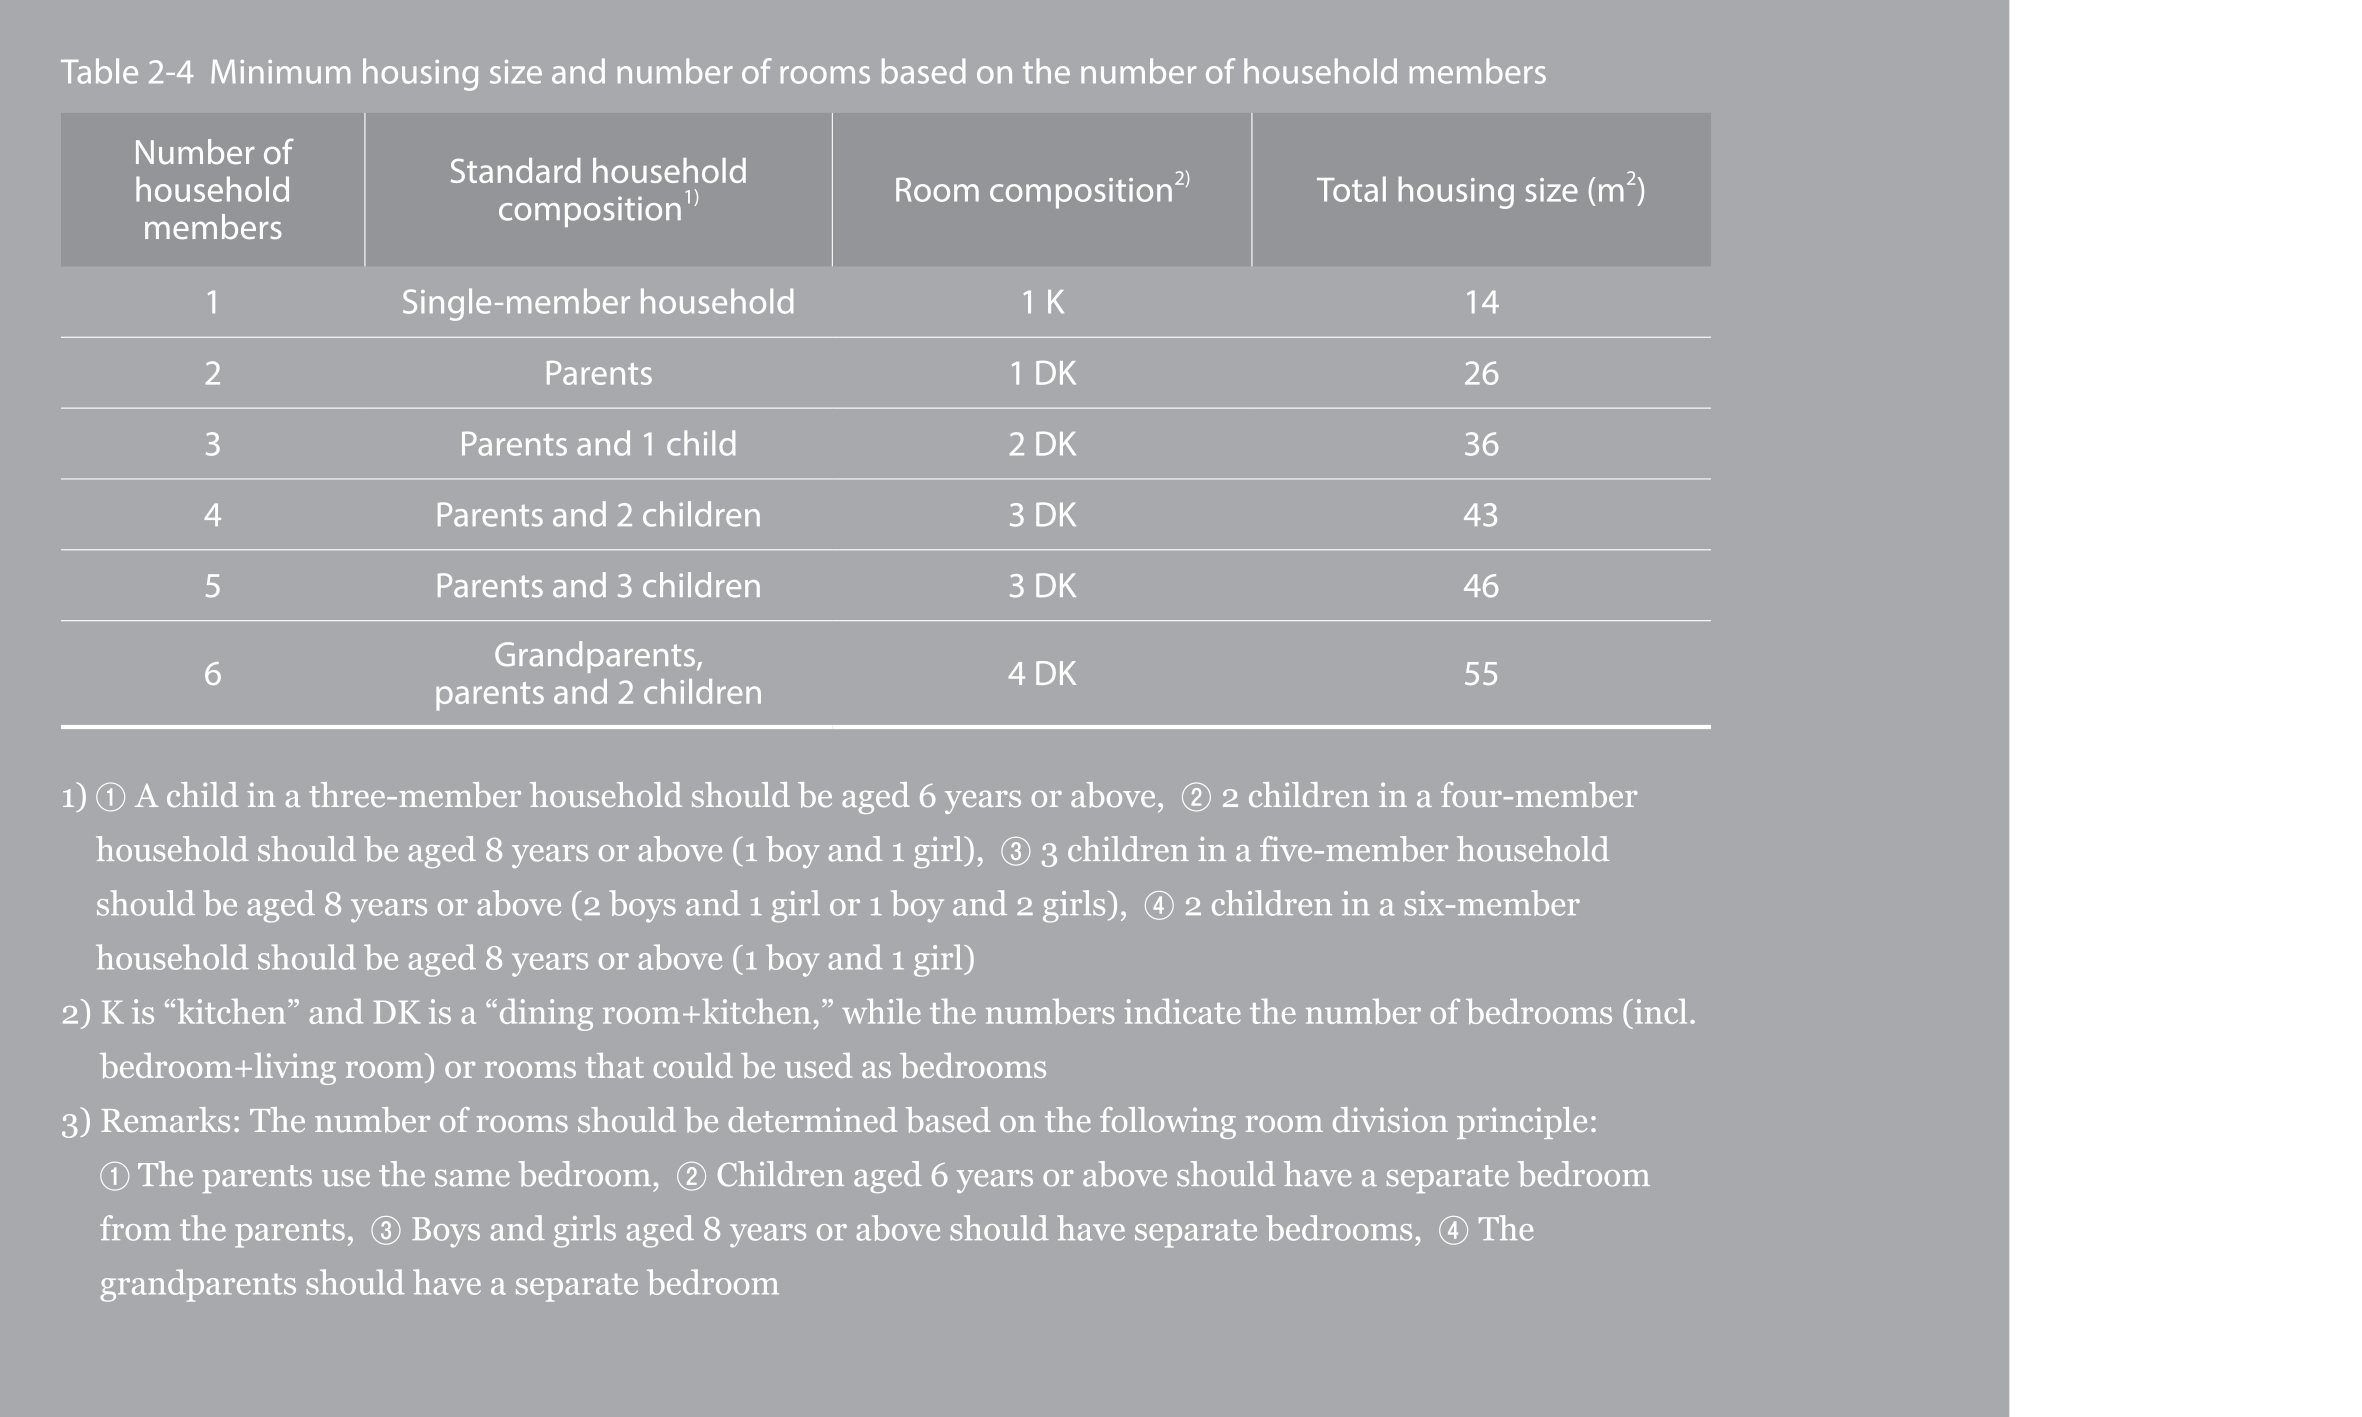
The minimum housing standards are based on the area (housing size) and facilities. The minimum area is 14㎡ for a single-person household, 26㎡ for a two-person household, and 36㎡ for a three-person household, consisting of parents and a child. The minimum number of rooms is shown in Table 2-4. In addition, the facilities are assessed based on the presence of a water supply system or a facility for the use of groundwater with good water quality, as well as exclusive kitchen, exclusive flush-type toilet and bathing facilities (incl. case in which there are bathing facilities with a flush toilet) with drainage and sewage facilities.
1.3. Residence Tenure
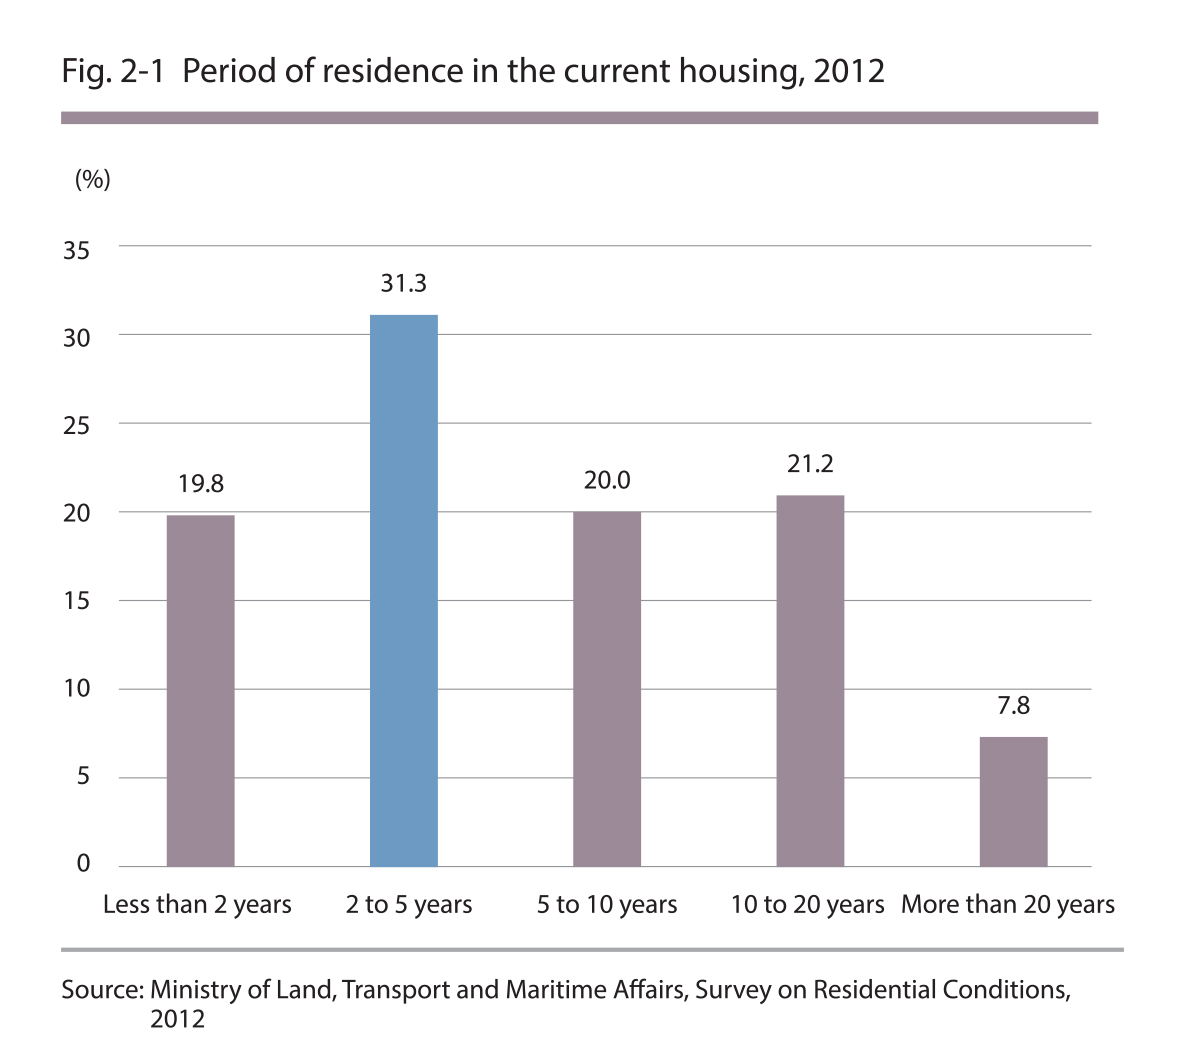
50% of the total households in Seoul have resided in the current residence for less than 5 years, and 20% have resided for less than 2 years
About 1.13 million households in Seoul, which is about 31% of the total households, were found to have resided in the current place of residence for 2 to 5 years. On the other hand, nearly half of the total households in Seoul have resided in their current residence for less than 5 years, while 20% of the total households have resided in their current residence for less than 2 years. About 29% were long-term residents, who have lived in their current place of residence for more than 30 years.
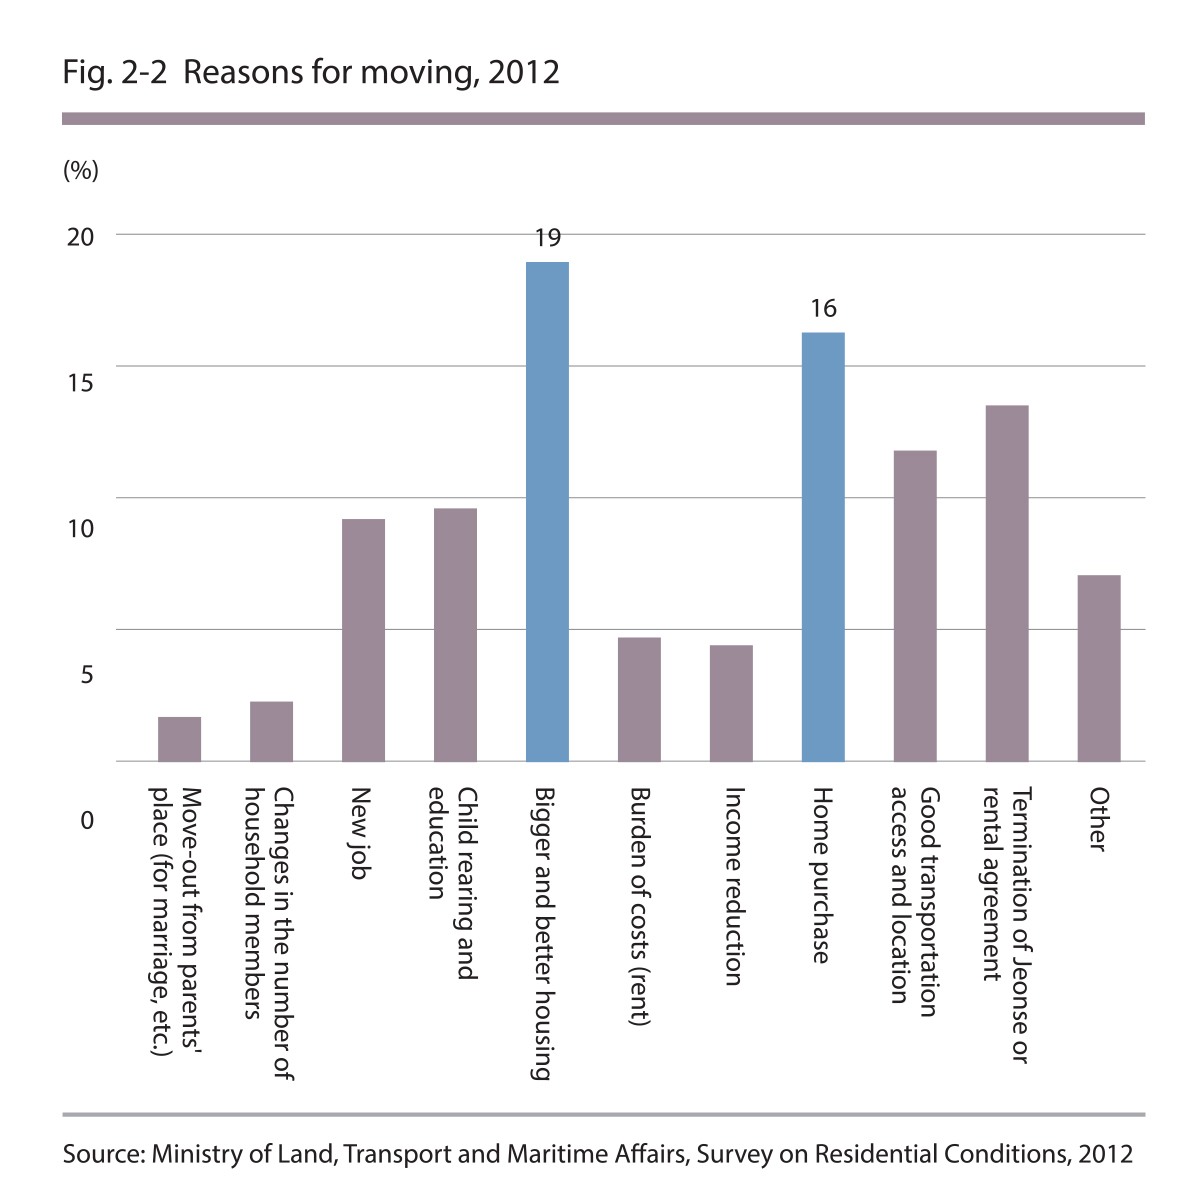
Change of residence resulting from home purchase and the termination of Jeonse/rental agreement or burden of rent for 1/3 and 1/4 of Seoul citizens, respectively
The reasons for moving into their current place of residence were examined, and the results showed that one out of three households in Seoul moved into the current place of residence to live in a bigger and better house (19%) or because they purchased a new home (16%). On the other hand, 23% of the households that moved did so for non-voluntary reasons such as the termination of Jeonse or monthly rental agreement (14%), burden of high monthly rent (5%) and income reduction (4%) etc.
Source : Ministry of Land. Transport and Maritime Affairs, Survey on Residential Conditions, 2012
Source : Ministry of Land. Transport and Maritime Affairs, Survey on Residential Conditions, 2012
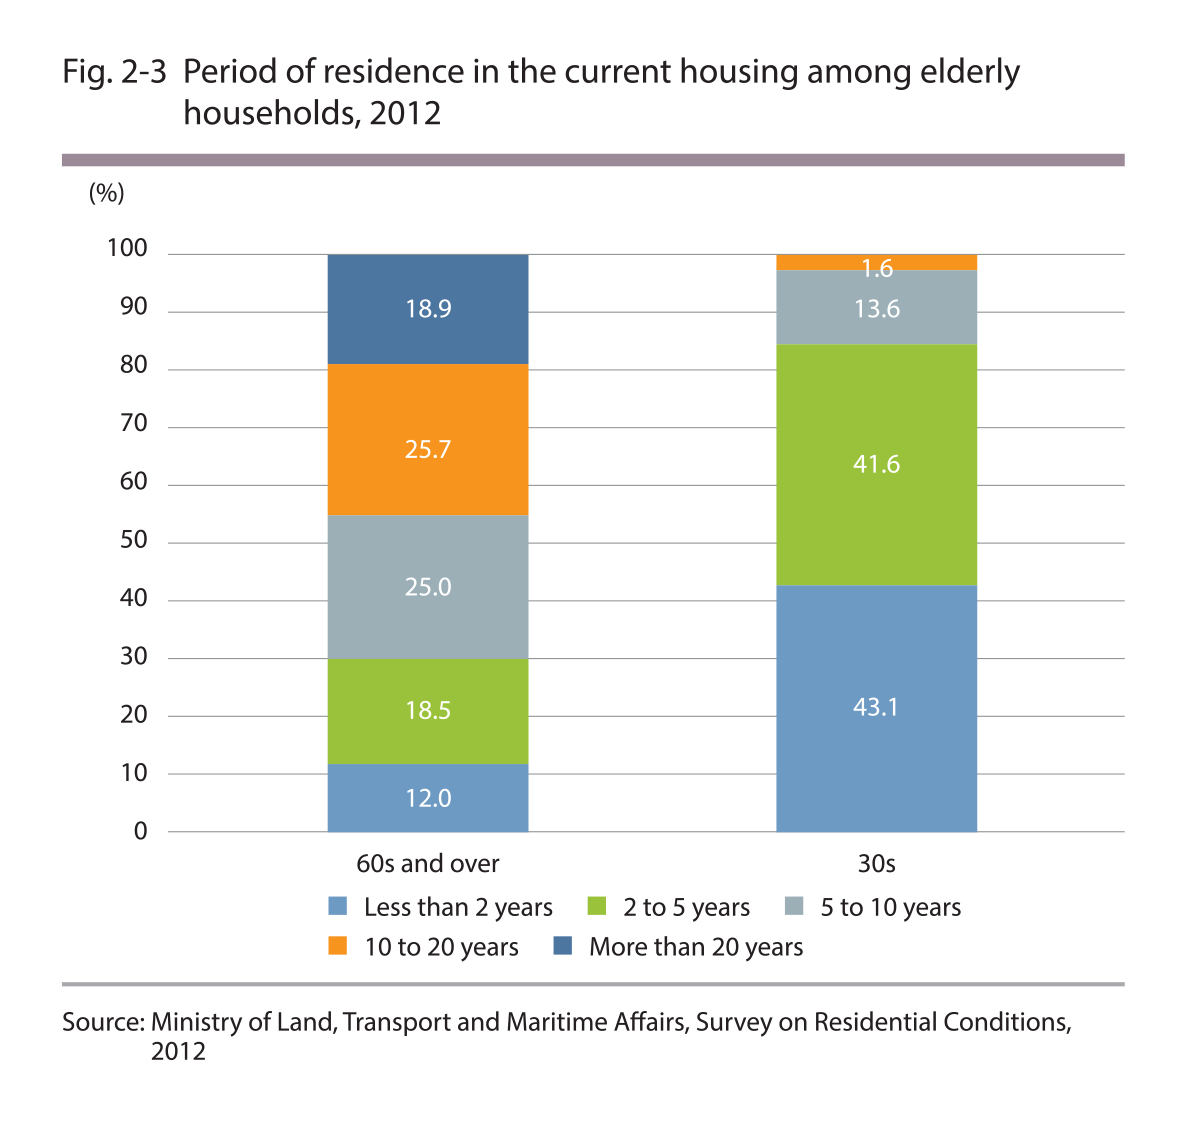
45% of the elderly households in Seoul resided in the same place for more than 10 years
As of 2012, 45% of the e1derly households in Seoul were found to have resided in their current place of residence for more than 10 years, showing a strong tendency toward "long-term residence." Compared to the households where the head of the household is in his/her 30s, a significantly higher percentage of the elderly households lived in their current place of residence for at least 5 years.
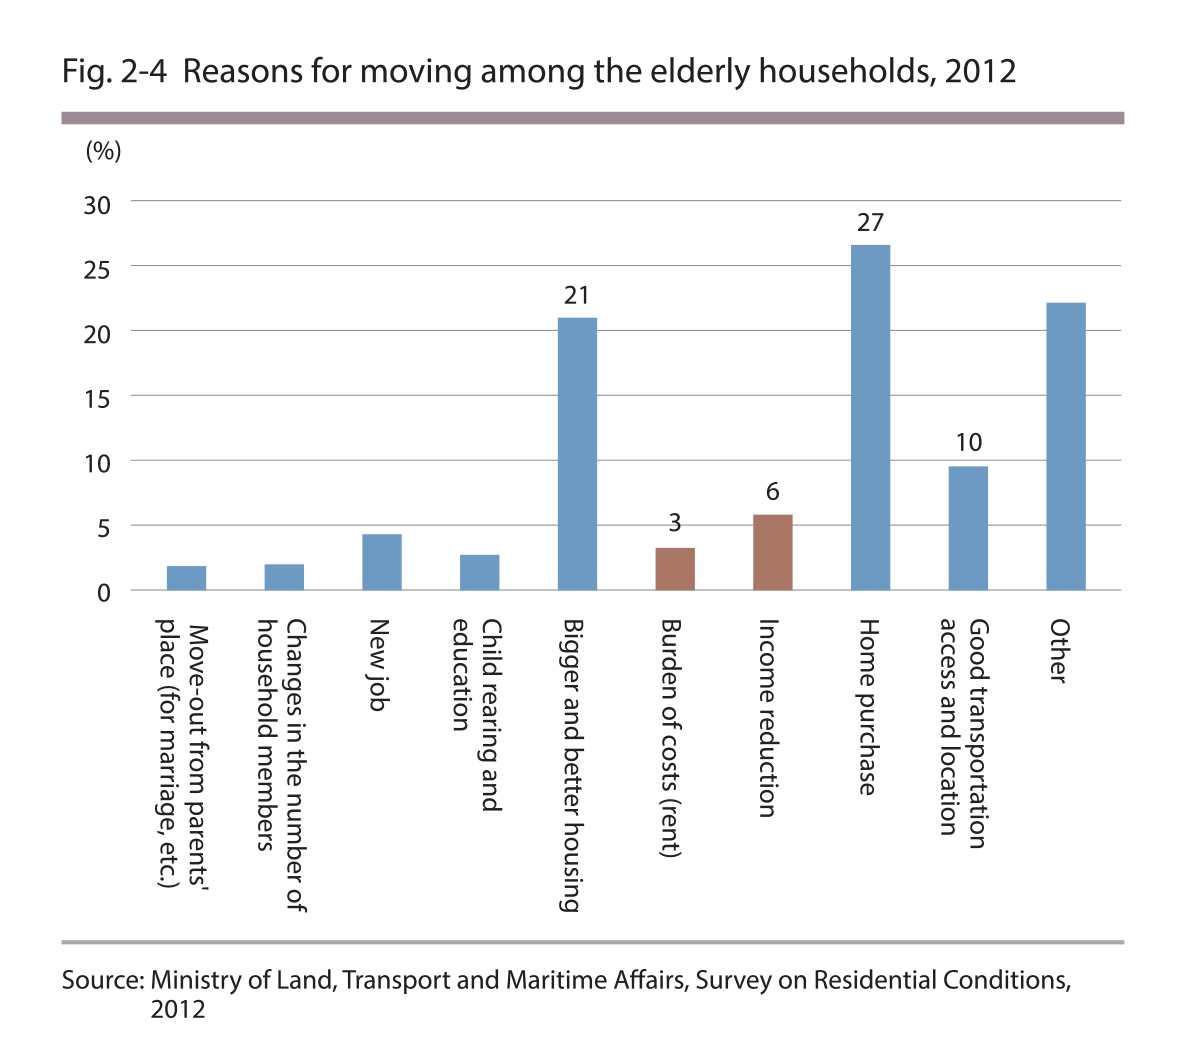
The most common reason for moving into the current place of residence among the elderly households in Seou1 was home purchase (27%), while 21% moved for bigger and better housing and lO% moved for better location and transportation access. Meanwhile, 9% of the elderly households moved for non-voluntary reasons such as the burden of rent and lower income, etc.
Source : Ministry of Land. Transport and Maritime Affairs, Survey on Residential Conditions, 2012
Source : Ministry of Land. Transport and Maritime Affairs, Survey on Residential Conditions, 2012
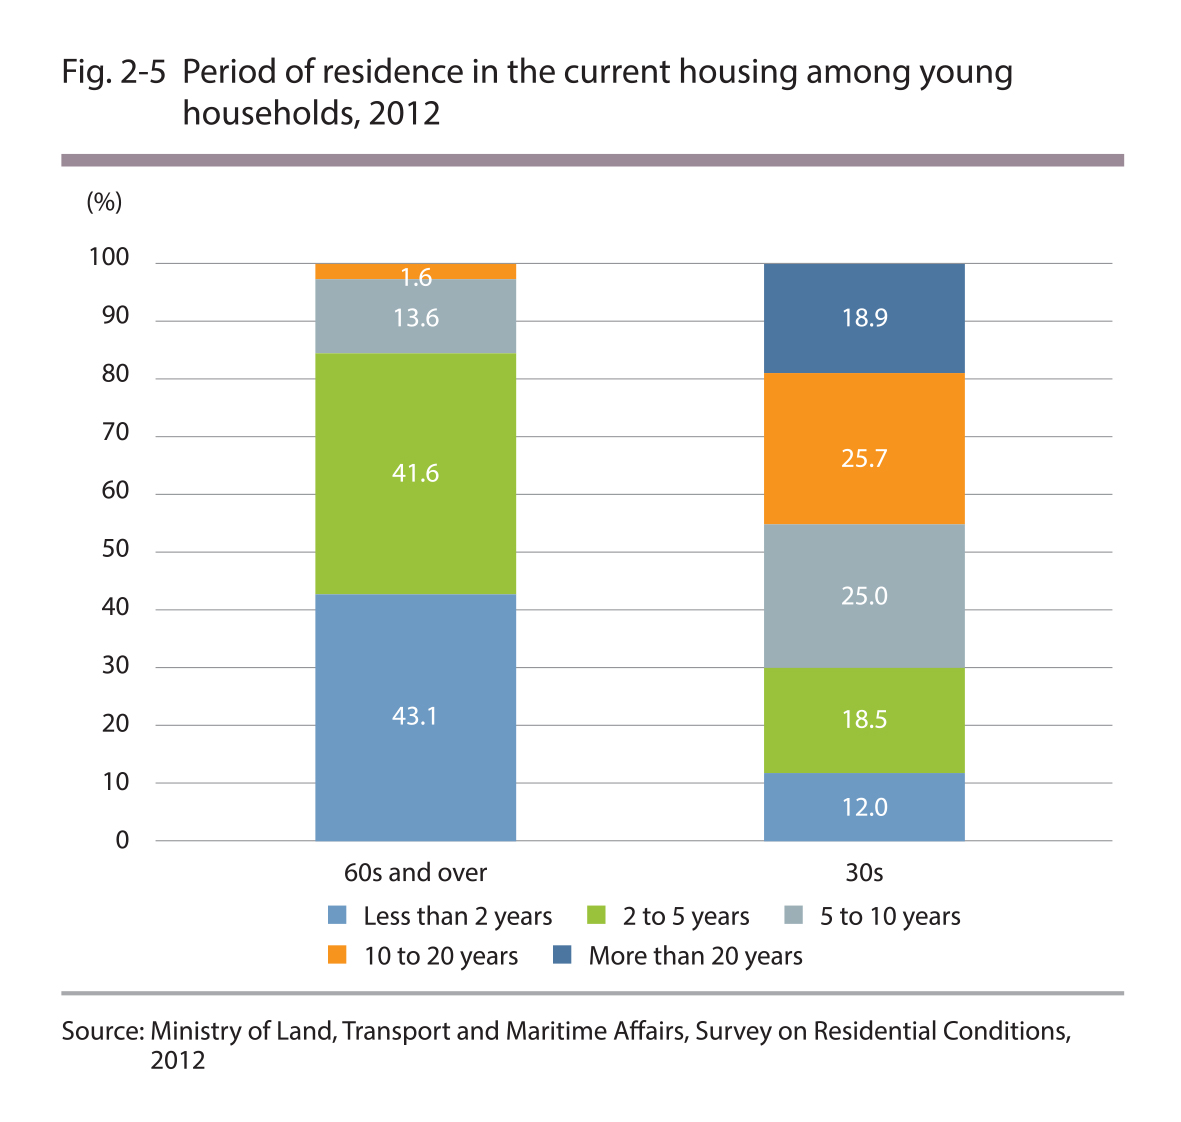
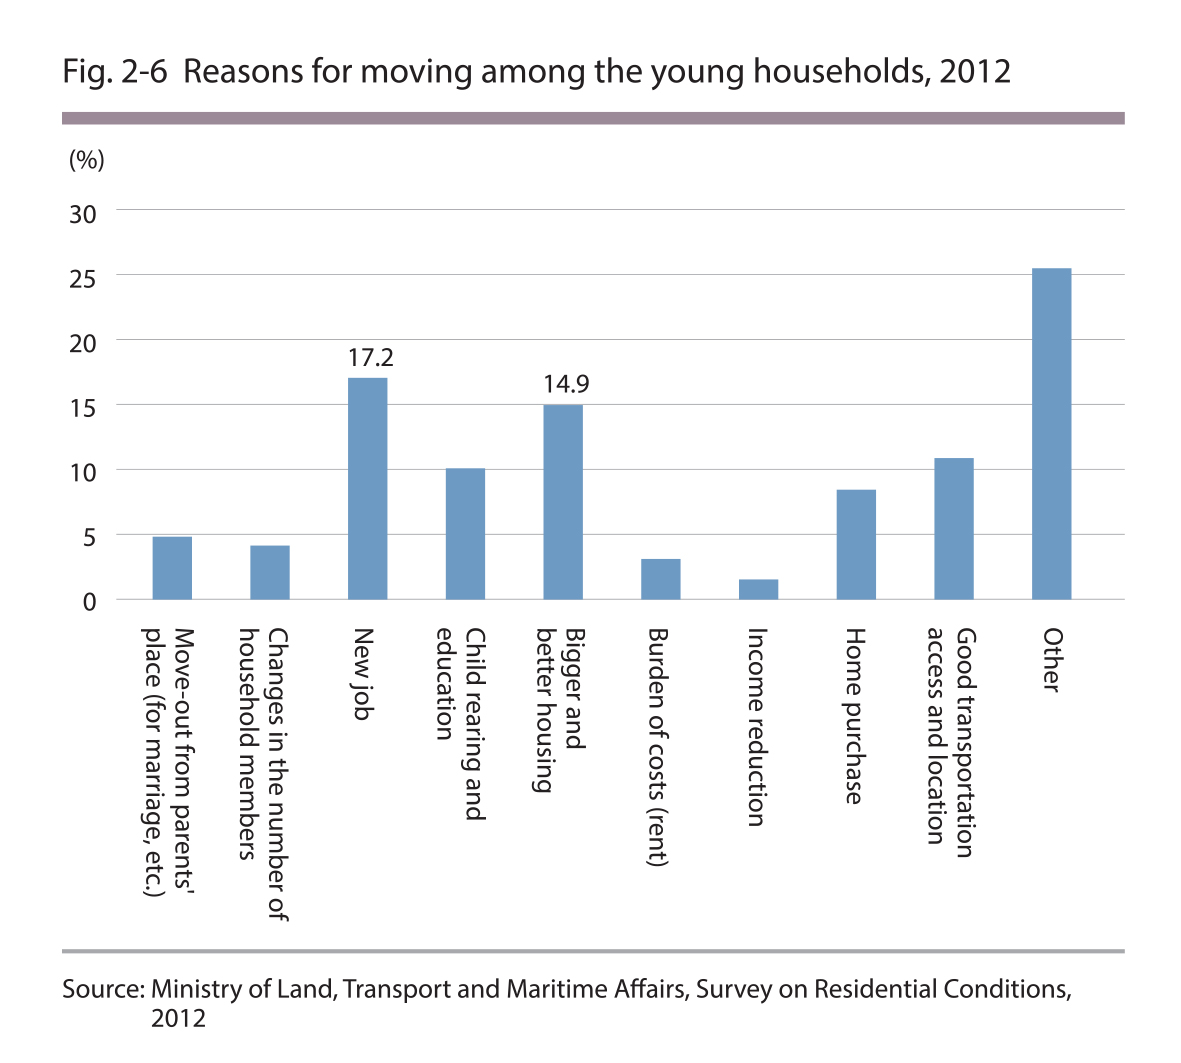
43% of the young households resided in the same place for less than 2 years
As of 2012, 43% of the young households (with the head of the household in their 30s) in Seoul were found to have resided in their current place of residence for less than 2 years, showing a strong tendency toward "short-term residence." This is associated with how 80% of the young households are living on Jeonse or monthly rent.
The young households moved for various reasons such as a new job (17%), housing size (15%), transportation access and location (11%), and child education (10%). It was found that while child education and transportation access and location are becoming more prevalent reasons for moving, the reasons of bigger housing and home purchase are becoming less common.
Source : Ministry of Land. Transport and Maritime Affairs, Survey on Residential Conditions, 2012
Source : Ministry of Land. Transport and Maritime Affairs, Survey on Residential Conditions, 2012
1.4. Housing Costs
The housing price-to-income ratio (PIR) in Seoul is 10.0
The housing price-to-income ratio (PIR) in Seoul increased from 7.2 in 2006 to 10.0 in 2012, while in the Seoul Metropolitan Area, the housing PIR increased from 5.7 in 2006 to 6.7 in 2012. Thus, the PIR in Seoul was found to be higher than that of the Seoul Meσopolitan Area.
For reference purposes, the housing PRI in Seoul is considerably higher compared to other major cities overseas including New York (7.0), London (6.9) and Tokyo (5.8) (2020 Seoul Housing Plan Report, 2011)
The rent-to-income ratio (RIR) in Seoul is 25.5%
The rent-to-income ratio (RIR) is 25.5% in Seoul and 23.3% in the Seoul Metropolitan Area as of 2012.
In 2012, the average lump-sum deposit for Jeonse in Seoul was 181,090,000 KRW, which was a 14% increase annually on average from 83,520,000 in 2006. Of particular note, the average Jeonse deposit in Seoul increased by about 55% from 2010 to 2012. On the other hand, for monthly rentaLs, the average lump-sum deposit was 21,990,000 KRW with a monthly rent of 310,000 KRW. The monthly rent deposit increased annua1ly by 11% and the monthly rent by 1% from 2006 to 2012. When the lump-sum deposit was converted to the monthly rent, the monthly rent was shown to have increased at an average annual rate of 4%.
In the Seoul Metropolitan Area, the average Jeonse deposit rose to 150 million KRW at an average annuaL rate of 14% and the average monthly rate increased to 310,000 KRW with a deposit of 21.45 million KRW at an average annuaL rate of 5% between 2006 and 2012.

Source : Ministry of Land. Transport and Maritime Affairs, Survey on Residential Conditions, Each Year

Source : Ministry of Land. Transport and Maritime Affairs, Survey on Residential Conditions, Each Year
2. Residential Conditions for Low-Income Households
2.1. Characteristics of Low-Income Households**
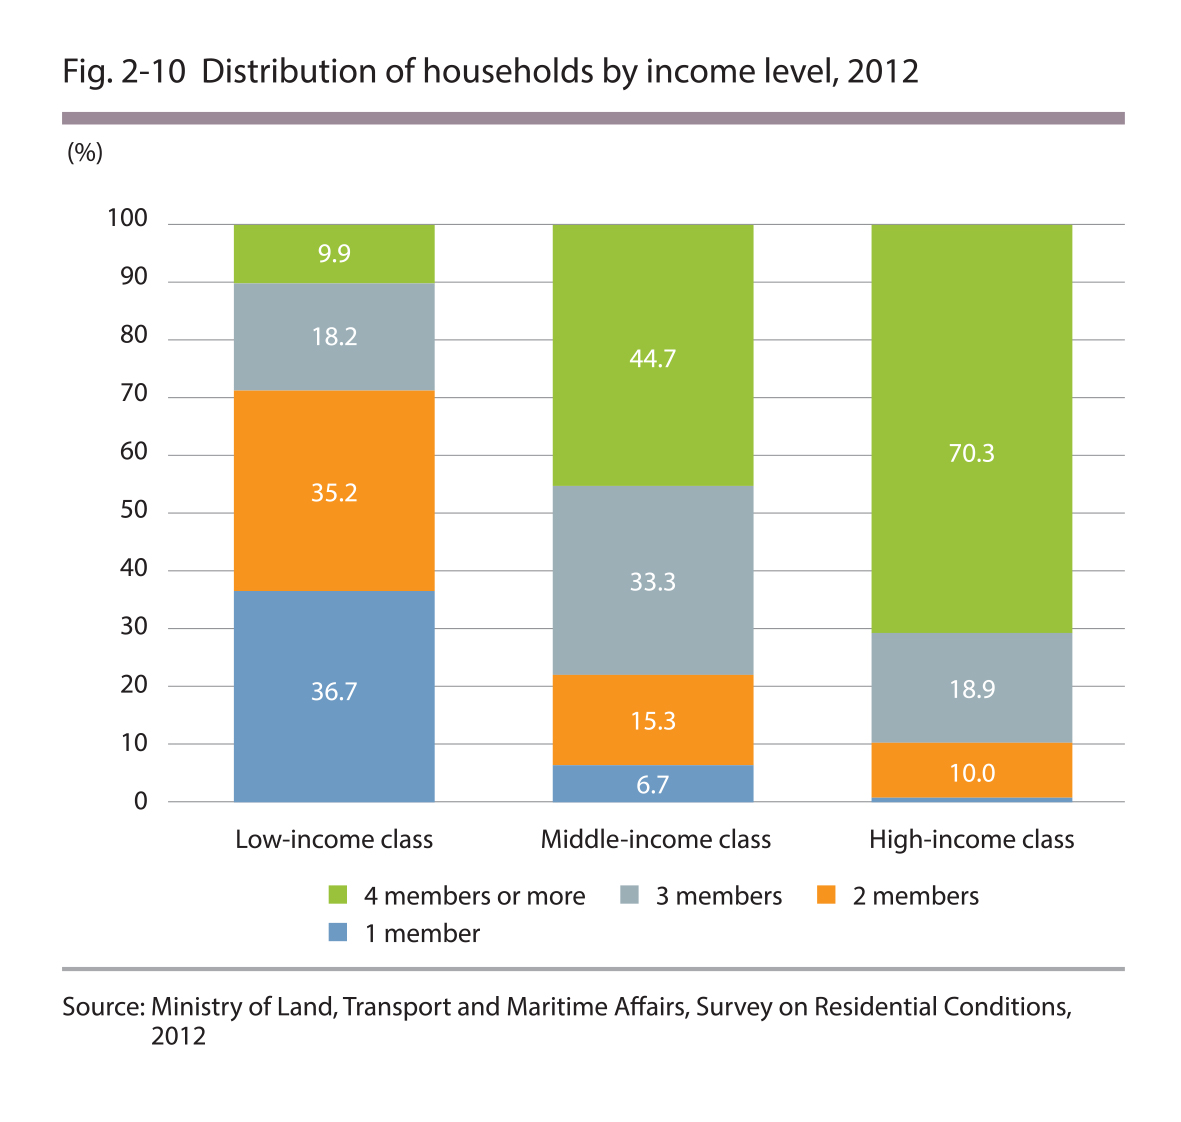
Low-income households (1.04 million) account for 29% of the total number of households in Seoul
As of 2012, there are 1.04 million low-income households falling under the 2.20 million KRW mark, which corresponds to the lower 40% of the income level, and this is 29% of the total number of households in Seoul. Single-person and two-person households account for 37% and 35% of the low-income households, respectively, and together, the single-person and two-person households make up three-quarters of the total number of low-income households.
**The income brackets (based on income levels) were divided into low-income class (up to the 40th percentile), middle-income class (50th to 80th percentile) and high-income class (90th to 100th percentile) based on the total average monthly income of the household members.

Source : Ministry of Land. Transport and Maritime Affairs, Survey on Residential Conditions, 2012
Source : Ministry of Land. Transport and Maritime Affairs, Survey on Residential Conditions, 2012
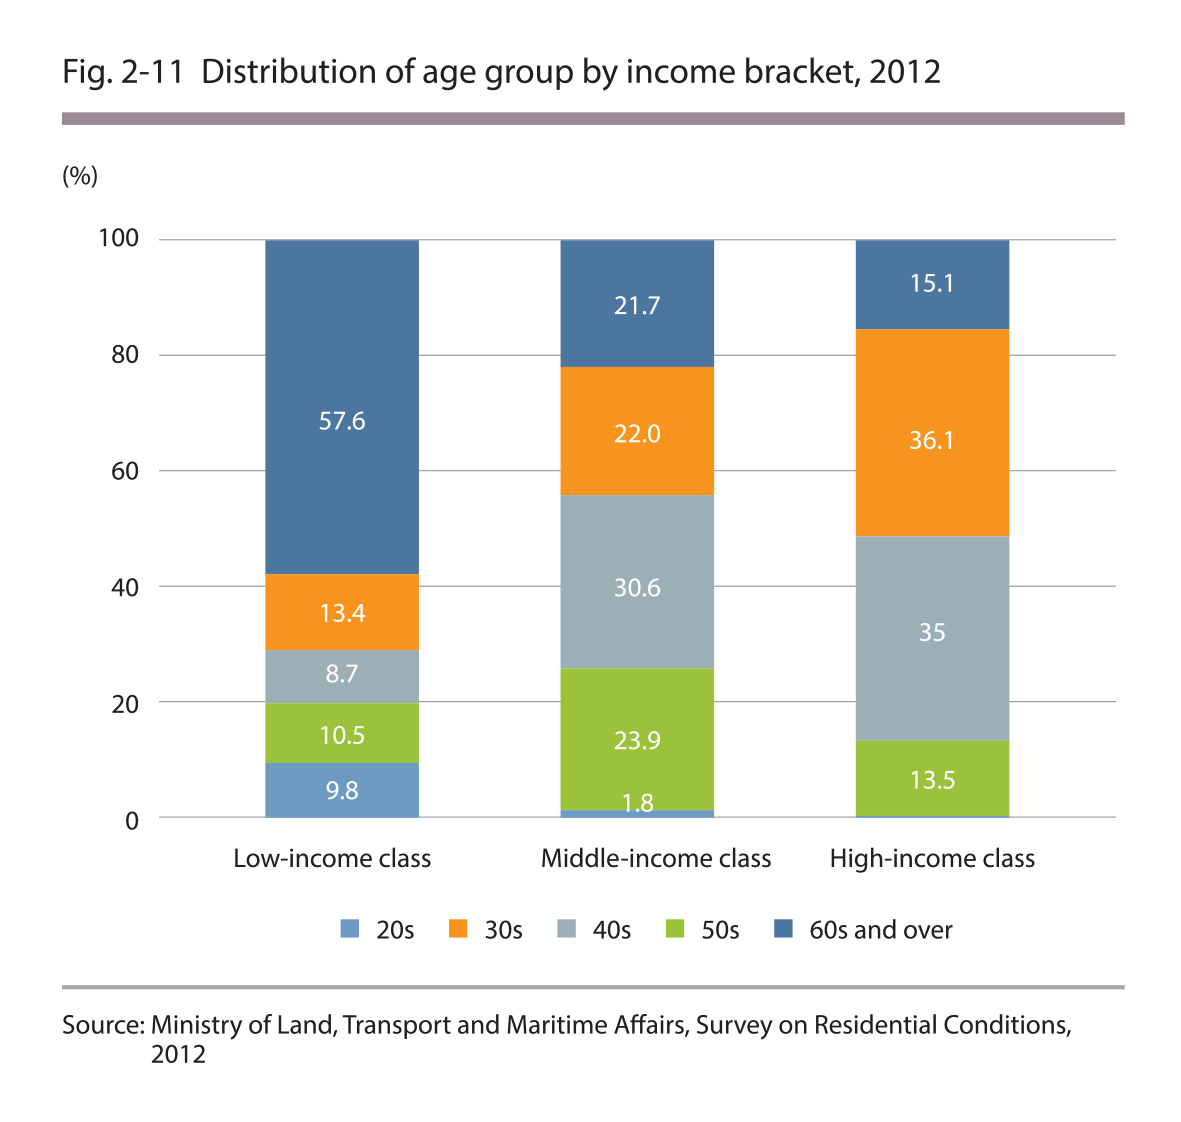
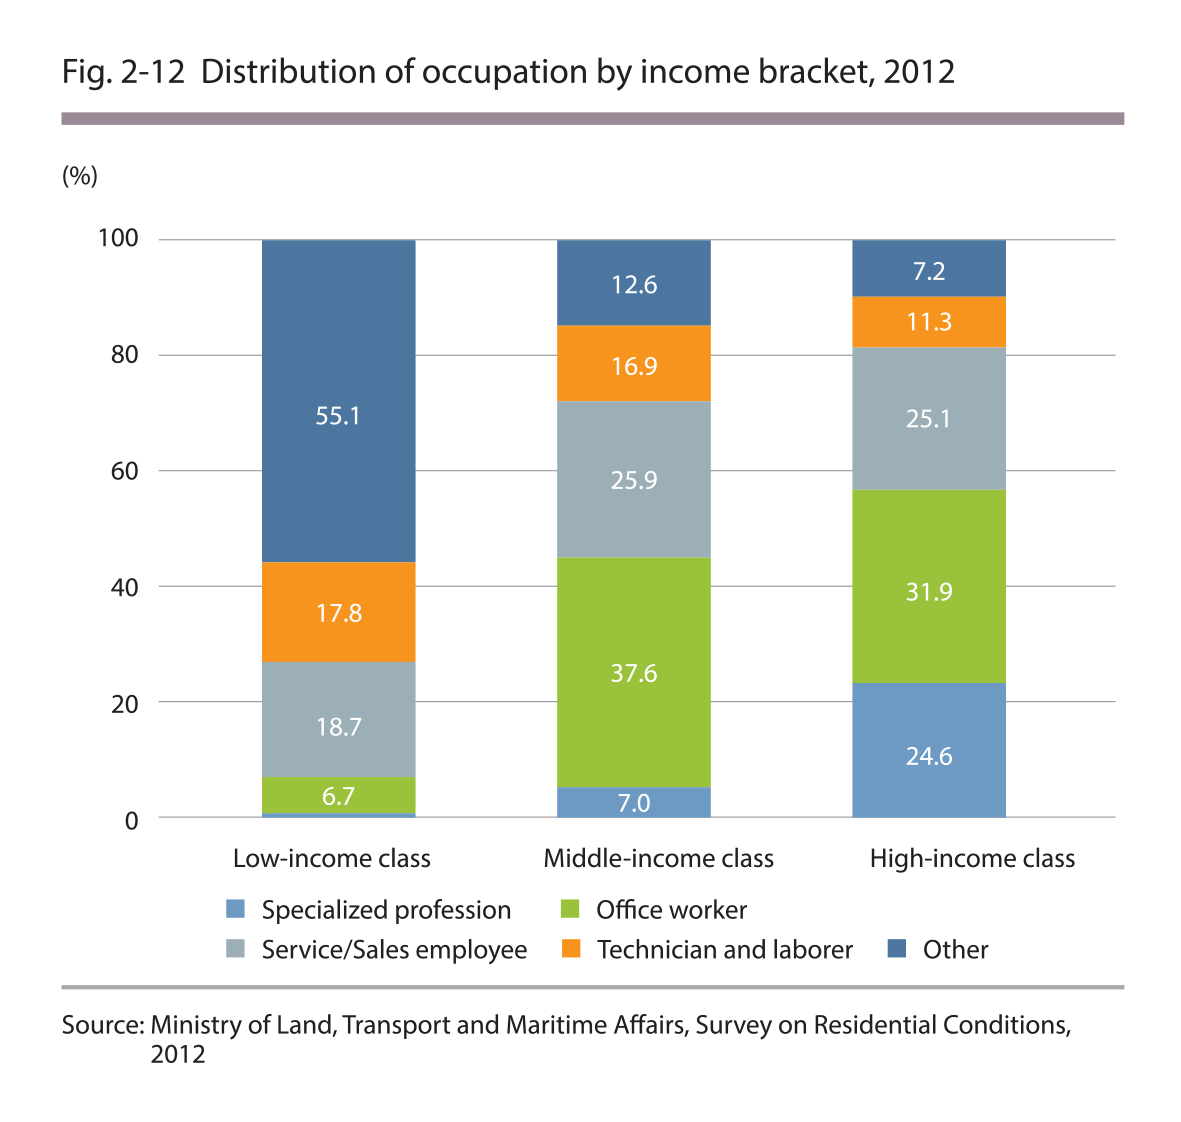
58% of the low-income households are the elderly households and 55% have unemployed head of households
In terms of the age group, elderly households with members aged over 60 accounted for the highest proportion of the low-income households at 58%, followed by the households with members aged over 50 (13%). In 55% of the low-income households, the head of the household was a student, housewife or unemployed, which made up the highest proportion.
Source : Ministry of Land. Transport and Maritime Affairs, Survey on Residential Conditions, 2012
Source : Ministry of Land. Transport and Maritime Affairs, Survey on Residential Conditions, 2012
2.2. Housing Type
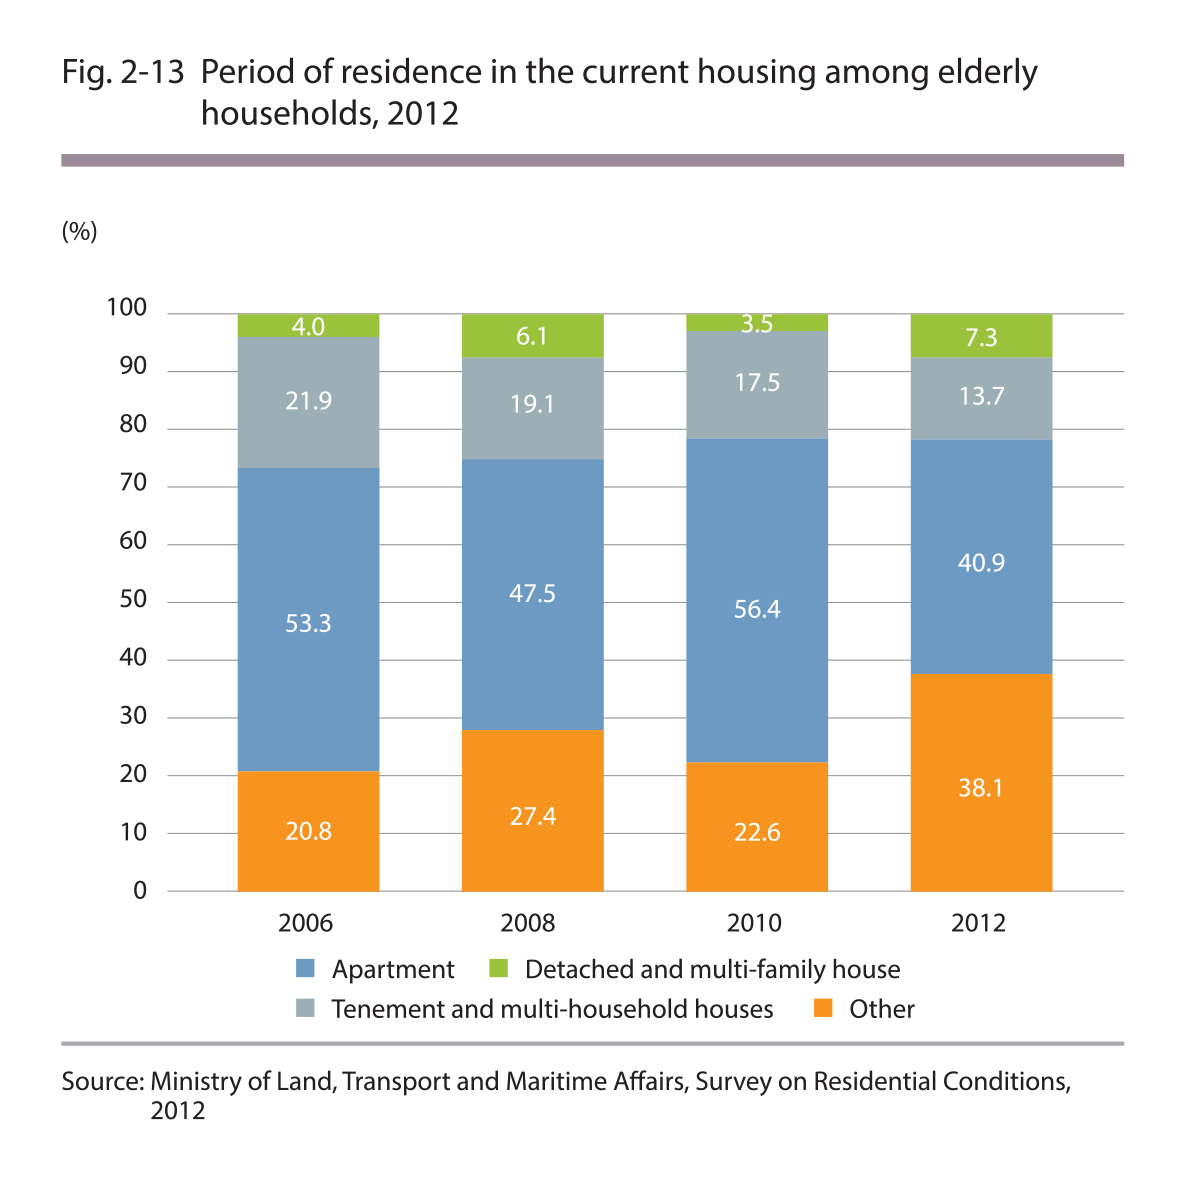
Most low-income households lived in detached or multi-family houses at 41%
As of 2012, the most common type of housing occupied by low-income housebolds were detached and multi-family houses at 41%, followed by apartments (38%) and tenement and multi-household houses (14%). The ratio of low-income households residing in detached and multi-family houses was higher than that residing in other housing types until 2010, but the ratio of low-income households residing in detached and multi-family houses decreased, while the ratio of apartmemt residence increased significantly in 2012.
Source : Ministry of Land. Transport and Maritime Affairs, Survey on Residential Conditions, 2012
2.3.Occupancy Type
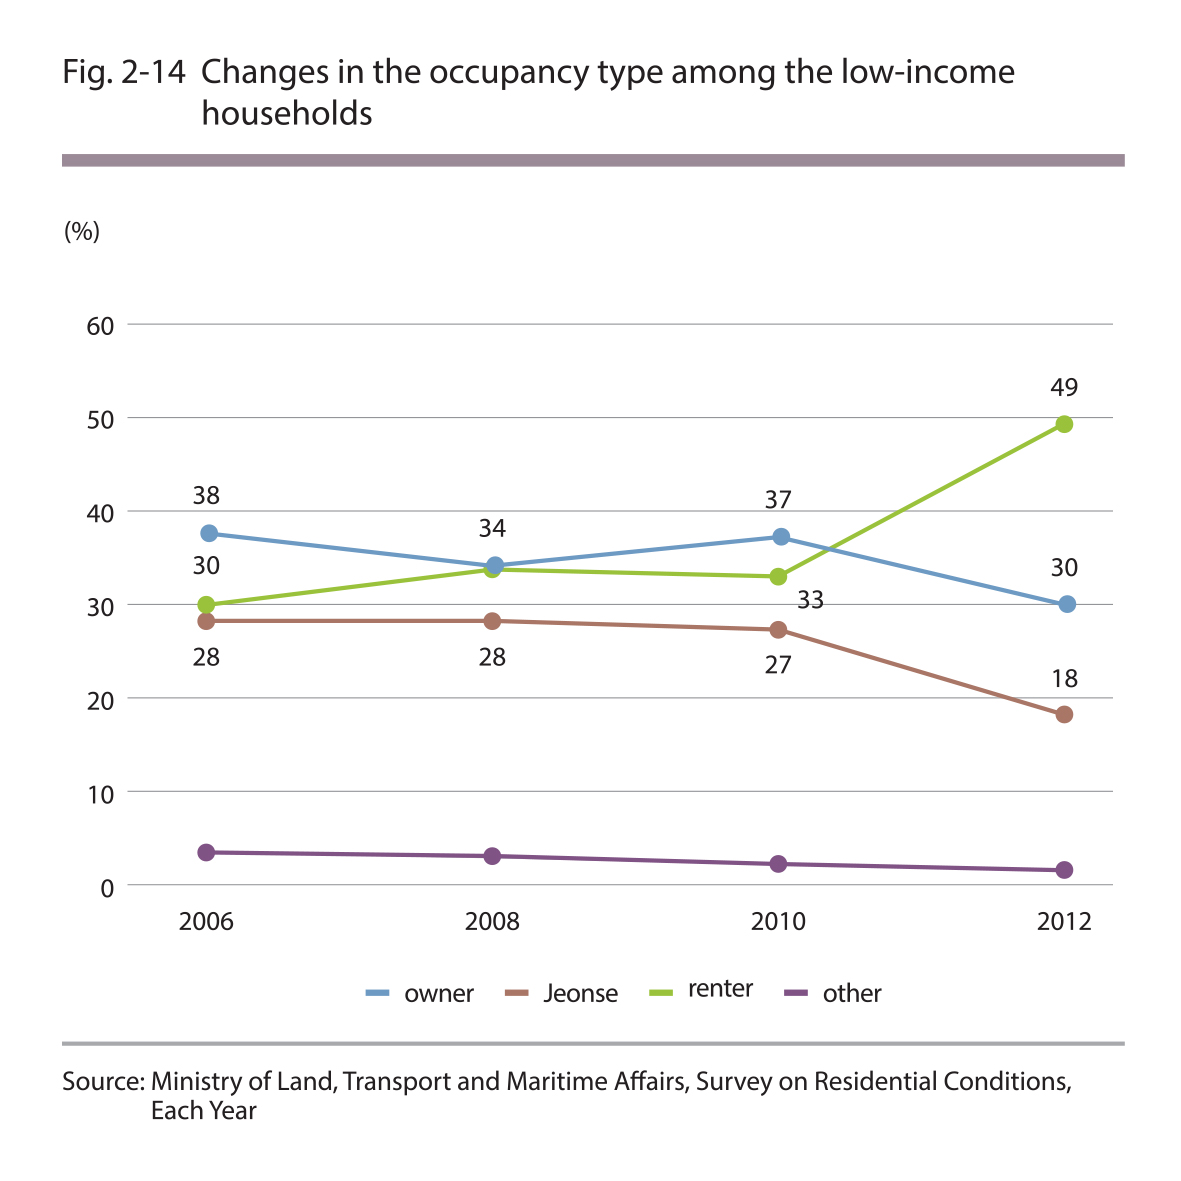
Half of low-income households are renters; a decrease in home owners and Jeonse occupants and an increase in renters
As of 2012, 49% of the low-income households living in Seoul are renters, which basically means that one out of two low-income households lives in a rented home. They are followed by home owners and Jeonse occupants, who account for 30% and 18% of the total number of low-income households, respectively. From 2006 to 2012, the ratios of owner occupancy and Jeonse occupancy decreased from 38% to 30% and 28% to 18%, respectively, whereas the ratio of renters increased considerably from 30% to 49% during the same period.
Source : Ministry of Land. Transport and Maritime Affairs, Survey on Residential Conditions, Each Year