
-
Transportation
Others
-
1. Roads
1.1. Overview
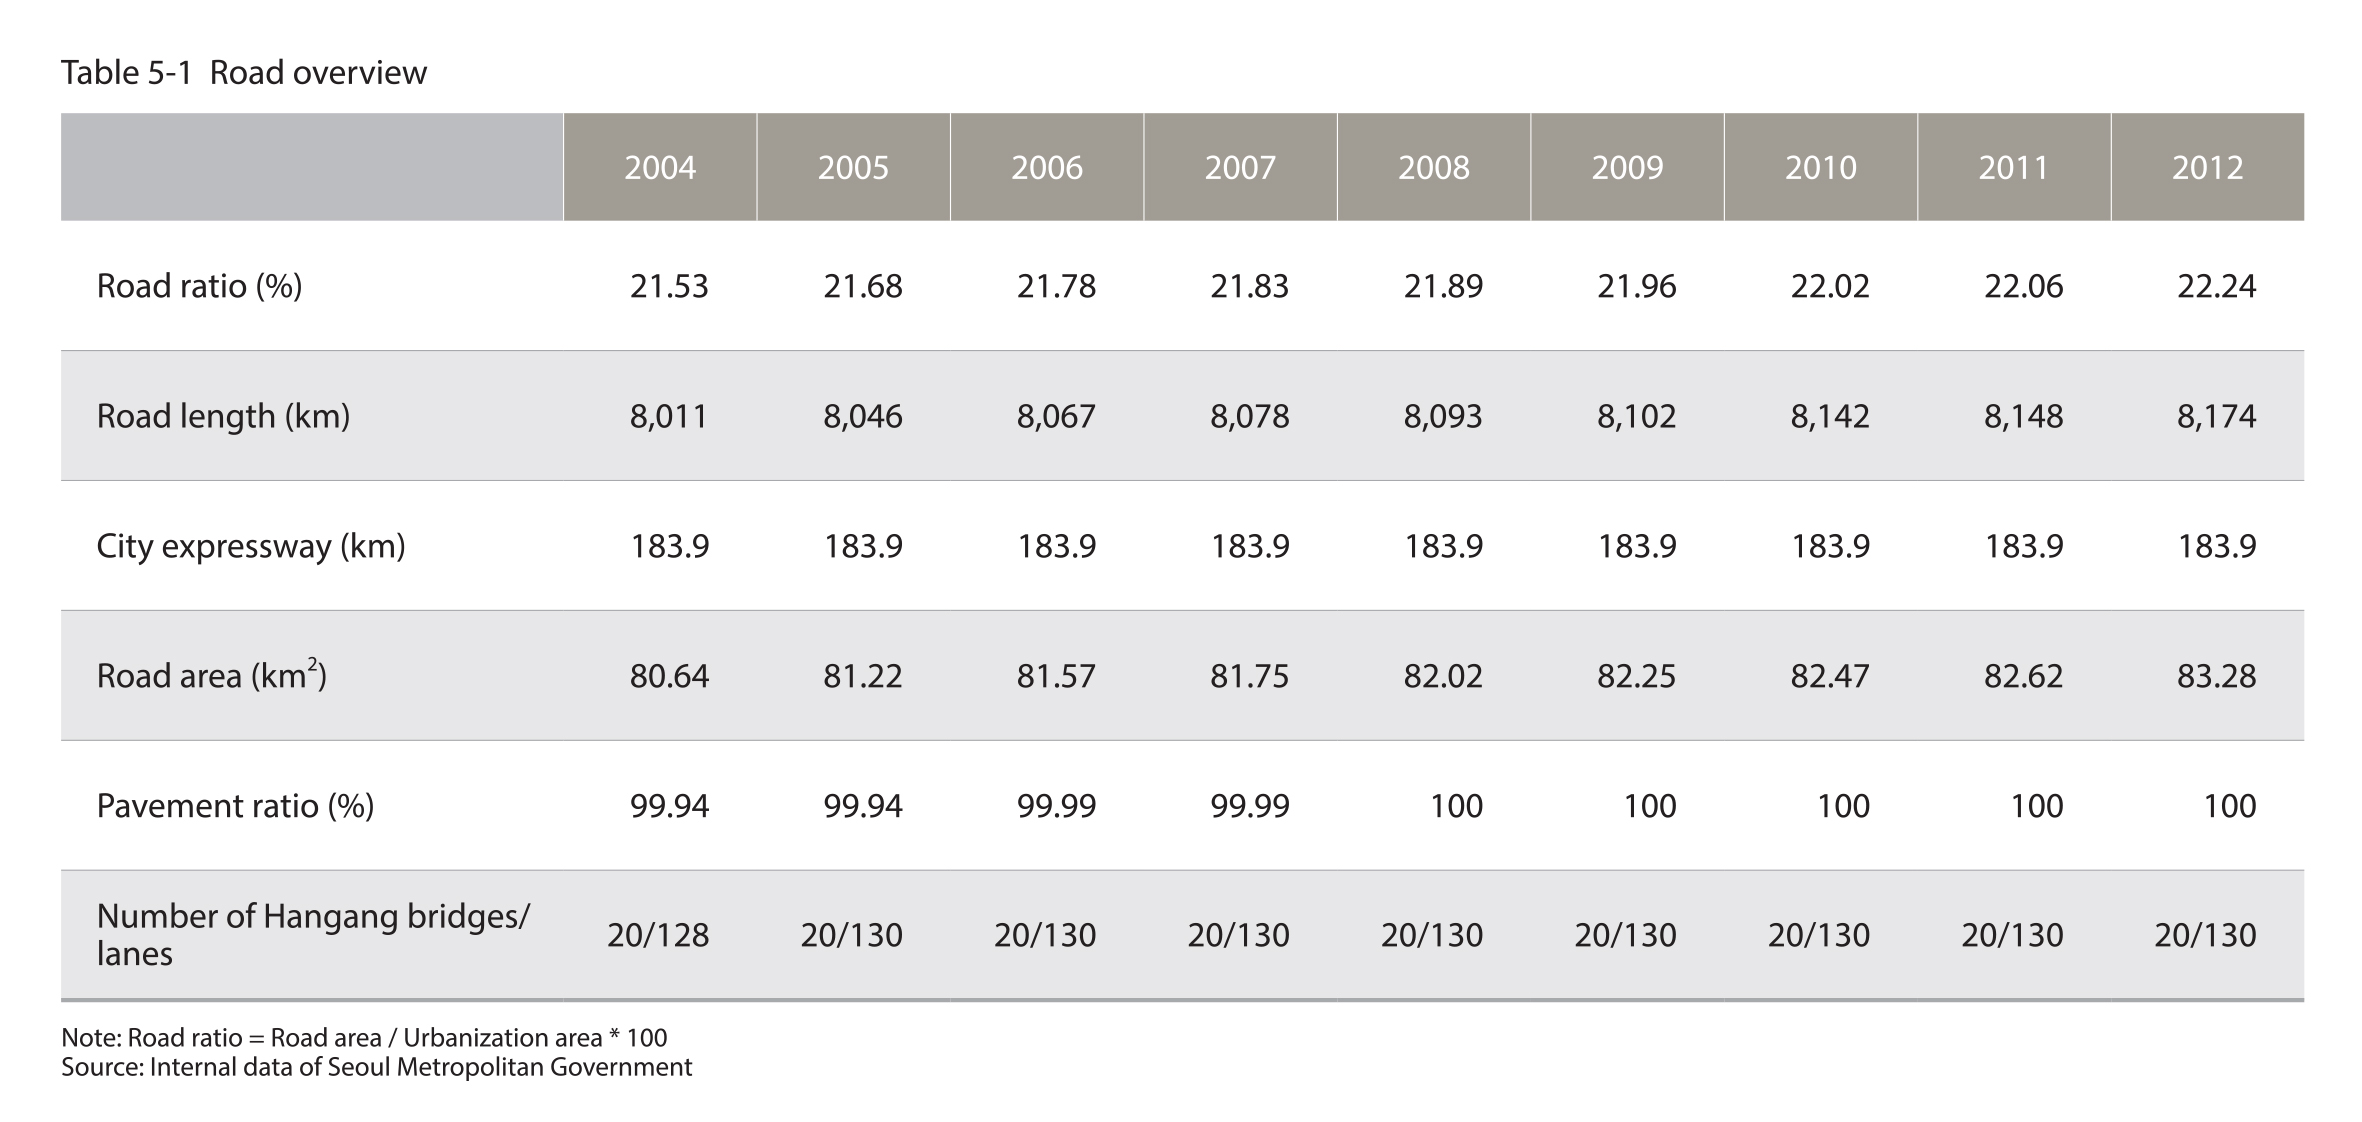
The roads are 8,174km in total length and 83.28㎢ in total area and the road ratio is 22.24%
The roads in Seoul have increased slightly since 2004 to 8,174km in total length and 83.28㎢ in total area as of 2012. An "urbanized area" is represented as a sum of the areas of residential, commercial, and industrial zones, and the road ratio calculated by dividing the area of roads by the urbanized area increased 0.41% annually on average starting in 2004 to 22.2% by 2012.
Source : Internal data of the Seoul Metropolitan Government
1.2. Length and Area
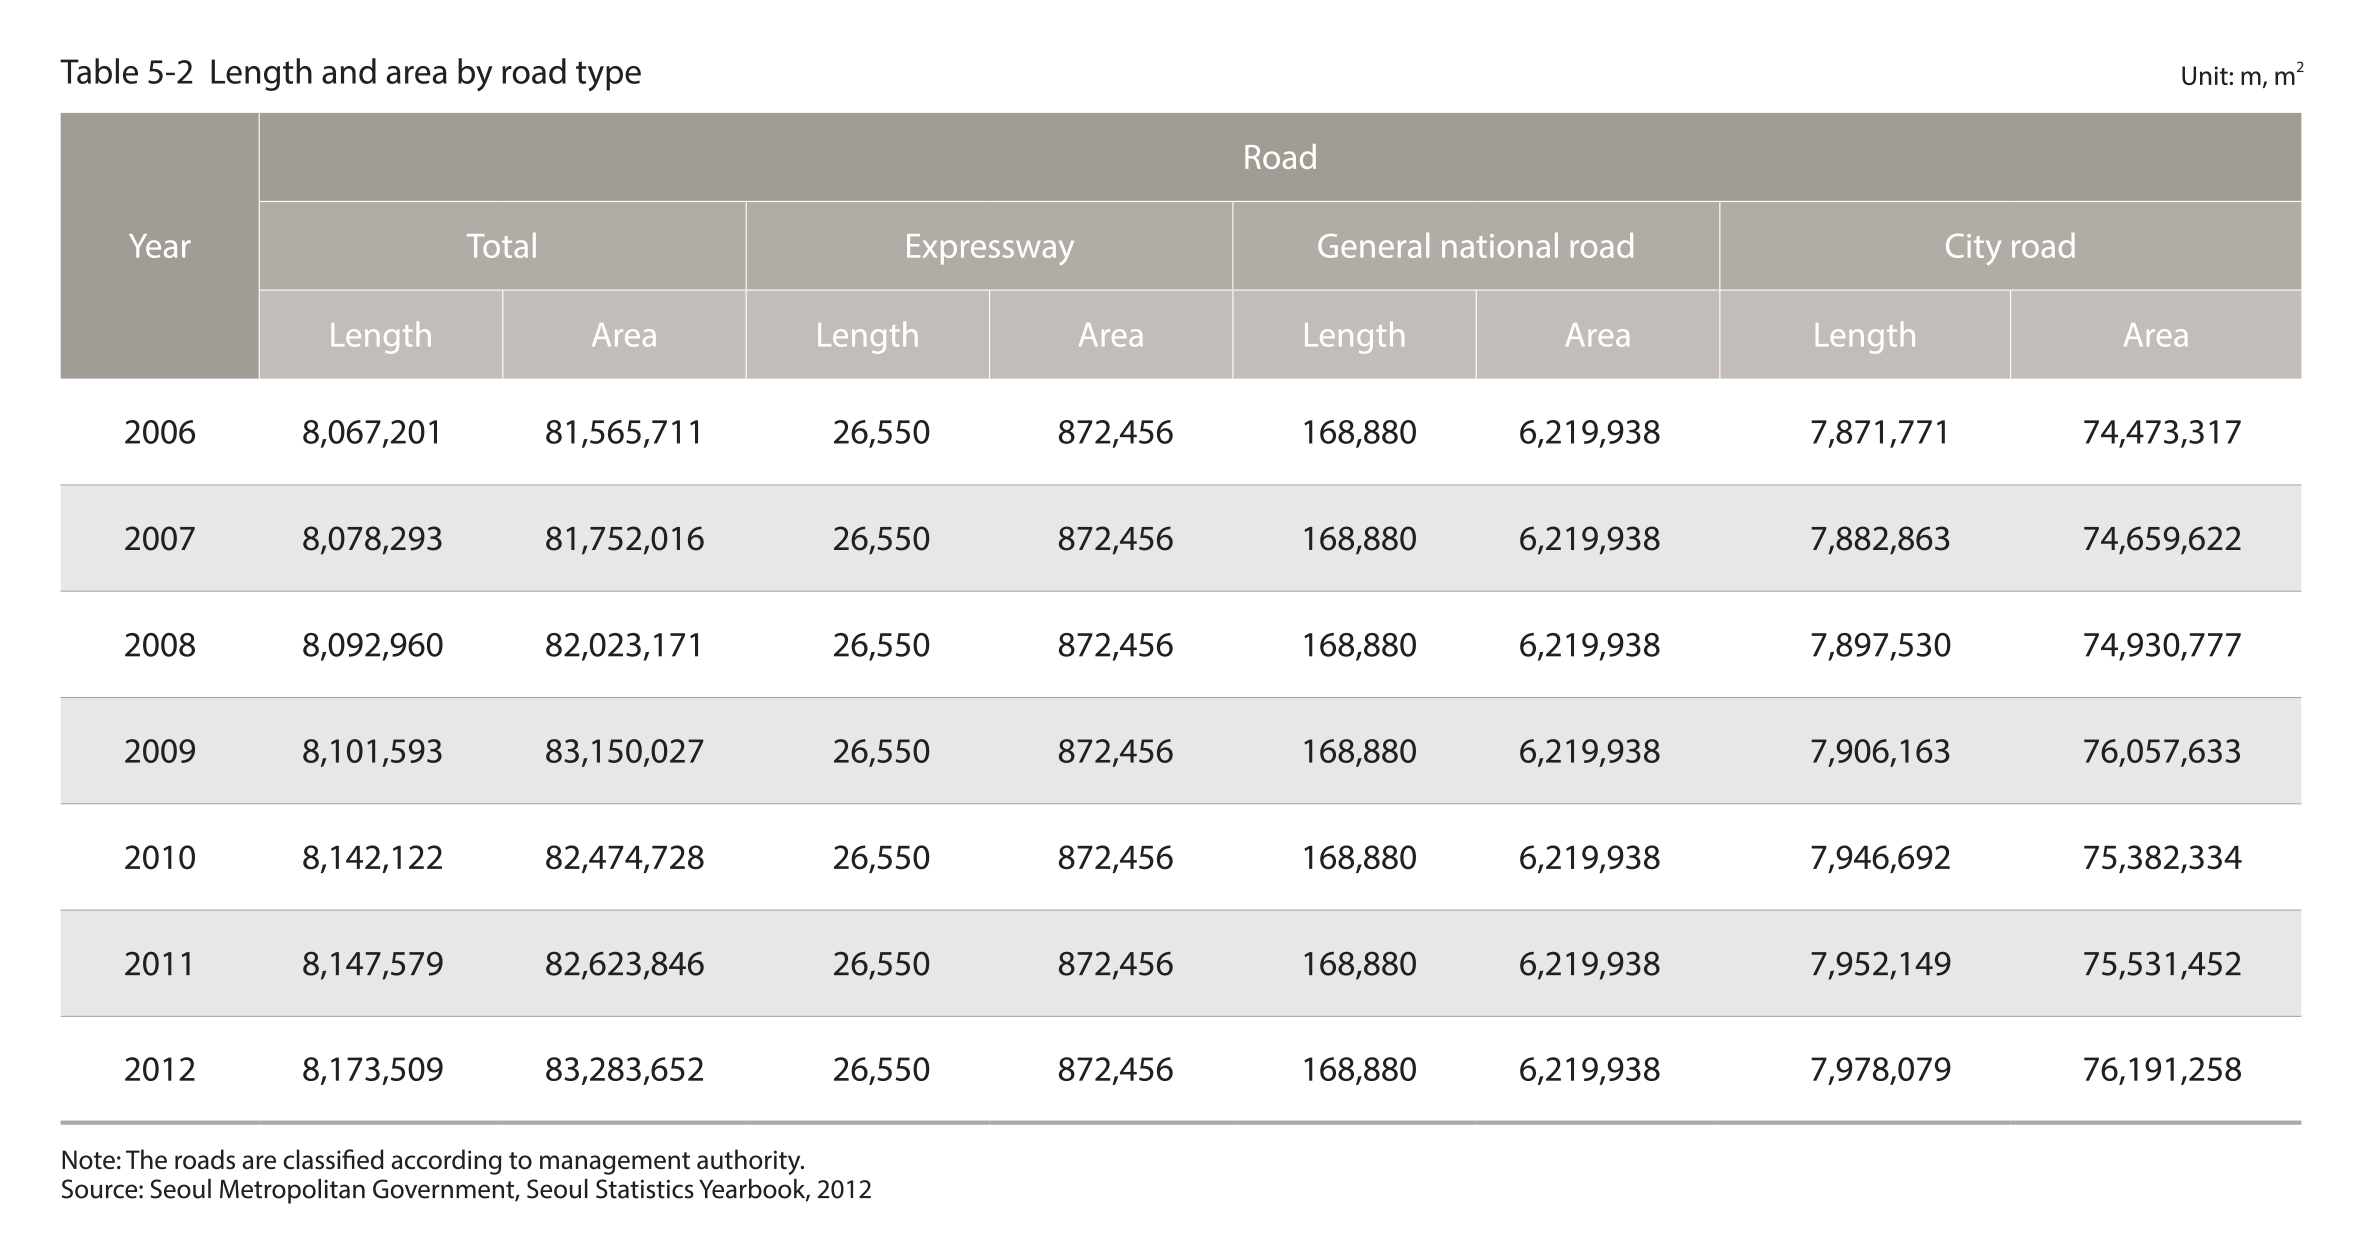
26,500m of expressways, 168,880m of general national roads and 7,952,149m of city roads in Seoul as of 2012
A review of the changes in the length of the roads by road type from 2006 to 2012 showed that there were no changes in the length of the expressways and general national roads, which were 26,550m and 168,880m respectively, while the length of the city roads increased by 25,930m from 7,871,771m in 2006 to 7,978,079m in 2012.
Source : Seoul Metropolitan Government, Seoul Statistics Yearbook, 2012
2. Energy and Environment
2.1. Energy Consumption
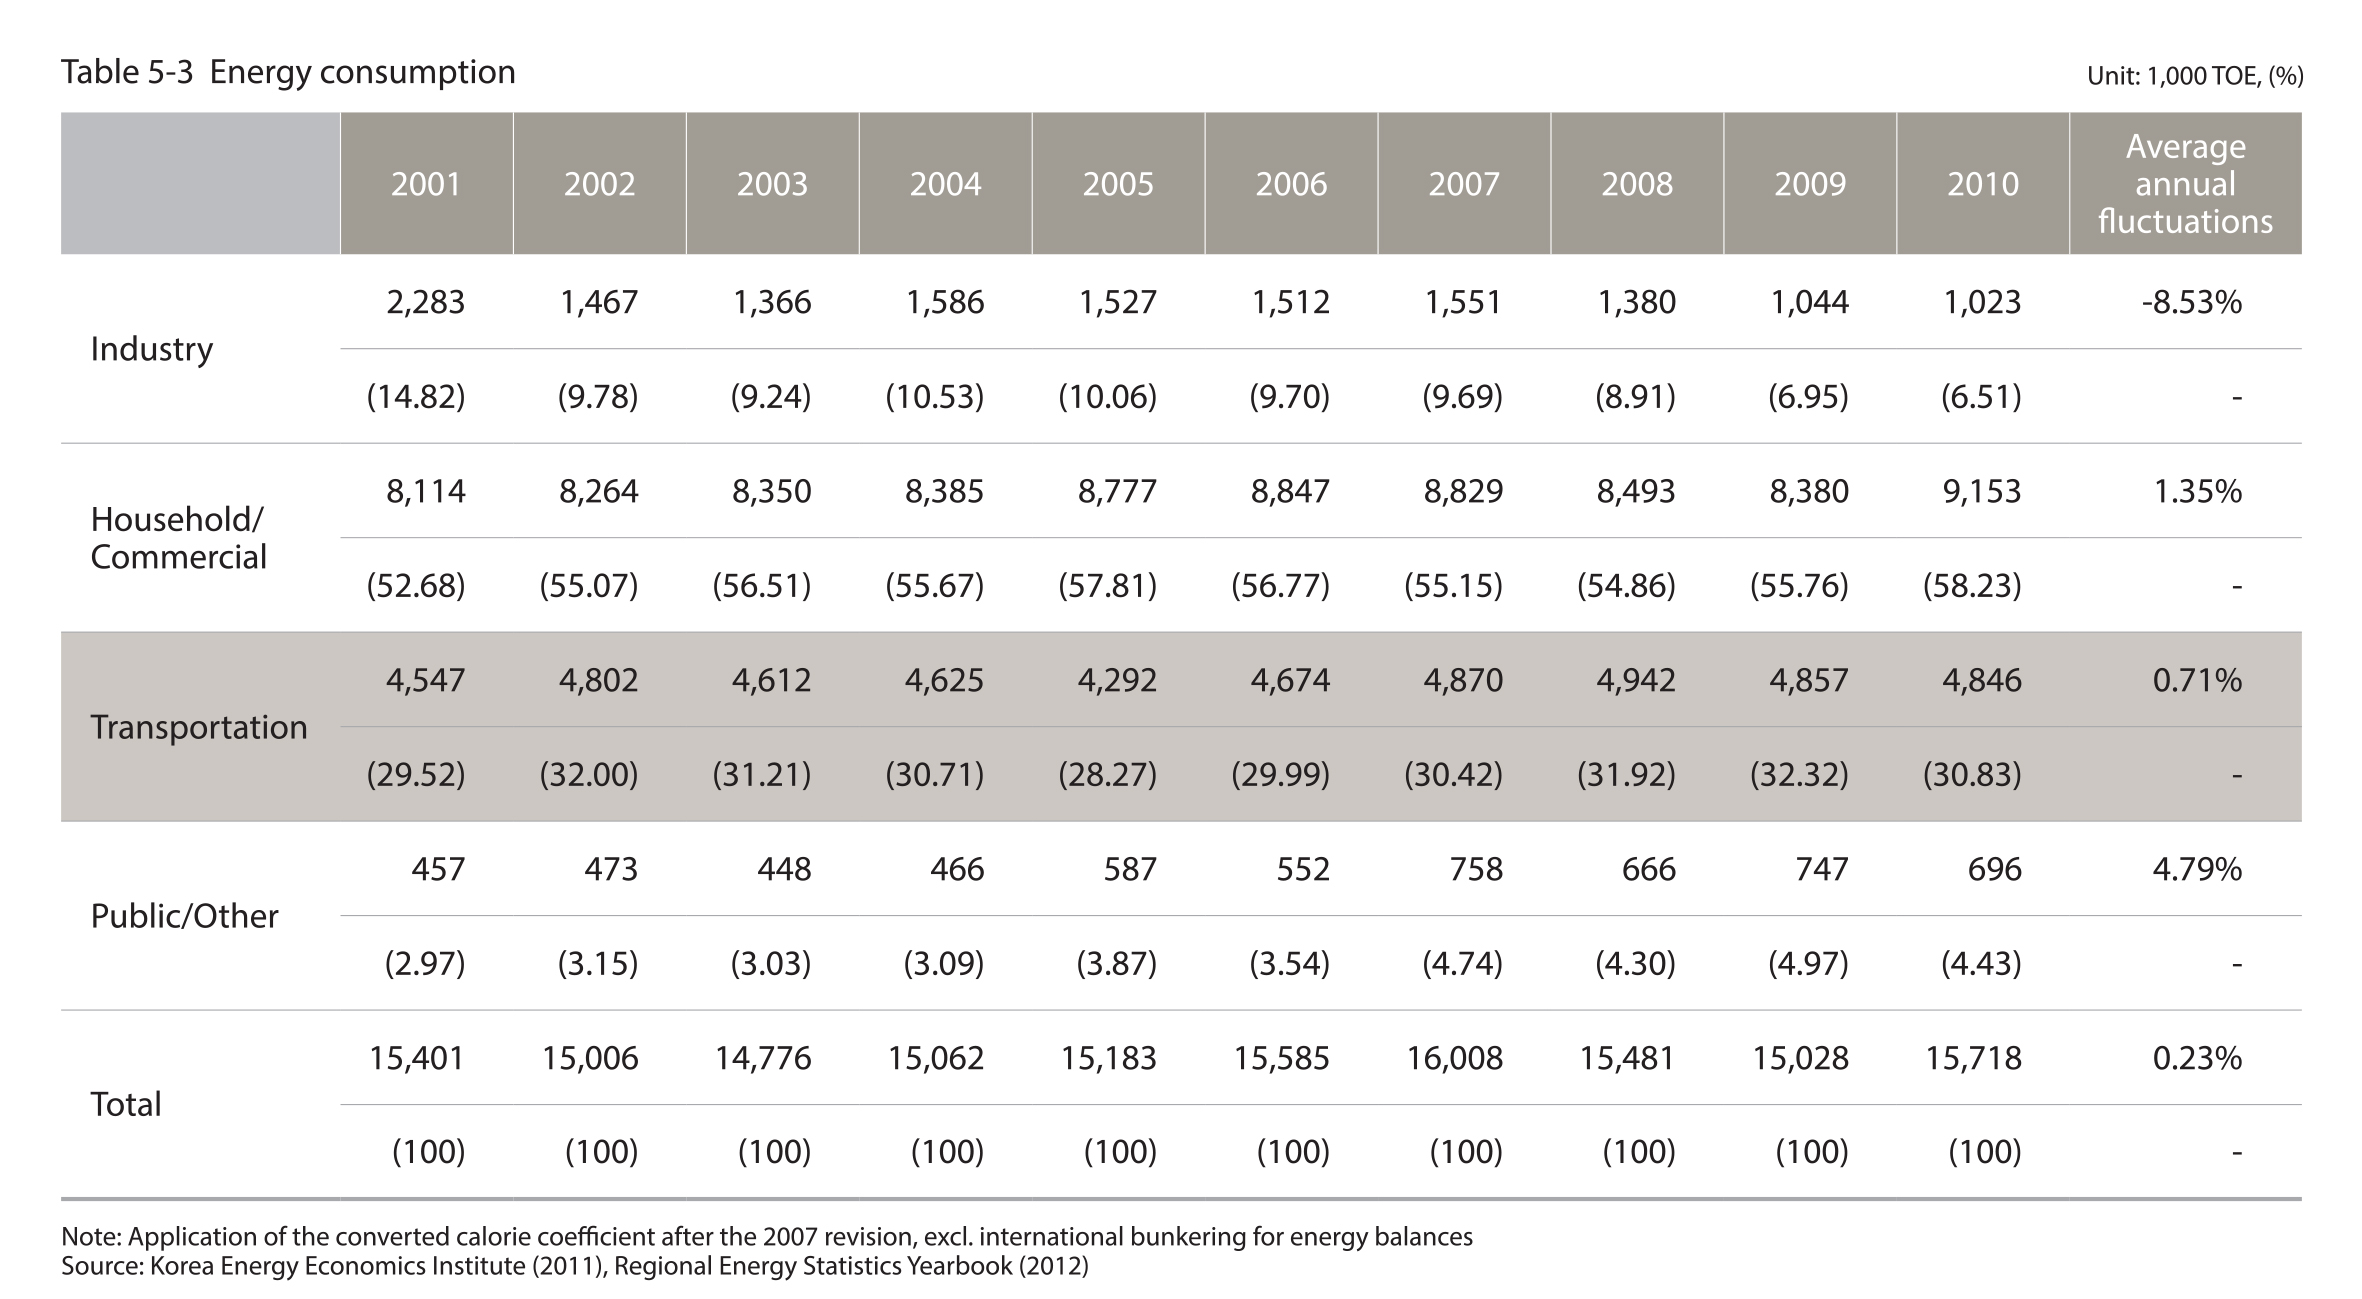
30.8% of the energy consumption in Seoul in 2010 occurred in the transportation sector
In Seoul in 2010, the transportation sector accounted for 30.8% of the total energy consumption at 4,846,000 TOE. The energy consumption level of the transportation level, which had been showing a steady increase annually, dropped slightly in 2010, but it still accounts for a large portion of the total energy consumption.
Source : Korea Energy Economics Institute (2011), Regional Eneery Statistics Yearbook (2012)
2.2. GHG Emissions
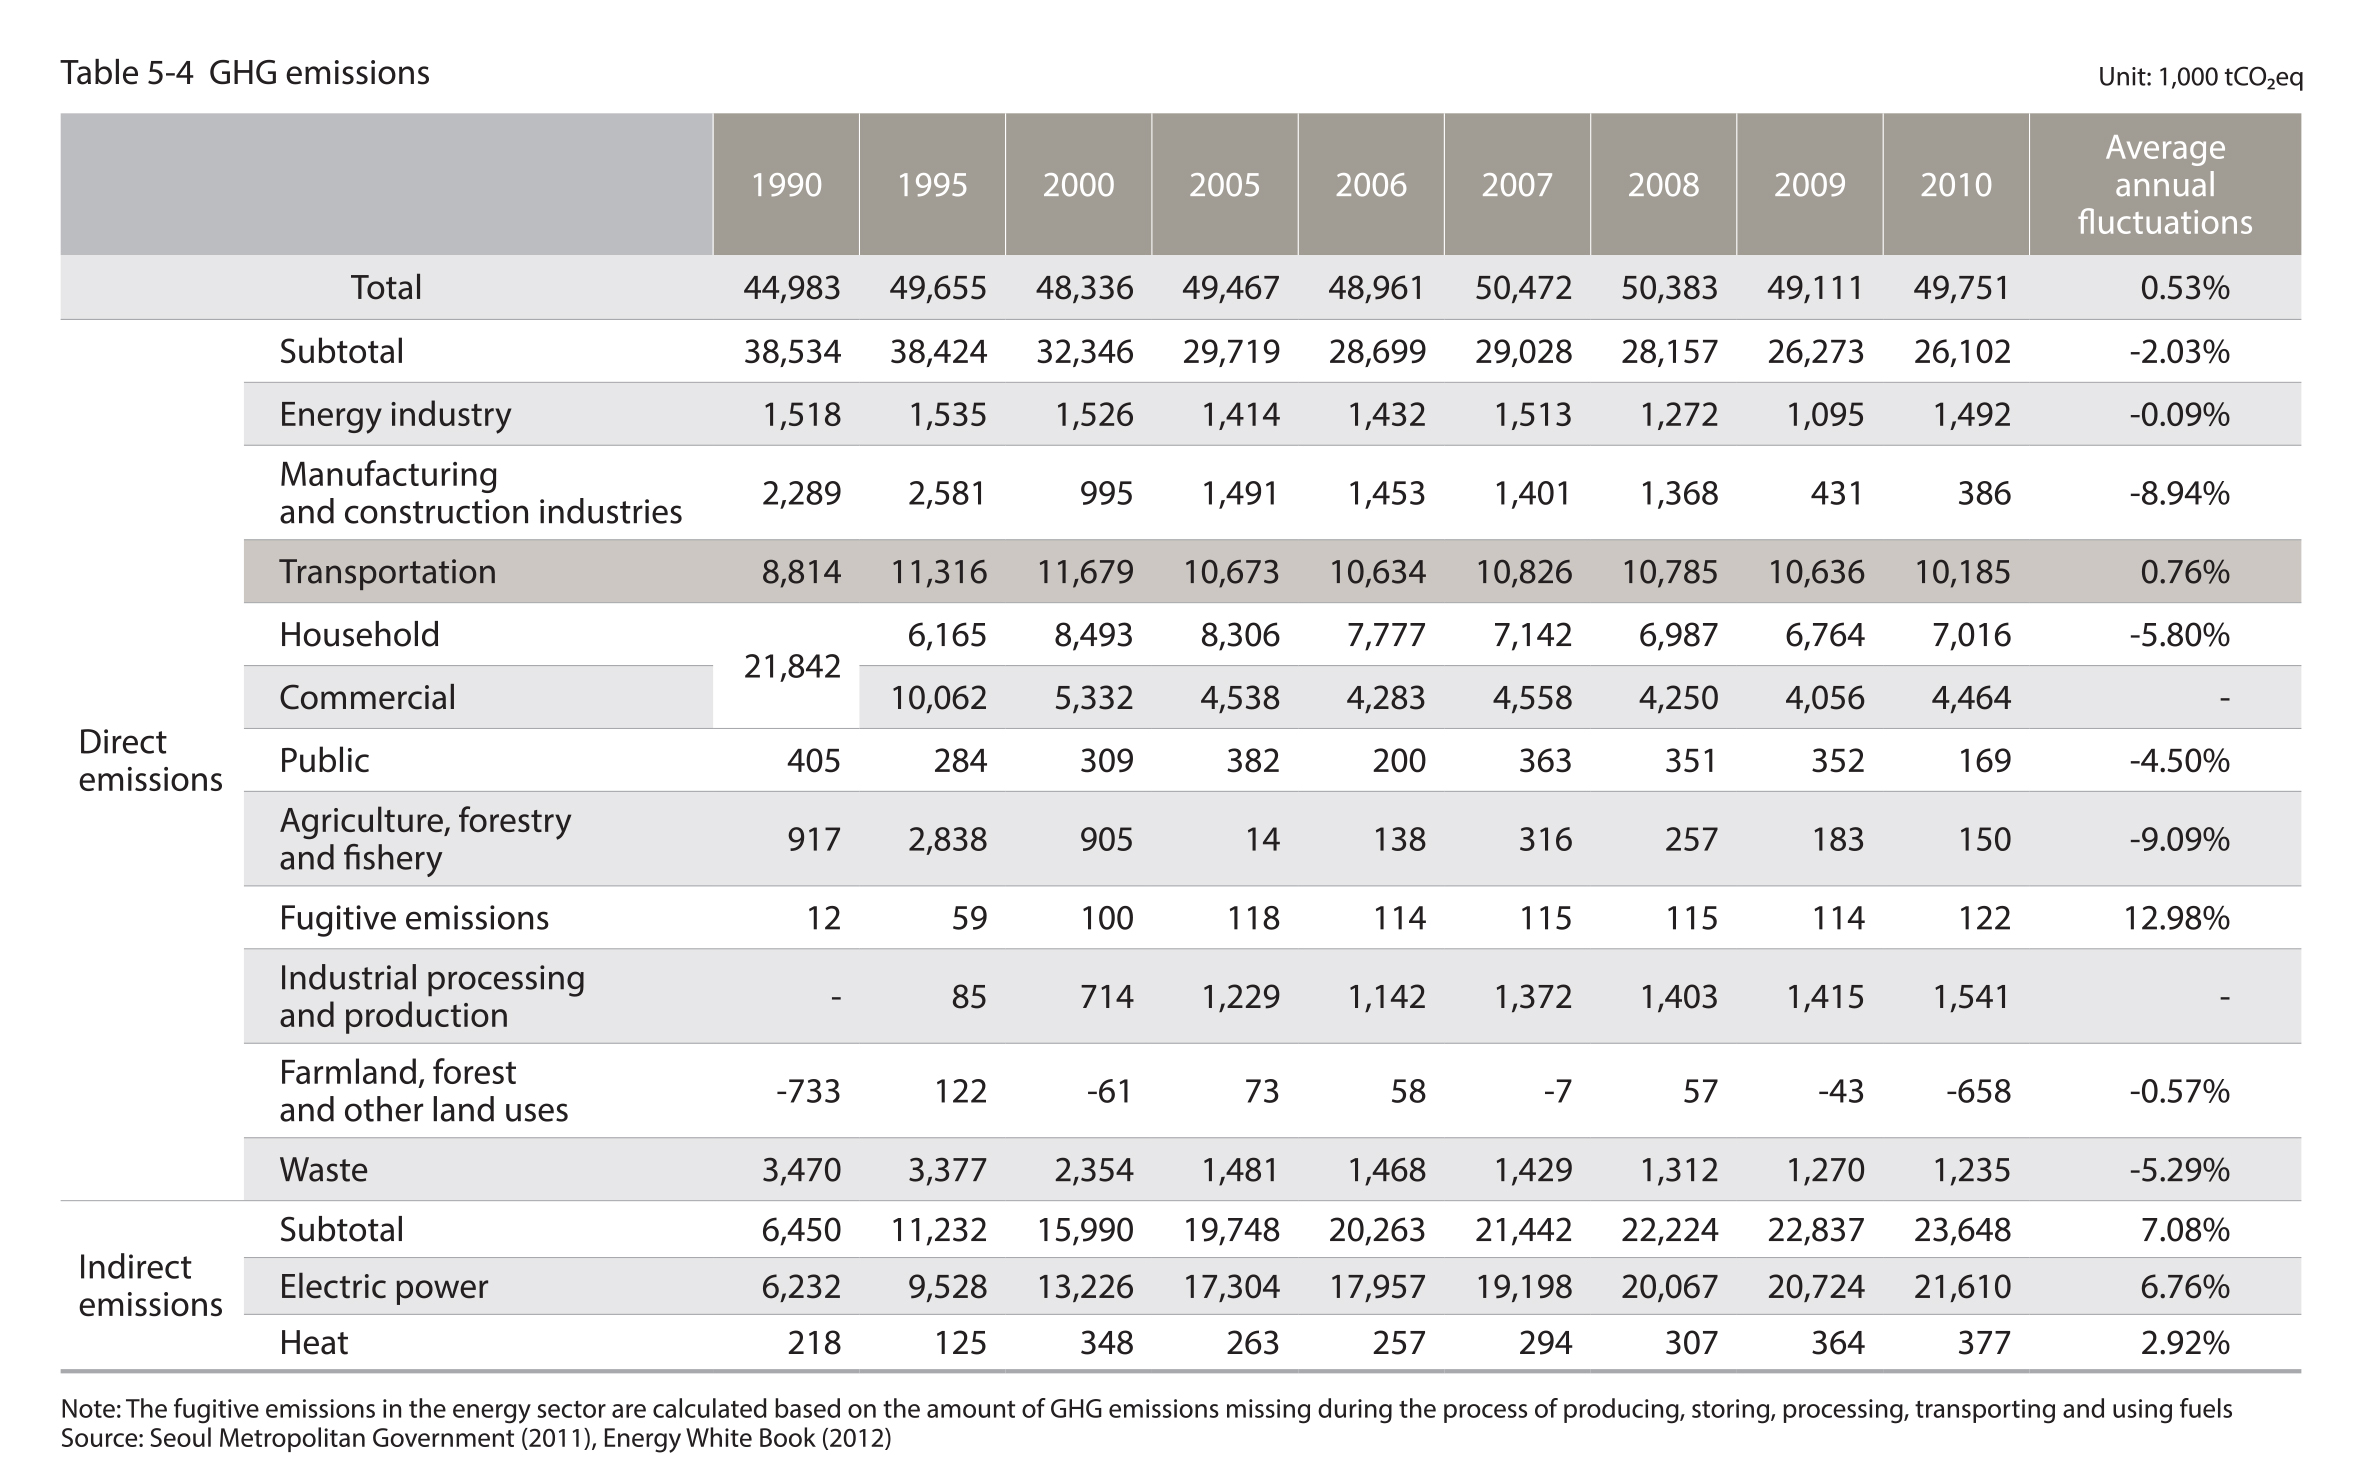
GHG emissions in the transportation sector in Seoul recorded to be 10,185,000 tCO2 eq in 2010
The greenhouse gas (GHG) emissions in the transportation sector account for the largest proportion of the total GHG emissions in Seoul, and it increased by 0.76% (1,371,000tCO2eq) annually on average from 8,814,000tCO2eq in 1990 to 10,185,000 in 2010.
Source : Seoul Metropolitan Government (2011), Energy White Book (2012)
3. Road Traffic Safety
3.1. Traffic Accidents
1,677 traffic accidents per 100,000 people and 491 traffic accidents per 10,000 vehicles (2011)
The number of traffic accidents per 100,000 people in Seoul decreased by 12.7% (244 cases) from 1,921 in 2009 to 1,677 in 2011. The number of traffic accidents per 10,000 vehicles in Seoul decreased by 13.2% (75 cases) from 566 in 2009 to 491 in 2011.
2,463 injured people per 100,000 people and 721 injured people per 10,000 vehicles (2011)
The number of injured people per 100,000 people in Seoul decreased by 8.6% (232 people) from 2,695 in 2009 to 2,463 in 2011. The number of injured people per 10,000 vehicles decreased by 9.2% (73 people) from 793 in 2009 to 721 in 2011.
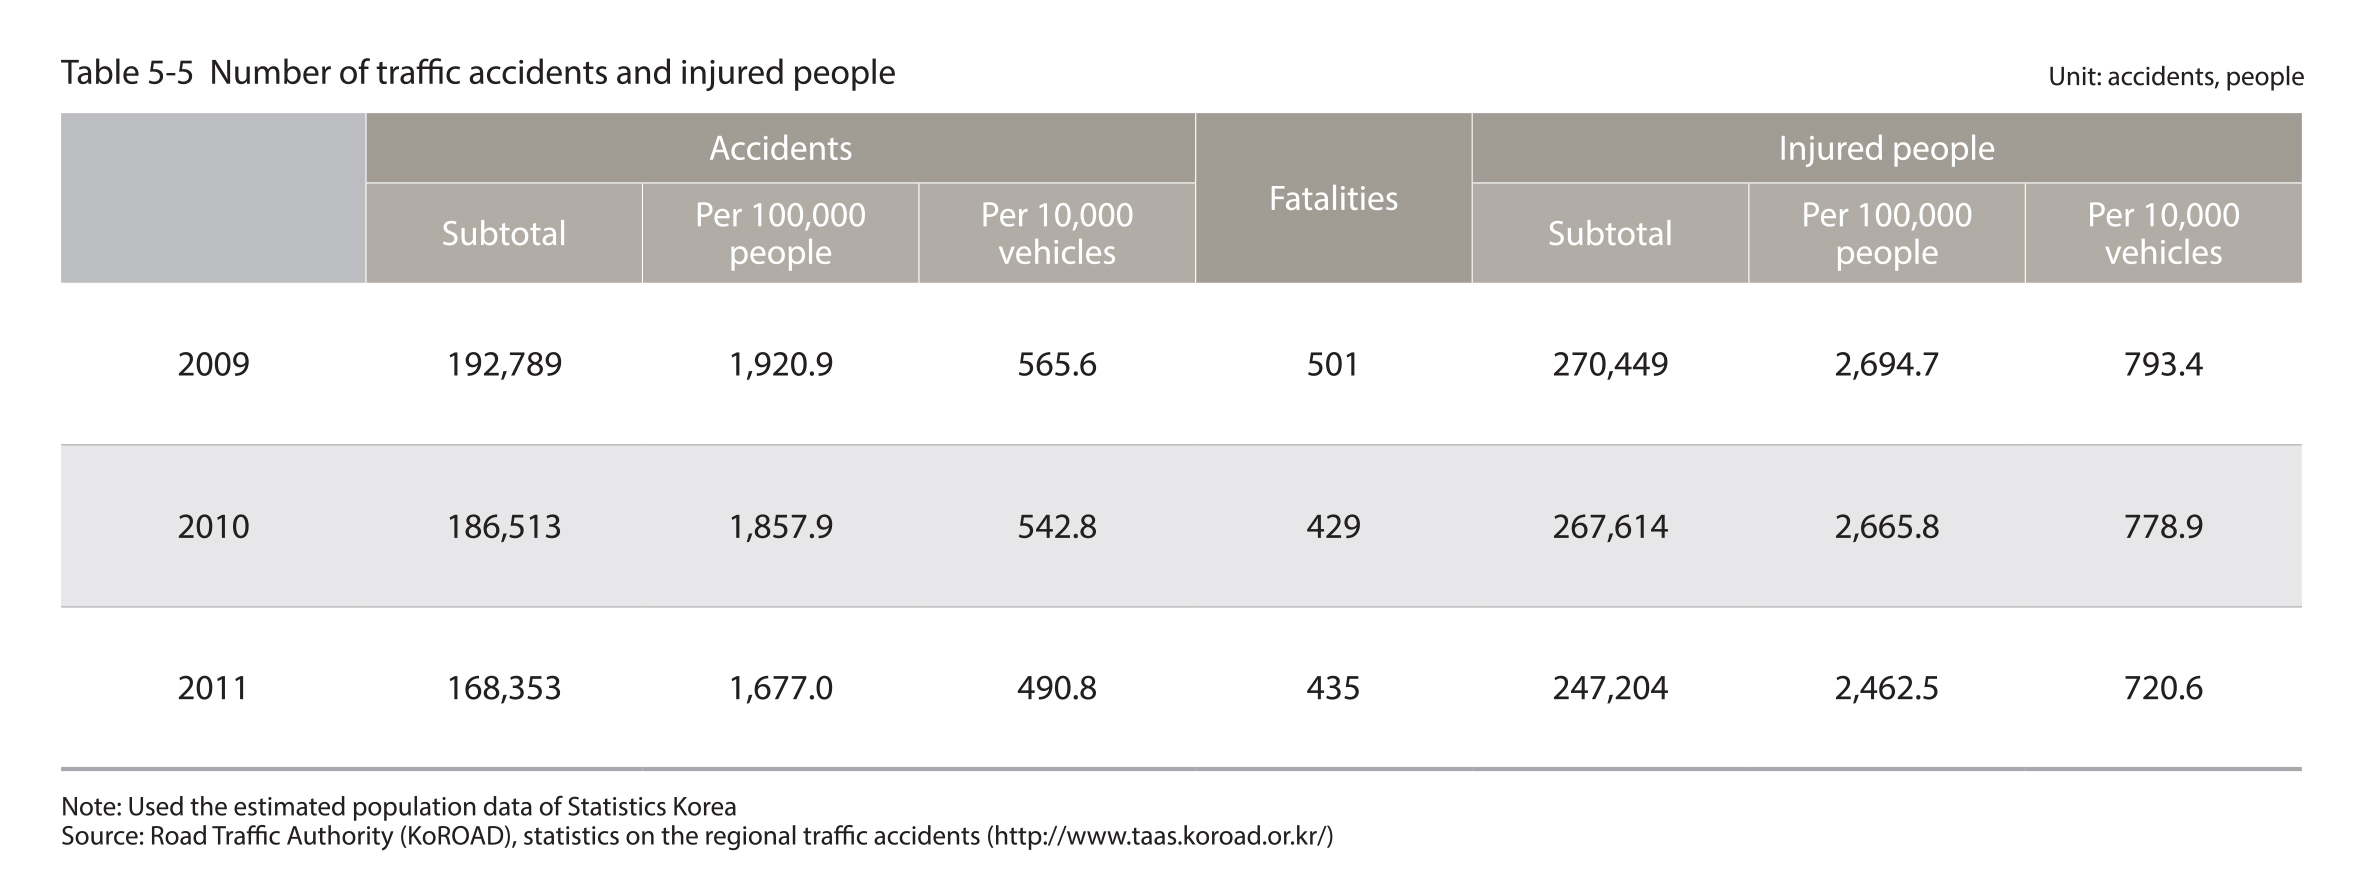
Source : Road traffic Authority (KoROAD), statistics on the regional traffic accidents (http://taas.koroad.or.kr/)
3.2. Pedestrian Accidents
246 pedestrian deaths in 2011 and half of the fatalities resulted while crossing the road
Total pedestrian fatalities in Seoul increased by 12.3% (27 deaths) from 2007 to 246 in 2011. The most common cause of pedestrian fatalities in 2011 was an accident occurring while the pedestrian was crossing the road, and this accounted for 56.5% of all pedestrian accidents. Based on this, it is deemed that there are still many risk factors related to pedestrian crossing.
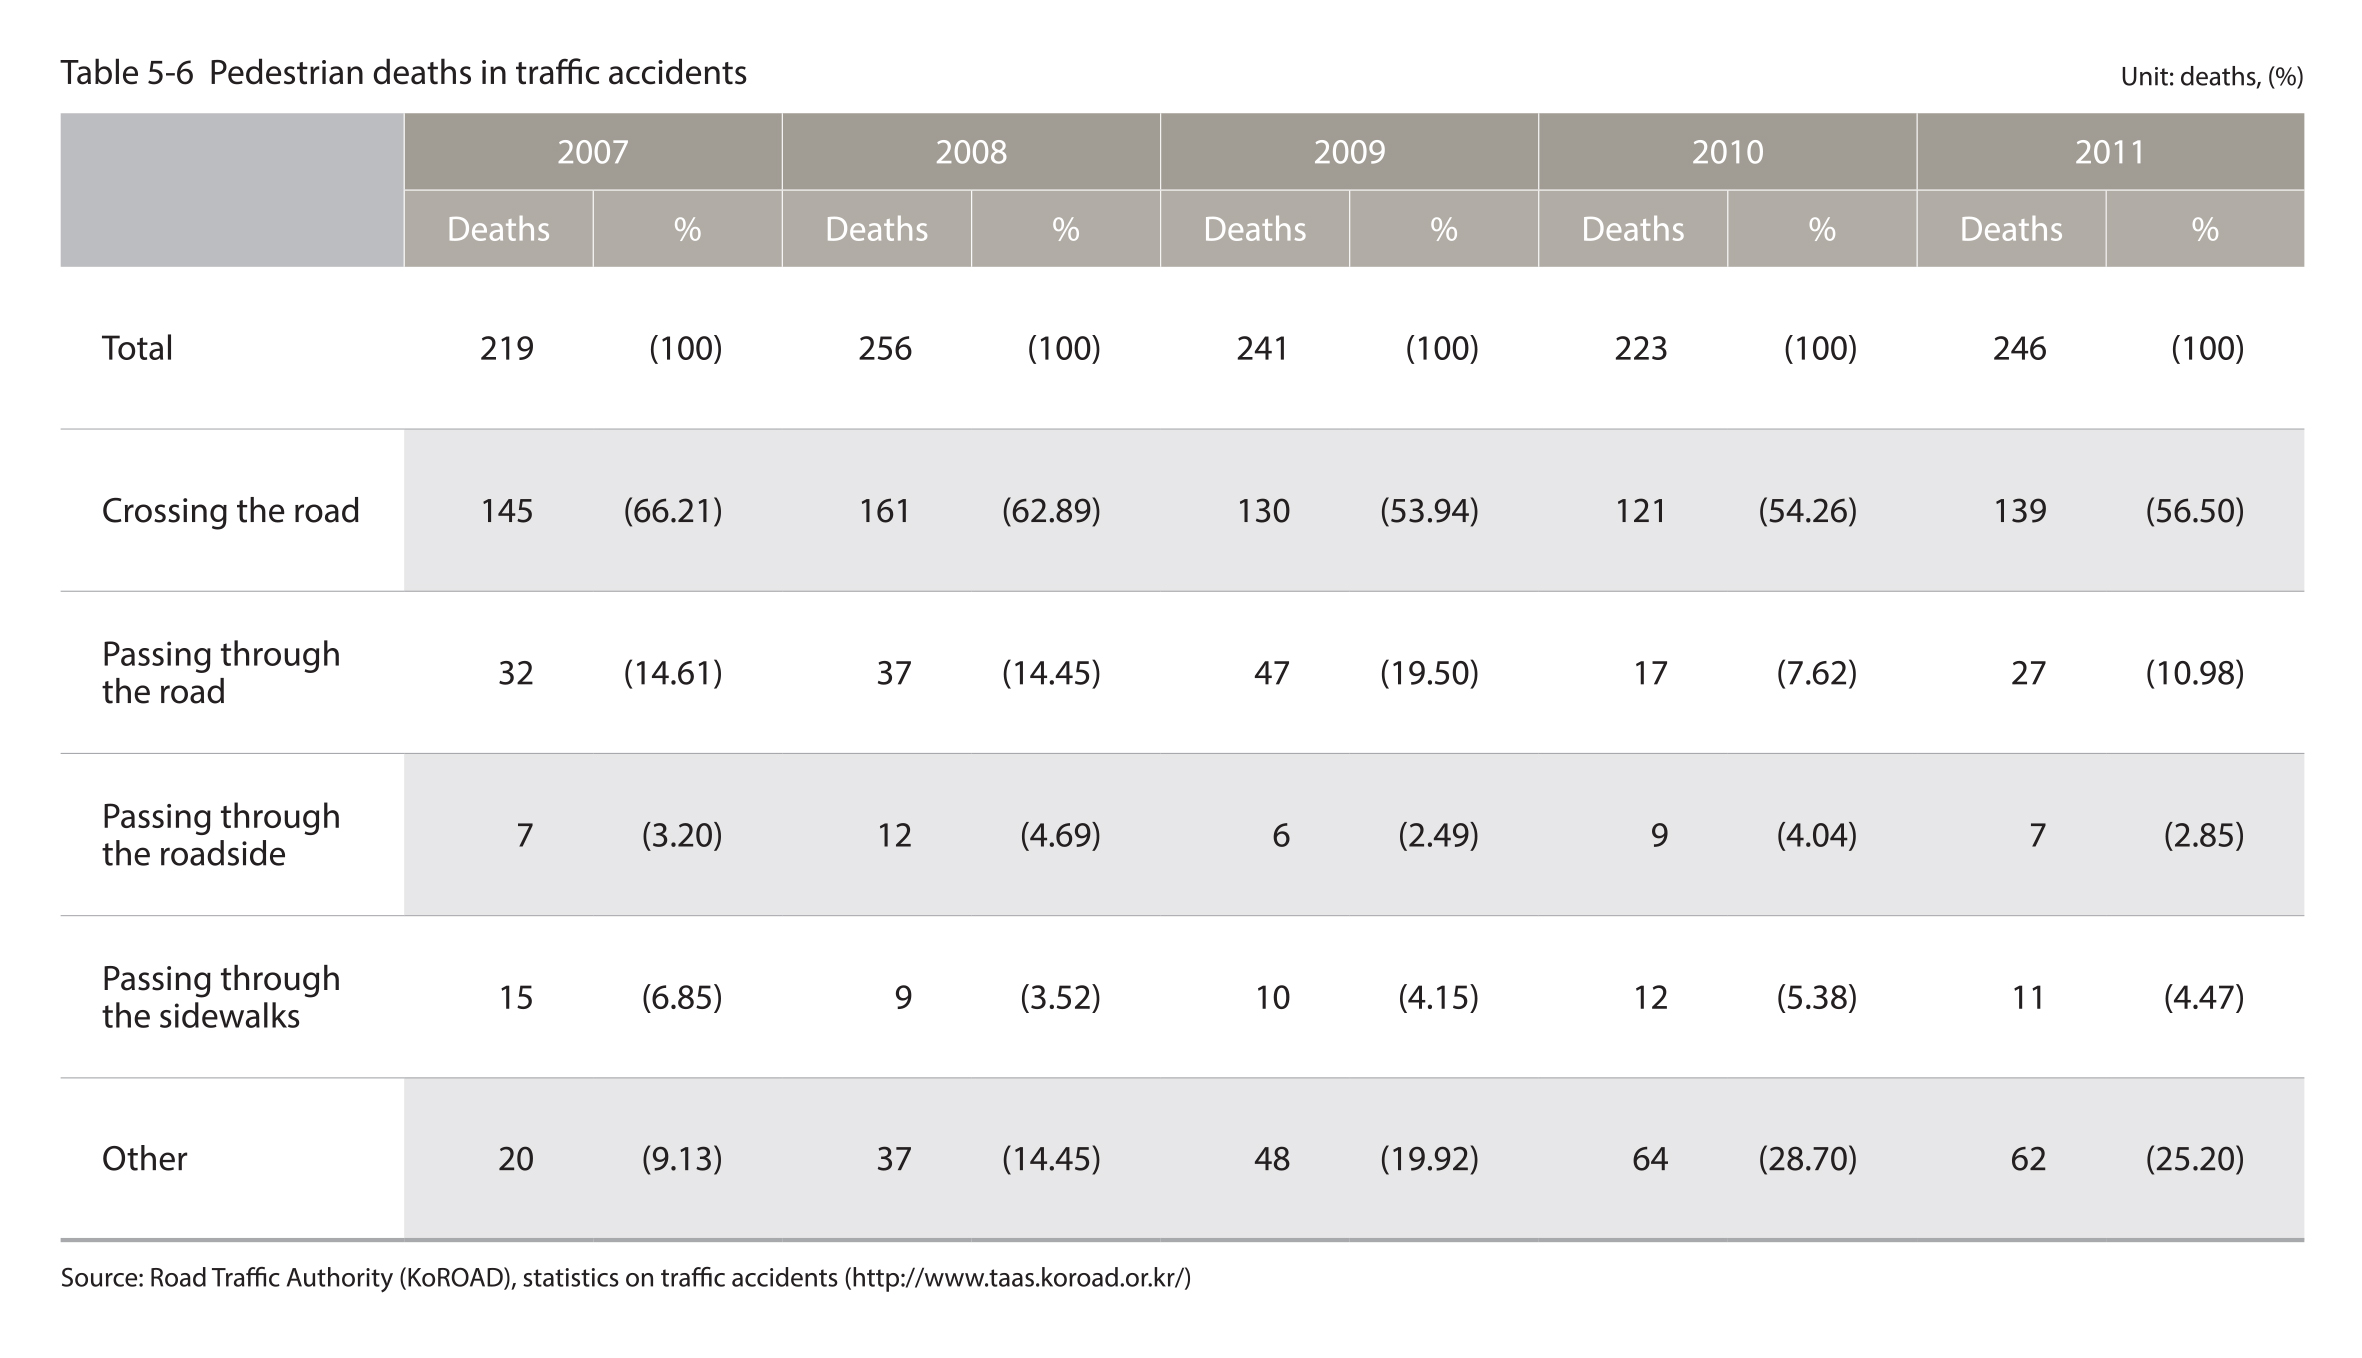
Source : Road Traffic Authority (KoROAD), statistics on traffic accidents (http://taas.koroad.or.kr/)
3.3. Traffic Accidents by Age Groups
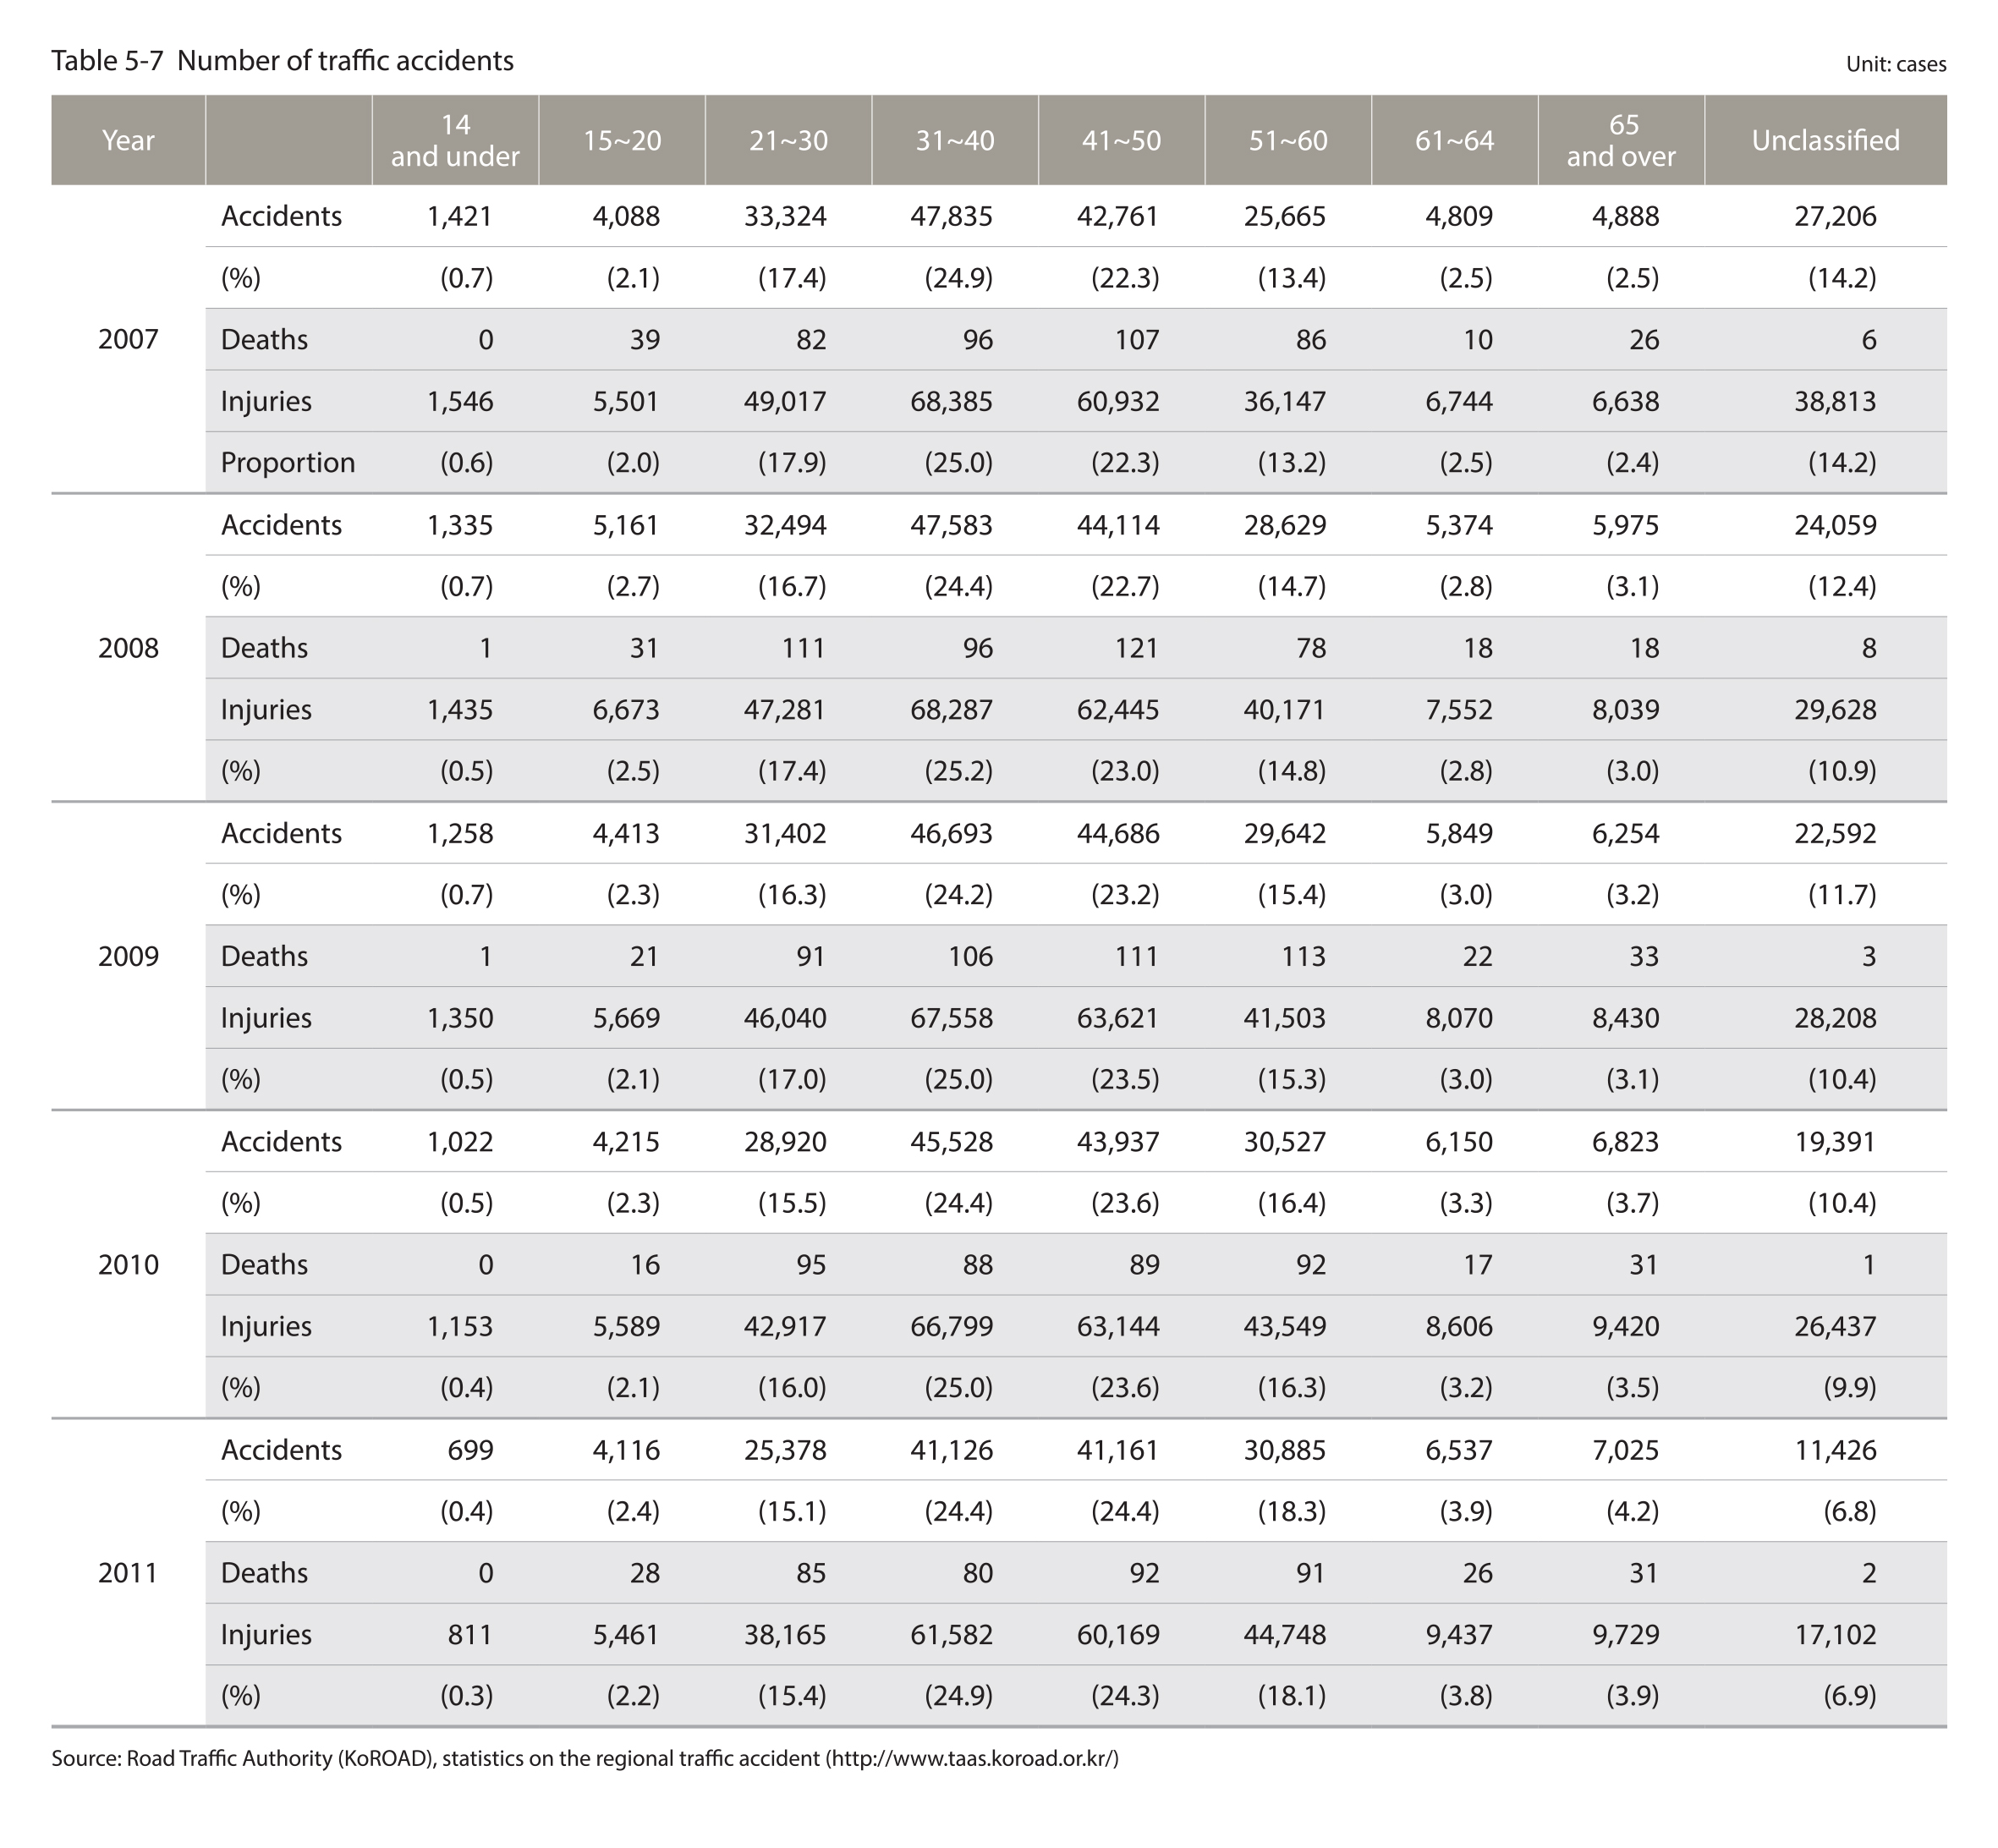
Traffic accidents involving seniors aged 65 and over increased and there were 7,025 such traffic accidents in 2011
Nearly half (48.8%) of all traffic accidents that occurred in Seoul in 2011 involved people between the ages of 31 and 50. The number of traffic accidents involving children ages 14 and under decreased by 722 from 1,421 in 2007 to 699 in 2011, whereas traffic accidents involving seniors ages 65 and over increased by 2,137 cases from 4,888 in 2007 to 7,025 in 2011.
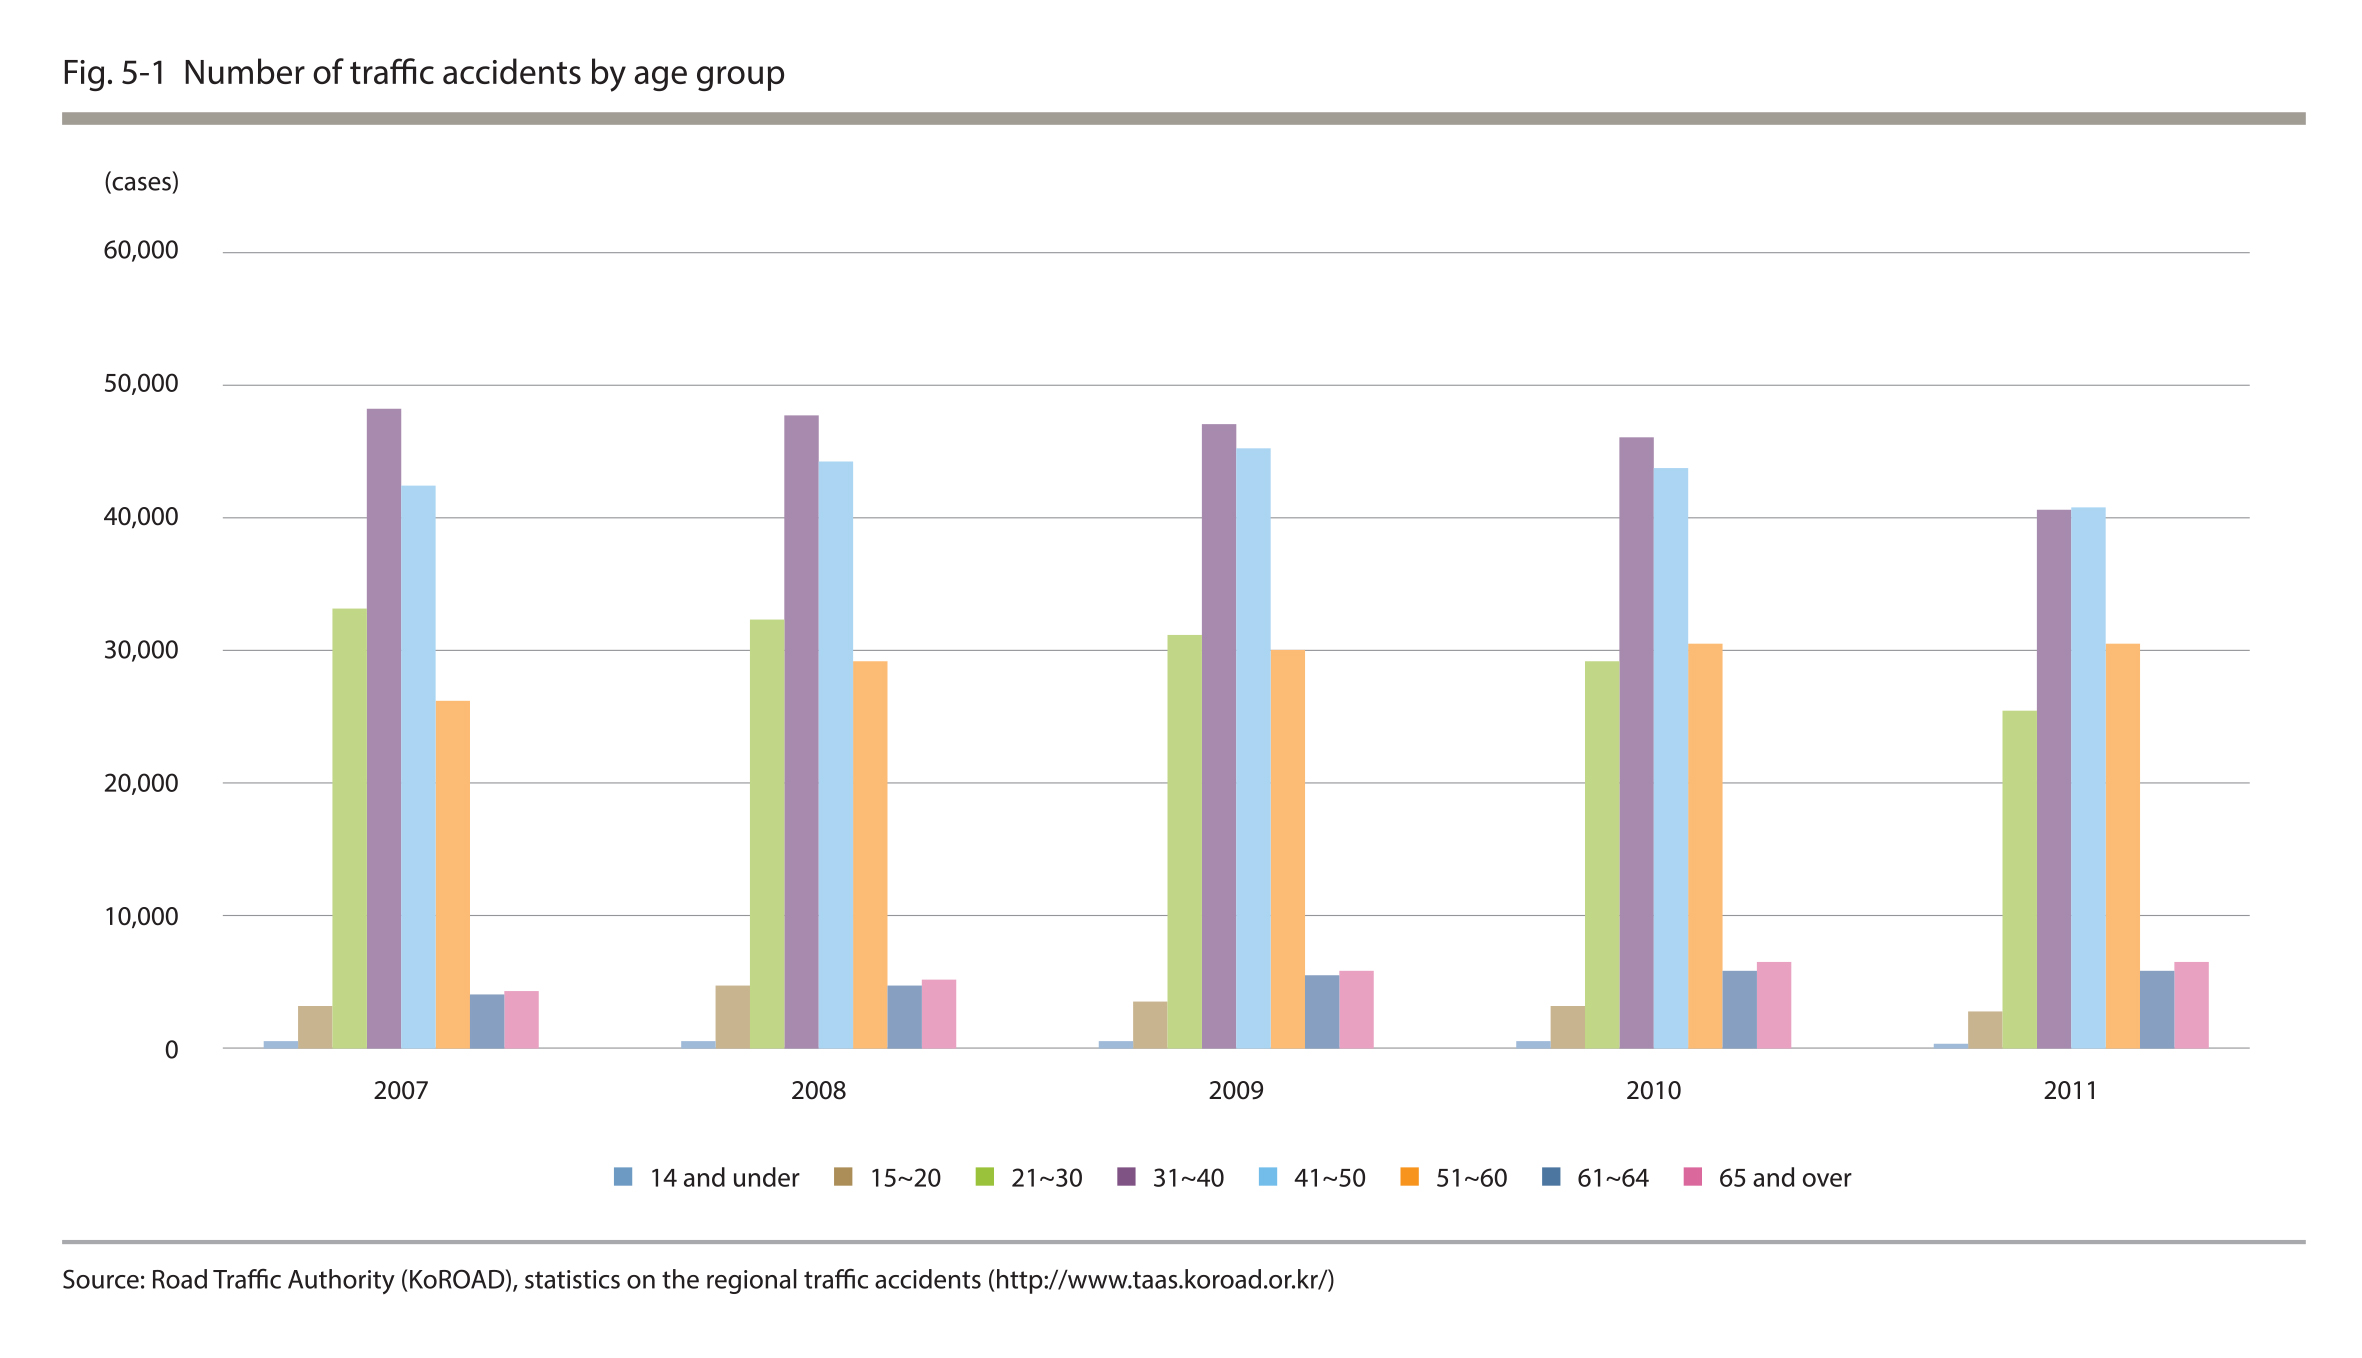
Source : Road Traflic Authority (KoROAD), statistics on the regional traflic accidents (http://taas.koroad.or.kr/)
Source : Road Traffic Authority (KoROAD), statistics on the regional traffic accidents (http://taas.koroad.or.kr/)