- 수도권
토지이용현황
-
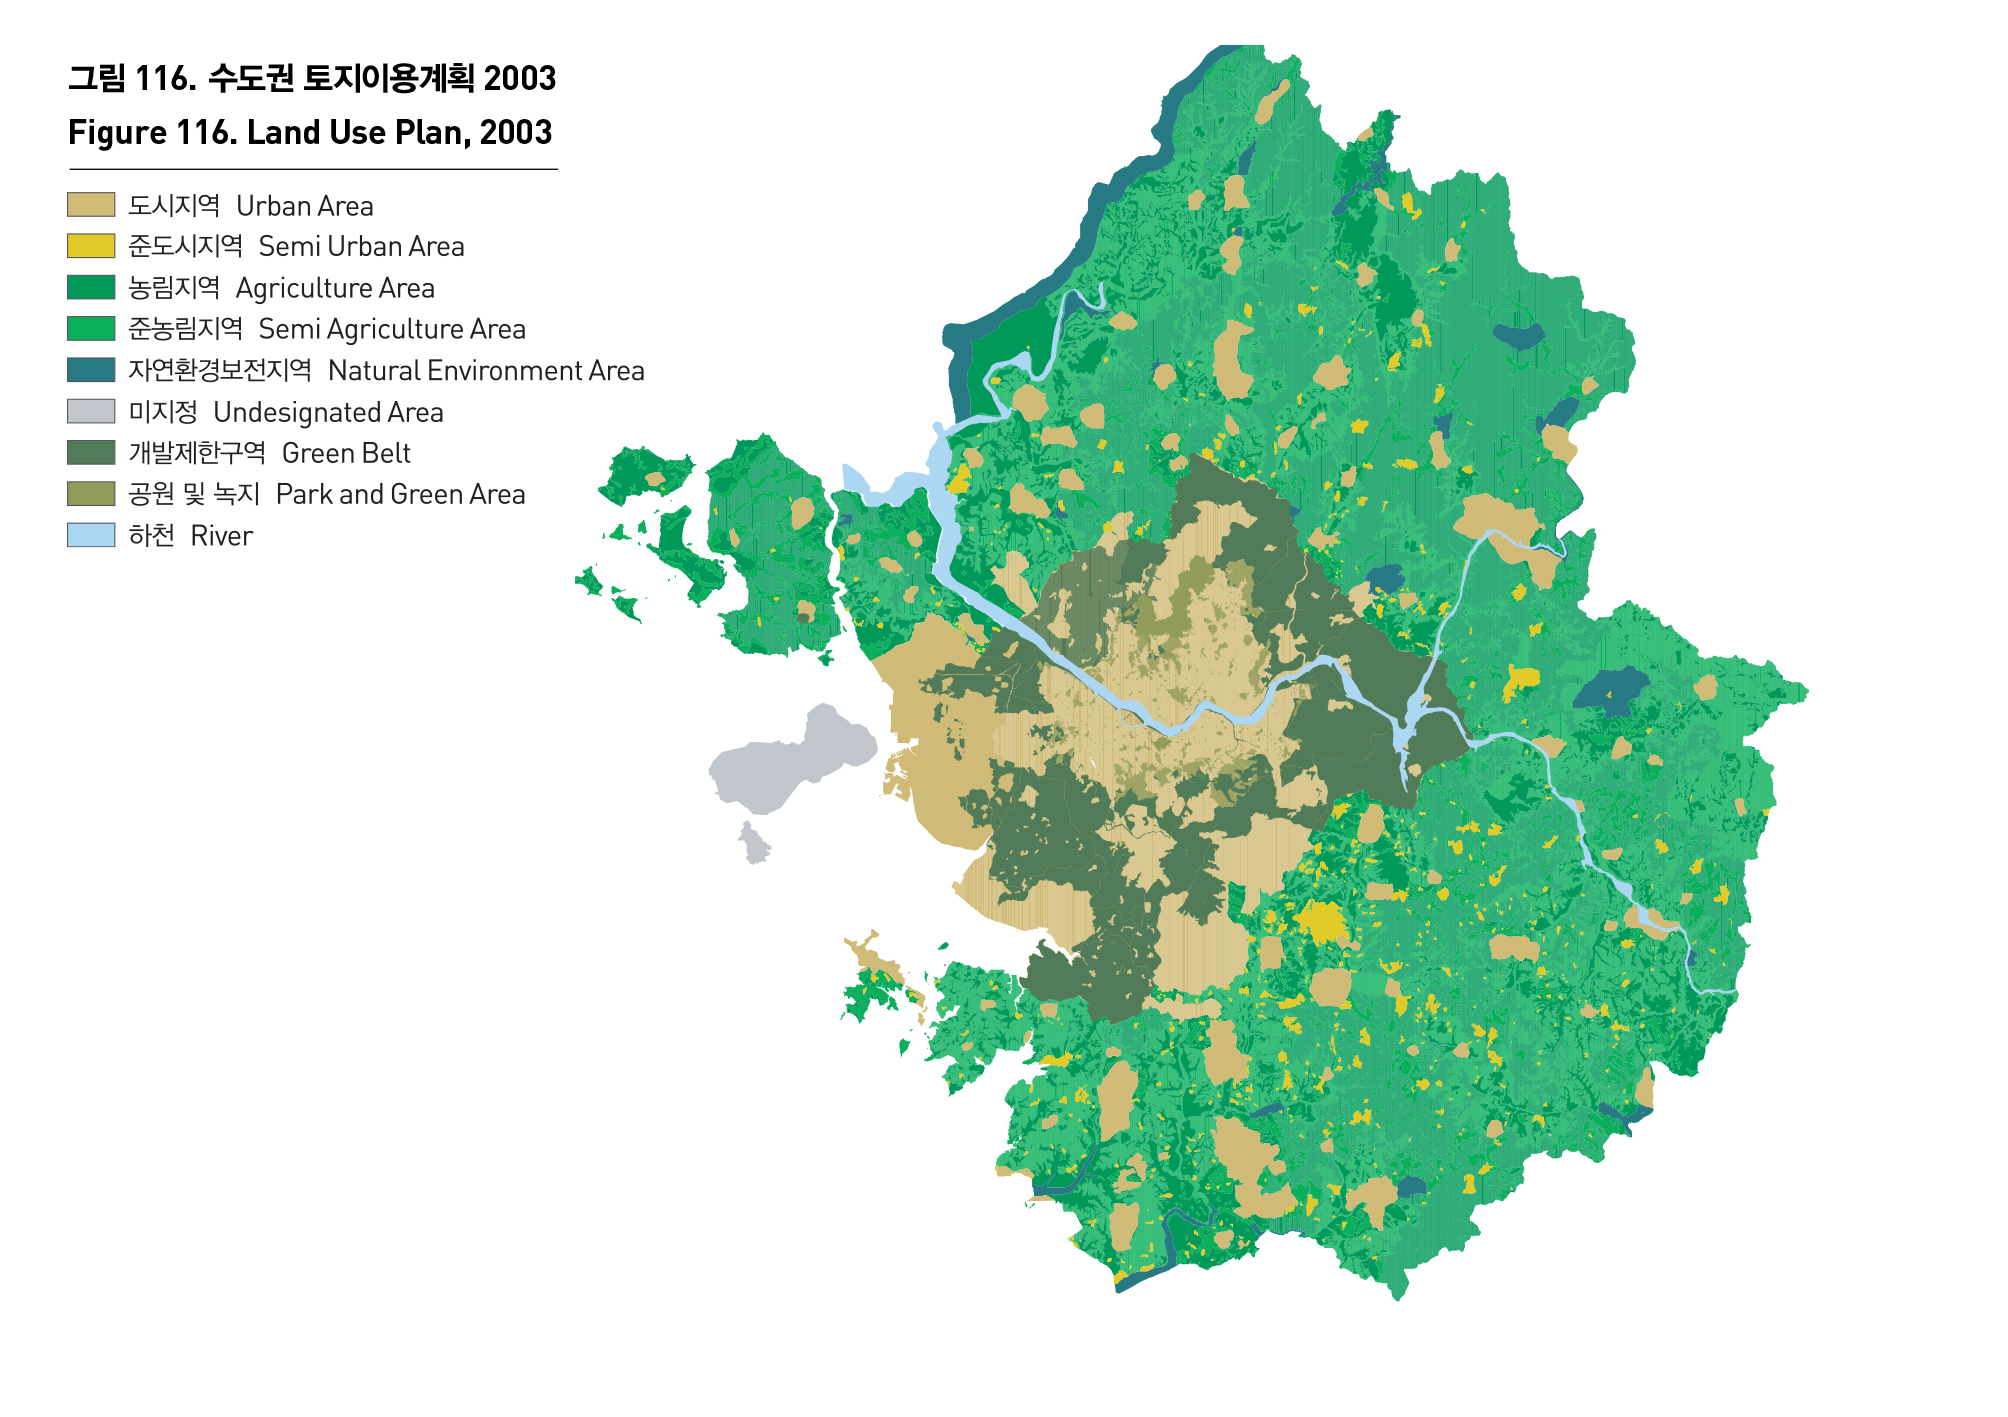
토지이용
수도권의 지목별 토지이용 변화추이를 살펴보면 전·답, 임야 등 농업용 토지면적 비율은 감소하고 있으며, 시가지지역에 해당하는 대지, 공공용지 등의 토지면적 비율은 지속적으로 증가하는 추세이다. 단, 인천의 경우는 행정구역의 조정으로 시가지의 비율이 감소했다가 증가하는 현상이 나타나고 있다.
특히, 서울시는 농업용 면적 비율이 1985년과 2005년 사이에 8.4%가 감소하였으며, 경기도의 경우에도 4.1%가 감소하였다. 반면, 시가지 지역의 면적은 같은 기간에 서울 6.3%, 경기도 3.2%가 증가하였다. 이러한 토지이용의 변화는 특히 간선도로 주변을 따라 심하며, 기존의 경인, 경부축과 더불어 경의축, 중부축, 경원축을 따라 분산화되고 있으며, 2000년 이후에는 화성, 파주, 남양주 등으로까지 확산되고 있다.
LAND USE
The change in metropolitan area's land use shows that the percentage of agricultural land such as paddies, dry fields, and forest lands is on the decline, and the percentage of builtup areas such as public lands and public areas is steadily rising. Due to adjustment of an administrative district, the percentage of built-up areas began to increase in Incheon.
The percentage of agricultural land in Seoul dropped by 8.4% from 1985 to 2005, and that of Gyeonggi-do declined by 4.1%. On the other hand, the percentage of built-up areas climbed by 6.3% in Seoul, and by 3.2% in Gyeonggi-do. The change in land use is noticeably remarkable along a trunk road, and is expanded into Seoul-Uiju axis, Jungbu axis and Seoul-Wonsan axis as well as Seoul-Incheon axis and Seoul-Busan axis, and even spread into Hwasung, Paju and Namyangju after 2000.

출처 : 서울특별시 서울통계연보, 경기도 경기통계연보, 인천광역시 인천통계연보 1986, 1996, 2006
경기개발연구원 내부자료
환경부, 환경지리정보서비스 http://egis.me.go.kr/egis

* 토지지목별 분류체계 부록 참조